Download presentation
Presentation is loading. Please wait.

1
2.1 Discrete and Continuous Variables 2.1.1 Discrete Variable 2.1.2 Continuous Variable

2
2.1.1 Discrete Variable These are the heights of 20 children in a school. The heights have been measured correct to the nearest cm. For example. For example 144 cm ( correct to the nearest cm) could have arisen from any value in the range 143.5cm h < 144.5 cm. Other examples of continuous data are the speed of vehicles passing a particular point, the masses of cooking apples from a tree, the time taken by each of a class of children to perform a task. **Continuous data cannot assume exact value, but can be given only within a certain range or measured to a certain degree of accuracy,** 133 136 120 138 133 131 127 141 127 143 130 131 125 144 128 134 135 137 133 129
 could have arisen from any value in the range 143.5cm h < cm. Other examples of continuous data are the speed of vehicles passing a particular point, the masses of cooking apples from a tree, the time taken by each of a class of children to perform a task. **Continuous data cannot assume exact value, but can be given only within a certain range or measured to a certain degree of accuracy,**")
3
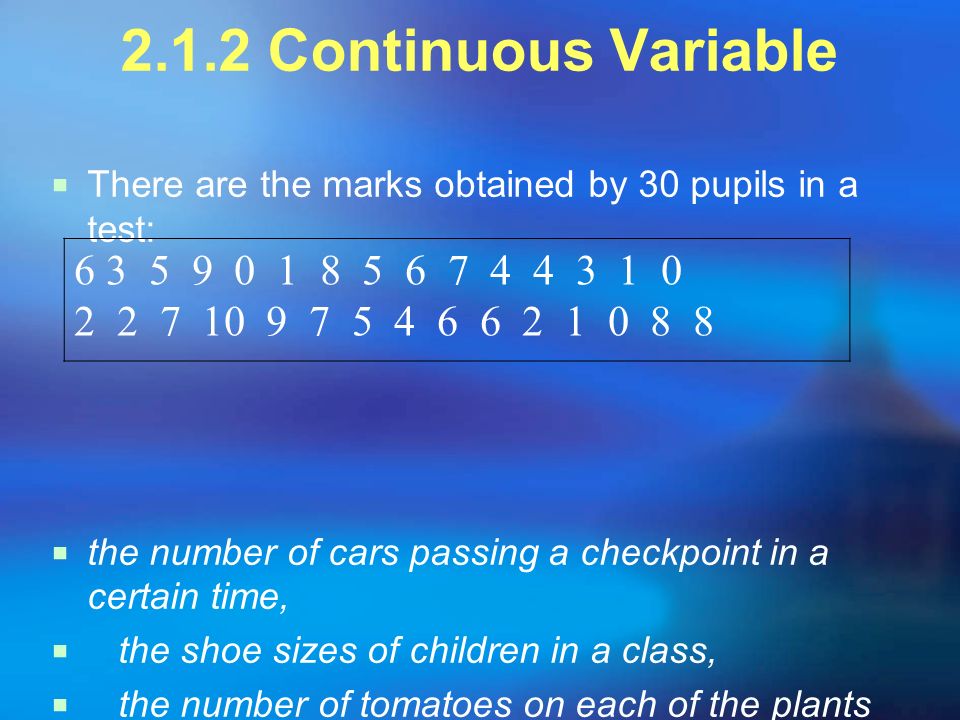
2.1.2 Continuous Variable There are the marks obtained by 30 pupils in a test: the number of cars passing a checkpoint in a certain time, the shoe sizes of children in a class, the number of tomatoes on each of the plants in a greenhouse. 6 3 5 9 0 1 8 5 6 7 4 4 3 1 0 2 2 7 10 9 7 5 4 6 6 2 1 0 8 8
4
2.2 Frequency Tables 2.2.1 Frequency Tables for Discrete Data 2.2.2 Frequency Tables for Continuous Data Relative Frequency is, where ri is the relative frequency for the class i and N = Percentage Frequency can be obtained by multiplying the relative frequency by 100%. ri

5
2.2.1 Frequency Tables for Discrete Data No. of vehicles passing per minute, x Frequency% frequencycumulative % frequency 6 or below15 7-814 9-1015 11-1212 13-1411 15 or above3 Total

6
2.2.2 Frequency Tables for Continuous Data WeightClass markfrequency% frequencycumulative % frequency 50.5 – 55.5 531 55.5 – 60.5 584 60.5 – 65.5 6315 65.5 – 70.5 6818 70.5 – 75.5 739 75.5 – 80.5 783 Total

8
2.3 Graphical Representation 2.3.1 Bar Charts 2.3.2 Histograms 2.3.3 Frequency Polygons and Frequency Curves 2.3.4 Cumulative Frequency Polygons and Curves 2.3.5 Stem-and-leaf Diagrams 2.3.6 Logarithmic graphs

9
2.3.1 Bar Charts The frequency distribution of a discrete variable can be represented by a bar chart.

10
2.3.2 Histograms A continuous frequency distribution CANNOT be represented by a bar chart. It is most appropriately represented by a histogram.

11
2.3.3 Frequency Polygons and Frequency Curves Frequency Polygons Frequency Curves Relative frequency polygons Relative frequency curves

12
2.3.4 Cumulative Frequency Polygons and Curves Example The heights of 30 broad bean plants were measured, correct to the nearest cm, 6 weeks after planting. The frequency distribution is given below. Construct the cumulative frequency table. Construct the cumulative frequency curve. Estimate from the curve the number of plants that were less than 10 cm tall; the value of x, if 10% of the plants were of height x cm or more. Height (cm)3-56-89-1112-1415-1718-20 Frequency12111051
 Frequency")
13
2.3.5 Stem-and-leaf Diagrams 1)In the below diagram, stems are hundreds and leaves are units. The set of data in the diagram represents: 111,123,147,148,223,227,355,363,380,421,4 23,500 Stem (in 100)Leaves (in 10) 111234748 22327 3556380 42123 500
Leaves (in 10)")
14
A householder’s weekly consumption of electricity in kilowatt-hours during a period of nine week in a winter were as follows: 338,354,341,353,351,341,353,346,341. Please completed stem and leaf diagram.

15
Examination results of 11 students: English:23,39,40,45,51,55,61,64,65,72,78 Chinese:37,41,44,48,58,61,63,69,75,83,89 One way to compare their performances in the two subjects is by means of side by side stem-and-leaf diagrams.

16
The comparison can be made more dramatic by back-to-back stem-and-leaf diagram.

18
Answer Stem (in 10)Leaves (in 1) 338 341116 351334
Leaves (in 1)")
19
2.3.6 Logarithmic graphs

Similar presentations


. Statistics graph Data recorded in surveys are displayed by a statistical graph. There are some specific.>")


2000 South-Western College Publishing.>")


 data we often use a.>")


