Download presentation
Presentation is loading. Please wait.

1
2005-2006 Student Satisfaction Survey Results September 25, 2006

3
General Information Second year of administration Participation increased by 1,113 All students in grades 3-12 –Grades 3-8 use Zoomerang/online –Grades 9-12 use bubble sheets Satisfaction (15 Questions) Enthusiasm (7-9 content areas)
 Enthusiasm (7-9 content areas)")
4
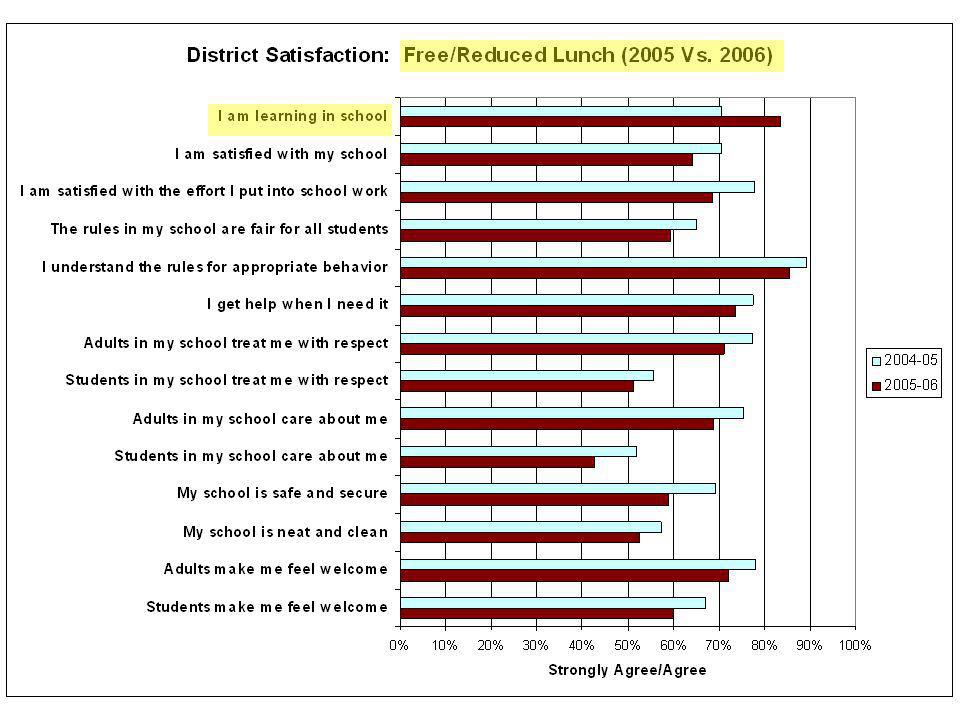
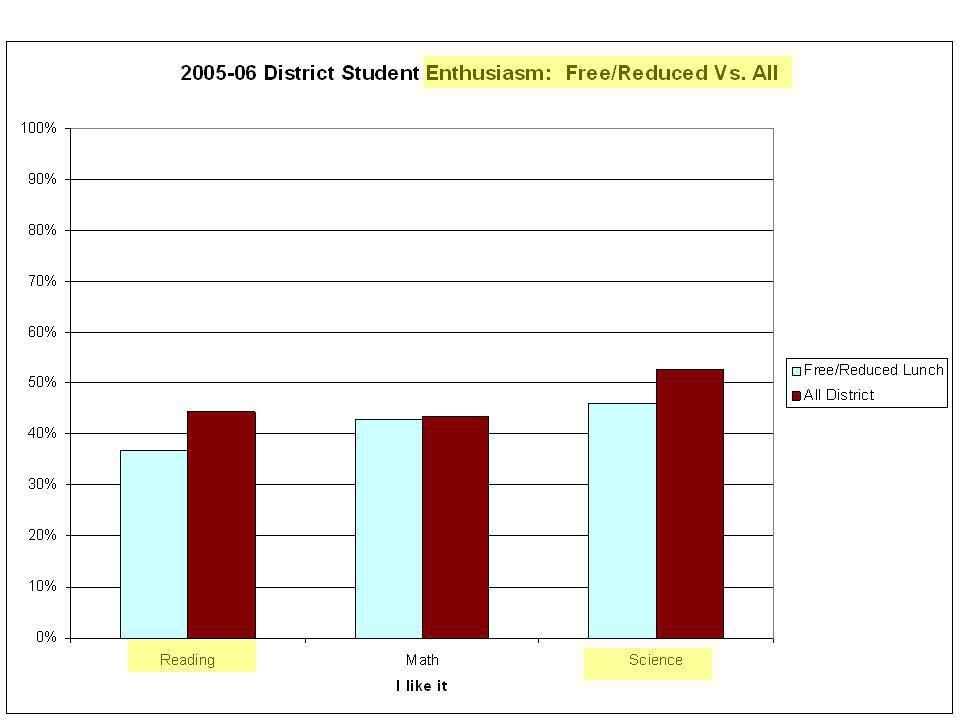
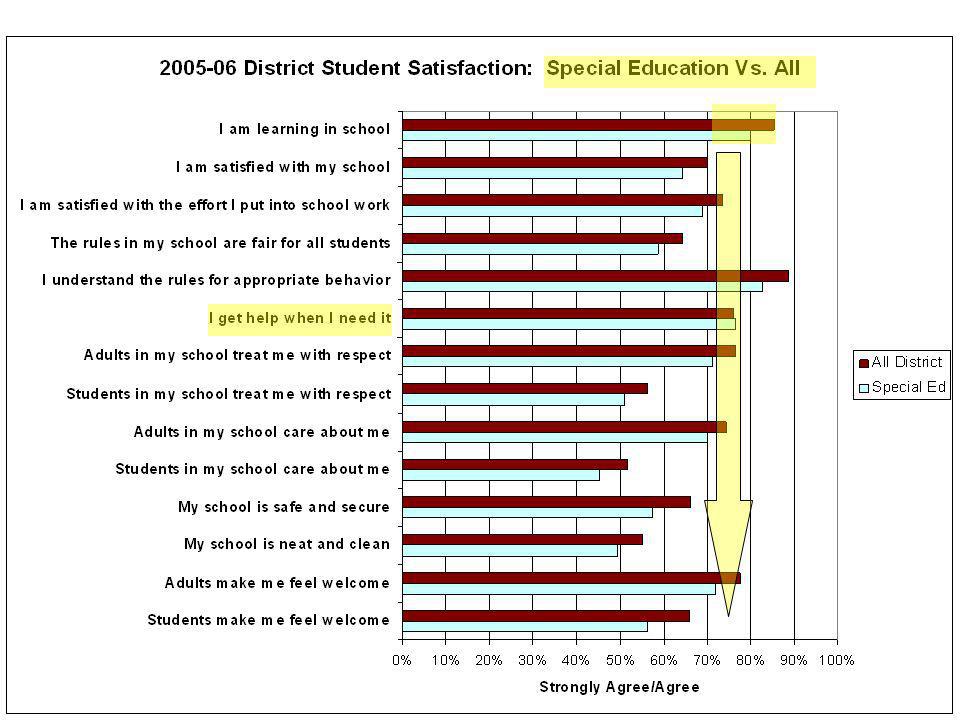
Reports District trends 05 Vs. 06 –Satisfaction & Enthusiasm Disaggregated by… –Free/Reduced Lunch –Ethnicity –Special Education

5
Analysis- Practices What are we looking for? –Trends? –Patterns? Terms we use –Descriptors (facts) –Association (relationship) –Causes & Effects (careful!) Intent –Ask… why? –Provide schools with useful data
 –Association (relationship) –Causes & Effects (careful!) Intent –Ask… why. –Provide schools with useful data.")
15
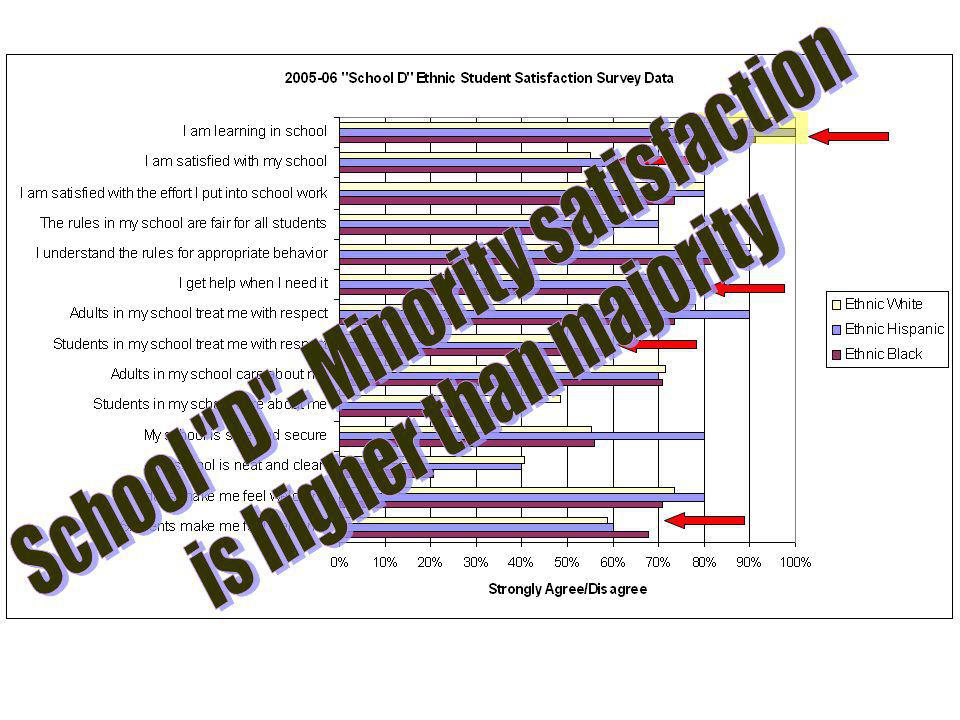
A look at a few schools… Examples differing from District Trend

22
Whats Next? Schools continue to analyze their student satisfaction data Action Research teams drive improvements at school level Development of surveys for other stakeholder groups: –Staff –Parents –Community

23
2005-2006 Student Satisfaction Survey Results September 25, 2006

Similar presentations


 - specifically in mathematics.>")