Download presentation
Presentation is loading. Please wait.

1
Household Projections and Forest Land Loss Presentation for the Governors Commission on Sustainable Forestry July 20, 2005 Maryland Department of Planning

8
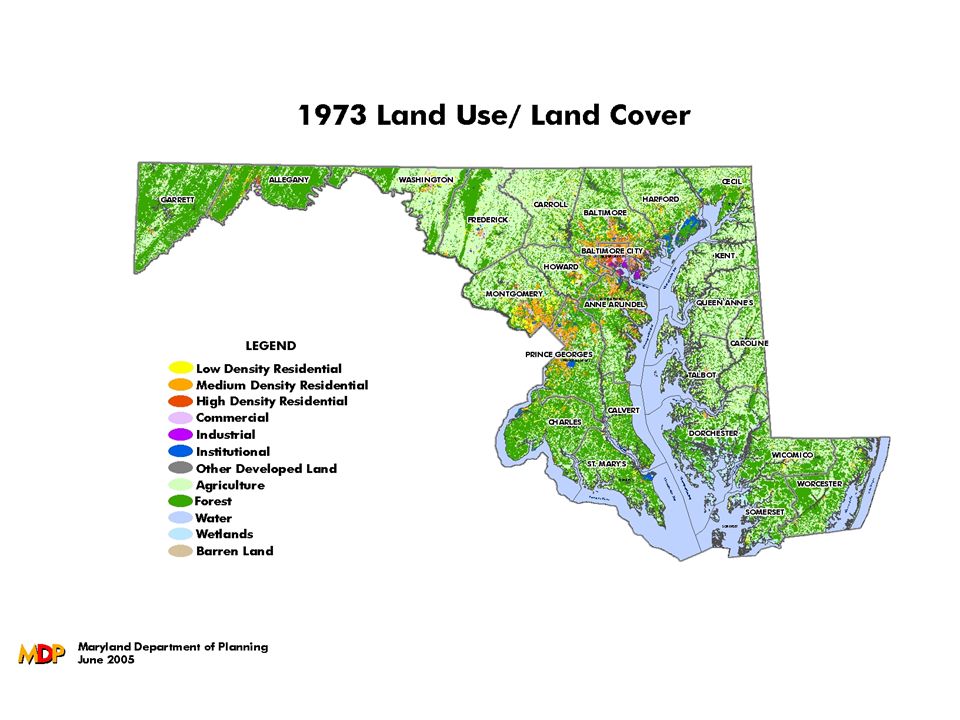
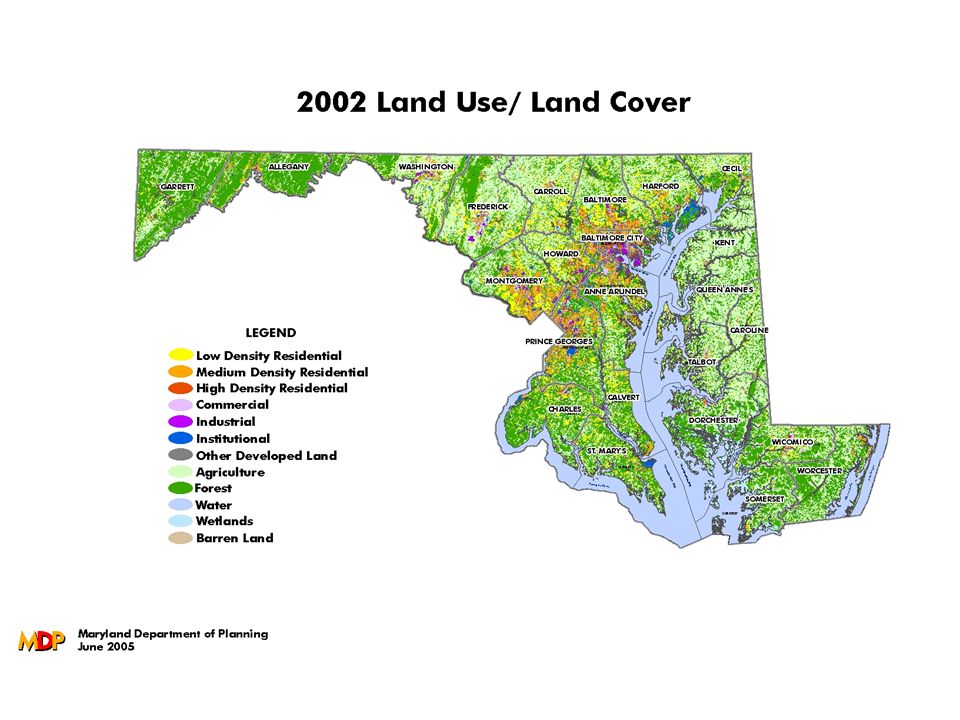
Forest Land Change 249,396 = Acres of forest land lost to development 1973-2002 8,599 = Forest acres lost per year 1973-2002 38% = Forest lands converted to development 1973-2002 310,406 = # of HH developed on forest land 1970-2000 27,791 = Average new HH per year 1970-2000.80 = Acres of forest consumed per HH Land Use numbers are from MDP land use / land cover data. HH Projections are prepared by MDP, Planning Data Services, May 2004

9
Approximately an average of 8,600 acres lost per year 2002

10
Household Projections

11
1,980,859 Households in 2000 2,555,755 Households in 2030 Additional 574,896 Households

14
Subdivision of Land in Agricultural Zoning Districts = Central MD = Southern MD = Lower ES = Upper ES = Western MD

Similar presentations


. 2 1970Litter Act 1994Encorp Pacific Inc. established 1998Beverage Container Stewardship Program Regulation 2004Recycling Regulation.>")


 Līga Meļko (CSB)>")


