Download presentation
Presentation is loading. Please wait.

1
Debra Harrington FDEP Groundwater Protection Watershed Monitoring Meeting August, 2004 INTEGRATING GROUND WATER INTO WATERSHED MANAGEMENT and BASIN ASSESSMENTS

2
WATERSHED MANAGEMENT and BASIN ASSESSMENTS IWRGRI BASIN ASSESSMENTS SRA IDENTIFY WATER QUALITY ISSUES Surface Water Ground Water Interaction

3
NEW SCREENING TOOLS GROUND WATER RESOURCE INDEX (GRI) Potable water Highest designated use of ground water. Uses ground water standards for contaminant groups such as BIOLOGICAL, NUTRIENTS, ORGANICS, INORGANICS AND SALTWATER INTRUSION. The GRI is based on the percent of wells that exceed a ground water standard and is calculated with and without aquifer stratification. DEP ground water data from recent and historic programs are considered in the assessment. The GRI is used to identify basin-wide ground water issues and subregional areas that may need further investigation.

4
GRI - GW Primary and Secondary Standards Evaluate quality of ground water resource Determine if gw suitable for potable water use SRA – SW Standards/Reference Thresholds Evaluate quality of gw contributions to sw Determine if gw to sw interaction supports aquatic life GRI and SRA Screening Threshold Further investigation if over 10% wells Did Not Meet Standards/Reference Thresholds Planning list for IWR and SRA used to identify areas for local ground water – surface water studies GW RESOURCE INDEX (GRI) GW – SW RELATIONAL ASSESSMENT (SRA)
 GW – SW RELATIONAL ASSESSMENT (SRA)")
5
GW STANDARDS – SURFACE WATER CRITERIA

6
GW – SW INTERACTION GAINING STREAM FLOW DIRECTION 1

7
Analytes Placed into Main Groups Biological Contaminants Nutrient Contaminants Organic Contaminants Inorganic Contaminants - Metals Inorganic – Saltwater Intrusion Indicators Miscellaneous - Ions, Radionuclides, etc. CONTAMINANT GROUPS

8
BIOLOGICALS NUTRIENTS CATEGORIES BASED ON GROUND WATER STANDARDS

9
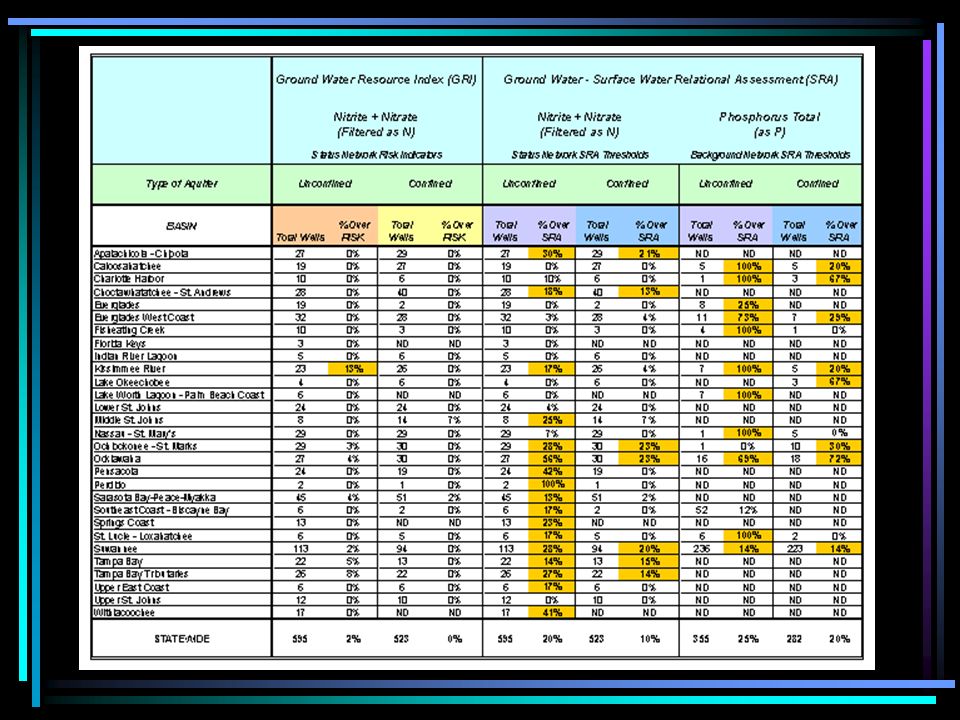
STATEWIDE GROUND WATER ASSESSMENTS

22
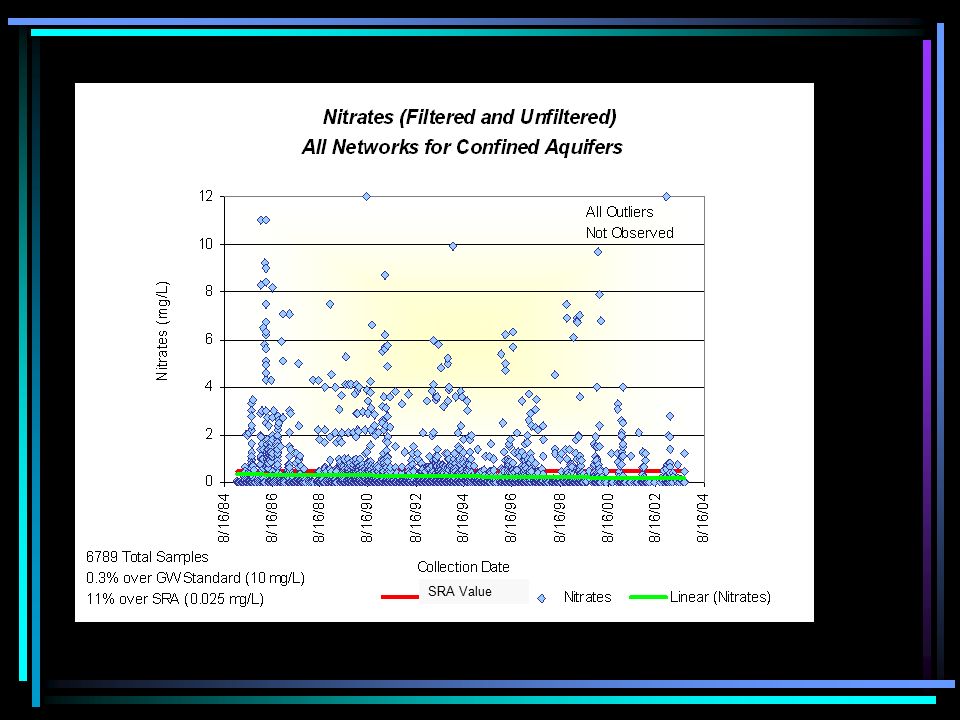
SRA Value

24
BASIN-WIDE GROUND WATER ASSESSMENTS

25
What analytes exceeded the GRI or SRA Threshold? Status Network and/or Background Network Group or Type of Analytes Related What is the Areal Extent? Map of Exceedances Surficial, Unconfined and Confined Floridan Are the Results Supported by Other Data? IWR Planning List, HRS Study, WSRP Wells, PWS Wells Other related analytes (fecal indicators, nitrates Are There Trends – Improving or Degrading? DO WE HAVE A CONCERN?

26
TOTAL COLIFORMS ANALYSES BY CONFINEMENT STRATA THRESHOLD ANALYSES

27
TOTAL COLIFORMS AQUIFER TYPE & CONFINEMENT THRESHOLD ANALYSES

28
MAP OF CONTAMINATION

29
SOURCES OF CONTAMINATION AND MICROLANDUSE

31
Unconfined Confined Surficial Unconfined Floridan Confined Floridan Range of Values (# colonies/100 mL) 0 500 1000 1500 2000 2500 MedianMCL 20 0 0 0 0 TOTAL COLIFORMS EXPLORATORY DATA ANALYSES RANGE OF VALUES
 MedianMCL TOTAL COLIFORMS EXPLORATORY DATA ANALYSES RANGE OF VALUES")
32
STATUS (2000) BACKGROUND (1985-1987) GRI COMPARATIVE RESULTS
 BACKGROUND ( ) GRI COMPARATIVE RESULTS")
33
IDENTIFYING BASINWIDE GROUND WATER ISSUES Biological Group Nutrient Group Organics Group Saltwater Intrusion Group LEGEND

34
Vast majority of gw in wells meets the designated use Basinwide concern - 23 % wells impacted by coliforms and found in all major aquifers (Surficial, Unconfined and Confined Floridan) Southern portion of basin is most vulnerable Most frequent microlanduse with coliform exceedance – wastewater from septic tanks, treatment plant or sprayfields Both private and monitoring wells impacted Well maintenance or well construction may be an issue – PWS wells better Organics, nutrients, saltwater intrusion not basinwide concerns CONCLUSIONS
 Southern portion of basin is most vulnerable Most frequent microlanduse with coliform exceedance – wastewater from septic tanks, treatment plant or sprayfields Both private and monitoring wells impacted Well maintenance or well construction may be an issue – PWS wells better Organics, nutrients, saltwater intrusion not basinwide concerns CONCLUSIONS")
35
Resample wells with MCL exceedances along with other nearby wells that may be at risk Provide information to private well owners regarding well maintenance and disinfection Identify subregional areas where Tier II or III ground water investigations are appropriate Provide assessment report and fact sheet to public for general education ST. MARKS BASIN RECOMMENDATIONS

36
GROUND WATER INTERACTION WITH SURFACE WATER GW/SW RELATIONAL ASSESSMENT (SRA)
")
37
SRA Used with SW Criteria or Reference Values Identify Areas Where GW Exceeds SW criteria or SRA Reference Values Identify areas for Tier II or III GW/SW Interaction Investigations and/or Field Studies Two Categories Based on Reference Values Met SRA Reference Values Did Not Meet SRA Reference Values GW/SW RELATIONAL ASSESSMENT (SRA)
")
38
Basis for SRA Reference Values Surface water criteria Values EPA Toxicity Reference Values Nutrient Criteria Values Environmental Effects Reference Values DEP Joint Advisory Committee Ground Water Protection Section Watershed Monitoring Section Watershed Assessment Section GW/SW RELATIONAL ASSESSMENT (SRA)
")
39
SRA Threshold Evaluation Percent Wells That Did Not Meet SRA Reference Values Integrated Assessment Data Geochemistry Potentiometric Maps Hydrology – Water Level Data GW Flow Contributions to SW (baseflow) Local Ground Water Data TMDL Waterbody Maps (priorities) Microlanduse SRA DEVELOPMENT
 Local Ground Water Data TMDL Waterbody Maps (priorities) Microlanduse SRA DEVELOPMENT")
40
SRA REFERENCE THRESHOLDS 0.025

41
COMMON TMDL IMPAIRMENTS TMDL Impairments By Percent

42
* Exceedances of GW Standards ** Number of WBIDS Run 7.2 FUTURE TMDLS - ELEVATED METALS IN GROUND AND SURFACE WATER

48
LEGEND Red = GW Wells over SRA For Iron EXAMPLE OF IRON TMDL PROGRAM SUPPORT

49
Baseflow is Important GW Designated Use GW Contribution to Flow by Percent Identify Subregional Areas For GW/SW Interaction Establish Local GW Flow Directions GW/SW Hydrologic Connection Assessment Support for Delisting TMDLs When Appropriate SRA PROVIDES TMDL SUPPORT

50
BASEFLOW FOR ST. MARKS RIVER

51
BASEFLOW FOR OCHLOCKONEE RIVER

52
FINAL BASEFLOW CALCULATIONS ST. MARKS RIVER 80% OCHLOCKONEE RIVER 54% SOPCHOPPY RIVER 48% WAKULLA RIVER ~99%

53
HYDROPORT RETRIEVAL APPLICATION

57
FOR MORE INFORMATION CONTACT GROUND WATER PROTECTION FLORIDA DEPARTMENT OF ENVIRONMENTAL PROTECTION TALLAHASSEE, FLORIDA

Similar presentations


 List Lahontan Water Board June 19, 2014 Carly Nilson.>")

 Regulations 2010 S.I. 9. of 2010 Colin Byrne Water Inspector.>")
 Shannon International River Basin District.>")