Download presentation
Presentation is loading. Please wait.

1
Fecal Colform Bacteria Contamination during Rain Events in Sayler’s Creek, Virginia Blake N. Robertson Senior Honors Research Under the Supervision of Dr. David Buckalew Natural Science Department Longwood University

2
Categories of River and Stream Impairment: Suspended Sediments Biochemical Oxygen Demand Nutrients Toxic Chemicals Heavy metals Fecal Coliform Bacteria

3
Magnitude of Impairment 13,218 miles of streams and rivers monitored in Virginia by Virginia’s Department of Environmental Quality 52% or 6,301 of those miles were determined to be impaired (DEQ 2004 303(d) and 305 (b))
 and 305 (b))")
4
Why Focus on Bacterial Pollutants? “Agricultural to be one of the primary sources Contributing to the bacteria standards violations (DEQ)”
 .")
5
TMDL plans The Clean Water Act requires states to establish water quality standards Water quality is determined by ability to support specific uses If water quality is not sufficient, then a Total Maximum Daily Load plan is created In Virginia, TMDL plans are optional However, some aid exists Drinking Water1 colony forming unit (CFU) per 100 ml Total body contact200 CFU/100ml Partial Body contact1000 CFU/100ml Treated sewage effluent <200 CFU/100ml Uses and their corresponding fecal coliform bacteria standard
 per 100 ml Total body contact200 CFU/100ml Partial Body contact1000 CFU/100ml Treated sewage effluent <200 CFU/100ml Uses and their corresponding fecal coliform bacteria standard")
6
Why Focus on Sayler’s Creek? Impaired headwater of the Appomattox River Drains into the heavily depended upon Chesapeake Bay Public Health –Local and Regional Eutrophication is accelerated leading to anoxia Lack of data

7
Past and Ongoing Studies Clean Virginia Waterways ARWQMP samples monthly at four locations in the Sayler’s Creek watershed Virginia’s DEQ monitors monthly where the two tributaries in the watershed meet Scarcity of research existing for the area Excellent place for such a study

8
Objectives Objective: To quantify fecal coliform bacterial contamination entering the stream during rain events Secondary Objective: To measure differences between testing methods for fecal coliform bacteria in water samples collected during rain events

9
Experimental Hypotheses Hypotheses: H 0 : An increase in streamflow will not cause fecal coliform contamination to increase H A : An increase in streamflow will cause fecal coliform contamination to increase Hypotheses: H 0 : There is no difference in coliform contamination between sampled sites H A : There is a difference in coliform contamination between sampled sites Hypotheses: H 0 : Measures of coliform bacteria do not differ between testing methods H A : Measures of coliform bacteria differ between testing methods

10
Field Data Collection Site Characterization Precipitation for event period Water velocity Water temperature Water depth Information not collected in every instance Sample Collection Water samples collected before (baseline), during, and after rain events Duplicate water samples taken randomly
, during, and after rain events Duplicate water samples taken randomly")
11
Determining Stream Profile Measuring Streamflow Establishing a Transect Surveying the Stream Profile

12
Stream Profile Example 0 1 2 -2 -3

13
Discharge Calculation Example: Stream Area = 5.558 ft 2 Water Velocity = 0.713 ft/sec Discharge = 3.964 ft 3 /sec Discharge or Q (ft 3 /sec) = velocity (ft/sec) X stream area (ft 2 )
 = velocity (ft/sec) X stream area (ft 2 )")
14
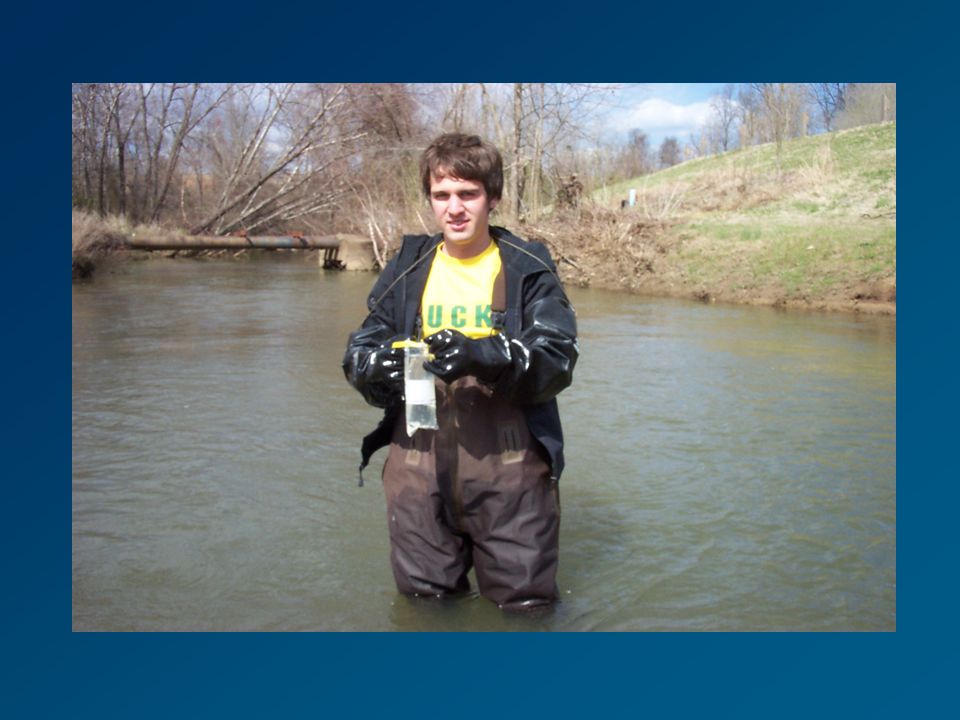
Sample Collection Samples were collected according to published guidelines of the Standard Methods for the Examination of Water and Wastewater, 20 th ed. Samples were collected in sterile 18oz. Whirl-Pak Bags Stored in a cooler with ice packs Transported to the lab for processing within 6 hours of sample collection

15
Sample Collection

16
Samples Transported for Processing

17
Membrane Filtration Samples diluted to 1% and passed through a 0.45 micron Millipore filter Incubated at 44.5 +/- 0.5°C for 24 +/- 2 hours. mFC Agar Apparatus

18
Defined Substrate Water sample is combined with two substrates (ONPG and MUG) Incubated at 44.5 +/- 0.5°C for 24 +/- 2 hours. Coliforms use ß-galactosidase to metabolize ONPG and change the cell to a yellow color E. Coli uses ß-glucuronidase to metabolize MUG and create fluorescence

19
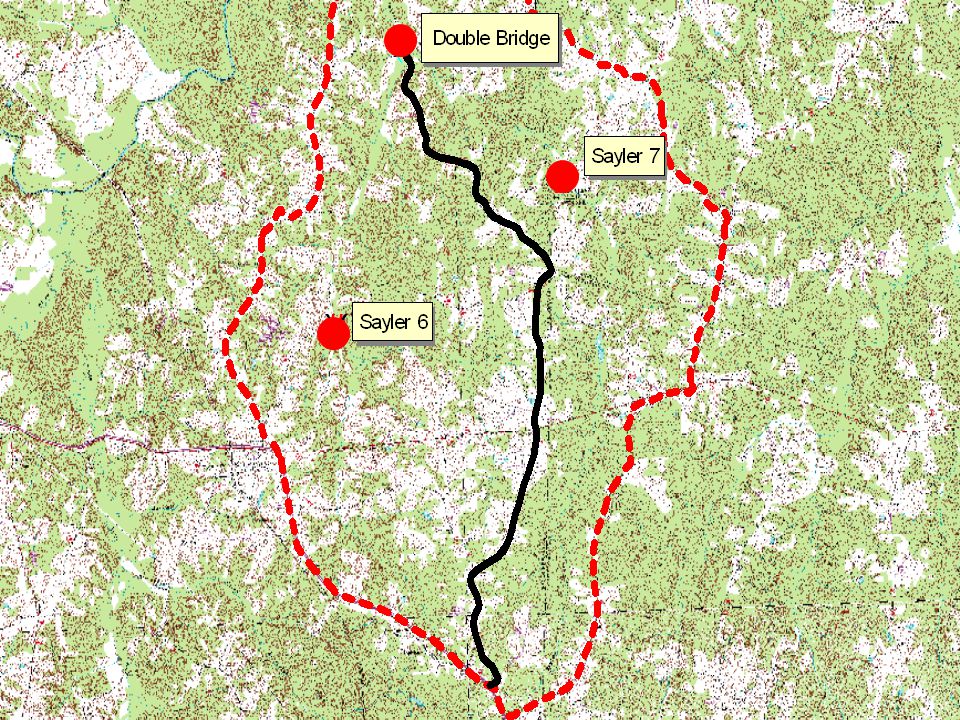
Site Identification Little Sayler’s Creek Sayler’s 6 - 37 17’ 22’’ N and 78 16’ 22 W More human land use upstream Big Sayler’s Creek Sayler’s 7 –37 18’ 29’’ N and 78 13’ 41’’ W More forested land upstream Both are 2 nd order streams (Headwaters) Drain a similar amount of land Similar bottom substrate and riparian buffer at each site
 Drain a similar amount of land Similar bottom substrate and riparian buffer at each site")
22
Statistical tests To determine if any statistical differences exist –Confidence Level = 95% Normality was tested for each data set –Bacterial assays –Assay method Tests used include: –A paired-sample t-test was used to compare methods of measuring fecal coliform bacteria –A nonparametric, related samples test to compare baseflow bacterial counts with those of peak flow –A Wilcoxon Rank Sum test was used to compare flow and bacterial counts between the two different sites

23
Results: Site Characteristics LocationTemperature Avg (Sd, n) Velocity Avg (ft/ sec) Discharge Avg (ft 3 /sec) Saylers 6 62.45 F° (2.27, 42) 1.2310.71 Sayler 7 63.39 F° (2.47, 42) 1.239.65 Precipitation data was not used for rain events 4 through 7
 Velocity Avg (ft/ sec) Discharge Avg (ft 3 /sec) Saylers F° (2.27, 42) Sayler F° (2.47, 42) Precipitation data was not used for rain events 4 through 7")
24
Results Saylers 6 had a greater mean bacterial count over the 7 rain events Mean Bacterial Counts for Sampled Rain Events n=7 n=10 n=5 n=4 n=7 n=5n=4

25
Streamflow and Bacterial Count Sampled rain event: September 4 th to 8 th At sampled times, contamination appears to increase and decrease with streamflow at both sites Similar trend appears for each rain event

26
Statistical Results VariableSig.Result Site ComparisonFecal ColiformP<0.002Reject H 0 VelocityP>0.88Fail to reject H 0 DischargeP>0.28Fail to reject H 0 Peak and Baseline Comparison Fecal ColiformP<0.005Reject H 0 Conclude that there was no difference between velocity and discharge at the two sites during sampled rain events. Conclude that the two sites differed in bacterial counts. Conclude that there was a significant difference between peak and baseline bacterial counts during sampled rain events. Summary of Statistics

27
Duration Since Last Rain Event At Sayler 6, on Little Sayler’s Creek, a rain events with similar amounts of rain yielded different concentrations of fecal coliform bacteria. Rain Event Number13 Peak Stream Flow (ft/sec)>3.0>3.9 Time since last rain event14 days4 days Peak Contamination (CFU’s per 100ml)28,5004,800 Total precipitation (in)2.352.5
>3.0>3.9 Time since last rain event14 days4 days Peak Contamination (CFU’s per 100ml)28,5004,800 Total precipitation (in)")
28
Method Comparison VariableSig.Result Method comparison Difference in fecal Coliform measurements P>0.9 7 Fail to reject H 0 Conclude that there was no difference between the methods for measuring fecal coliform bacteria during rain events at the two sampled sites. Summary of Statistics

29
Summary of Results There is a difference in bacterial counts between sites sampled. –Sayler 6 is more heavily contaminated When both sites were included, there was a difference between peak flow and baseflow fecal coliform contamination. A trend between streamflow and fecal coliform contamination exists. There was no difference in the methods used to test for fecal coliform bacteria.

30
Future Studies and Recommendations The DEQ had listed the cause of fecal coliform pollutants as agricultural, but the source is now listed as ‘unknown’. –Stresses the importance of bacterial source tracking Adopt a TMDL plan. Determine if the area upstream of Sayler 6 that drains into Little Sayler’s Creek is more developed than the area above Big Sayler’s Creek and how that is affecting bacteria counts. Investigate the effect of varying times between rain events. The Sayler’s Creek watershed is an excellent outdoor classroom.

31
Acknowledgements I would first like to acknowledge and thank Dr. David Buckalew for the supervision and guidance he provided. I learned a great deal this year and owe much of it to him. Thank you to Mrs. Alecia Daves of the Piedmont Soil and Water Conservation District for her surveying assistance. This research was funded by the Dean’s Fund for Undergraduate Research

Similar presentations

 of the Clean Water Act requires states to develop lists of impaired waters, those that do.>")


 Plan Implementation by Jeff Spoelstra, Coordinator, Kalamazoo River Watershed Council.>")


. Triclosan was more.>")


 Intake Stessor.>")


