Download presentation
Presentation is loading. Please wait.

1
Identifying Students with TBI: Clear as Mud West Virginia Brain Injury Association Conference 11/6/09 Judy L. Dettmer Director, TBI Program Colorado Department of Human Services 303-866-4085judy.dettmer@state.co.us

2
National Picture

3
Incidence of Brain Injury: National Data Brain injury is the leading cause of death and disability of children in the U.S. (Pediatric Registry) Brain injury is the leading cause of death and disability of children in the U.S. (Pediatric Registry) CDC reports annual incidence of TBI for CDC reports annual incidence of TBI for Children 0-14: - 2,685 deaths - 37,000 hospitalizations - 435,000 ED visits These numbers do not include children who sustained a TBI and did not seek medical care or were treated and released without mention of potential TBI
 Brain injury is the leading cause of death and disability of children in the U.S. (Pediatric Registry) CDC reports annual incidence of TBI for CDC reports annual incidence of TBI for Children 0-14: - 2,685 deaths - 37,000 hospitalizations - 435,000 ED visits These numbers do not include children who sustained a TBI and did not seek medical care or were treated and released without mention of potential TBI.")
4
Incidence of Brain Injury: National Data Each year an average of 475,000 TBIs occurred among children. Each year an average of 475,000 TBIs occurred among children. Most children who sustained a TBI (91.5%) were treated and released from the emergency department without further treatment. Most children who sustained a TBI (91.5%) were treated and released from the emergency department without further treatment. CDC 2005
 were treated and released from the emergency department without further treatment. Most children who sustained a TBI (91.5%) were treated and released from the emergency department without further treatment. CDC")
5
CDC, 2005 TBI in the United States TBIs by Age Group* * Average annual rates, 1995-2001

6
U.S. Department of Education Data (Students ages 6-21) During the 1991-92 school year there were a total of 4,499,824 students receiving special education services of that total only 245 were served under the TBI disability category During the 1991-92 school year there were a total of 4,499,824 students receiving special education services of that total only 245 were served under the TBI disability category During the 1999-2000 school year there were a total of 5,683,707 students receiving special education services of that total there were 13,874 served under the TBI disability category During the 1999-2000 school year there were a total of 5,683,707 students receiving special education services of that total there were 13,874 served under the TBI disability category U.S. Department of Education, Office of Special Education Services: Annual Report to Congress, 2000
 During the school year there were a total of 4,499,824 students receiving special education services of that total only 245 were served under the TBI disability category During the school year there were a total of 4,499,824 students receiving special education services of that total only 245 were served under the TBI disability category During the school year there were a total of 5,683,707 students receiving special education services of that total there were 13,874 served under the TBI disability category During the school year there were a total of 5,683,707 students receiving special education services of that total there were 13,874 served under the TBI disability category U.S. Department of Education, Office of Special Education Services: Annual Report to Congress,")
7
U.S. Department of Education Data (Students ages 6-21) 2005 data shows there were a total of 6,021,462 students receiving special education services of that total there were 23,449 served under the TBI disability category. 2007 there were 23,864 with TBI 2005 data shows there were a total of 6,021,462 students receiving special education services of that total there were 23,449 served under the TBI disability category. 2007 there were 23,864 with TBI Interesting fact, Autism became a disability category in 1991 also; in 1992, 15,302 students were identified, in 2000, 79,085 were identified and in 2005 192,643 students were identified under the autism disability category. 2007 there were 258,305 with Autism. Interesting fact, Autism became a disability category in 1991 also; in 1992, 15,302 students were identified, in 2000, 79,085 were identified and in 2005 192,643 students were identified under the autism disability category. 2007 there were 258,305 with Autism.
 2005 data shows there were a total of 6,021,462 students receiving special education services of that total there were 23,449 served under the TBI disability category there were 23,864 with TBI 2005 data shows there were a total of 6,021,462 students receiving special education services of that total there were 23,449 served under the TBI disability category there were 23,864 with TBI Interesting fact, Autism became a disability category in 1991 also; in 1992, 15,302 students were identified, in 2000, 79,085 were identified and in ,643 students were identified under the autism disability category there were 258,305 with Autism. Interesting fact, Autism became a disability category in 1991 also; in 1992, 15,302 students were identified, in 2000, 79,085 were identified and in ,643 students were identified under the autism disability category there were 258,305 with Autism..")
8
Lets Recap: You do the Math… Each year an average of 475,000 TBIs occurred among children (0-14) Each year an average of 475,000 TBIs occurred among children (0-14) The National Pediatric Registry reports that it is estimated that 19% of youth who sustained a brain injury will have long term disabilities The National Pediatric Registry reports that it is estimated that 19% of youth who sustained a brain injury will have long term disabilities Reviewing data from USDOE in 2006 there were 23,777 students with TBI receiving special education services. In 2007 there were 23,864 served under the TBI disability category (0-21). Totaling an increase of 87 students. Reviewing data from USDOE in 2006 there were 23,777 students with TBI receiving special education services. In 2007 there were 23,864 served under the TBI disability category (0-21). Totaling an increase of 87 students.
. Totaling an increase of 87 students. Reviewing data from USDOE in 2006 there were 23,777 students with TBI receiving special education services. In 2007 there were 23,864 served under the TBI disability category (0-21). Totaling an increase of 87 students..")
9
Lets Recap: You do the Math… Conservatively, using the 19% guideline, we could estimate roughly 90,250 with long term disabilities resulting from brain injury annually. Conservatively, using the 19% guideline, we could estimate roughly 90,250 with long term disabilities resulting from brain injury annually. Get your calculators out…………… Get your calculators out…………… 19% of 475,000 = 90,250, USDOE increased by 87 in one year………… 19% of 475,000 = 90,250, USDOE increased by 87 in one year………… Are we missing 90,163 students annually with brain injury? Are we missing 90,163 students annually with brain injury?

10
West Virginia

11
Where Does WV Stand? CDC indicates that between 1 and 2% of population has TBI CDC indicates that between 1 and 2% of population has TBI 2008 Census data indicates the population of WV is 1,814,468 with 21.3% under 18 2008 Census data indicates the population of WV is 1,814,468 with 21.3% under 18 USDOE 2007 data reports 128 students with TBI on IEP in WV USDOE 2007 data reports 128 students with TBI on IEP in WV

12
Where Does WV Stand? Calculators please……… Conservatively, 1% of population with TBI = 3,865 Conservatively, 1% of population with TBI = 3,865 19% of 3,865 = 734 19% of 3,865 = 734 Is WV missing 606 students annually? Is WV missing 606 students annually?

13
GET THE PICTURE?

14
Why Are We Missing These Kids? Transition support from medical setting is rare or poorly coordinated Transition support from medical setting is rare or poorly coordinated From hospital fewer than 2% are recommended for special education (though 19% have cognitive limitations) (National Pediatric Registry) From hospital fewer than 2% are recommended for special education (though 19% have cognitive limitations) (National Pediatric Registry) Treat and Release from the EDs Treat and Release from the EDs
 (National Pediatric Registry) From hospital fewer than 2% are recommended for special education (though 19% have cognitive limitations) (National Pediatric Registry) Treat and Release from the EDs Treat and Release from the EDs.")
15
Why Are We Missing These Kids? Brain injury often goes undiagnosed Brain injury often goes undiagnosed The effects of brain injury can be very subtle The effects of brain injury can be very subtle Families and school personnel have limited knowledge about brain injury Families and school personnel have limited knowledge about brain injury

16
How IDEA Plays into the Problem USDOE has given discretion to the states to interpret their definition of TBI USDOE has given discretion to the states to interpret their definition of TBI USDOE does not indicate what documentation is required for determining a student eligible for special education under the TBI category USDOE does not indicate what documentation is required for determining a student eligible for special education under the TBI category Medical documentation of mild to moderate TBI may not be available Medical documentation of mild to moderate TBI may not be available

17
What Colorado is Doing

18
Colorado Department of Education August 2008 Medical Documentation of TBI Medical Documentation of TBIor Credible History of TBI and Educational Impact

20
Colorados Challenge To put into place an effective and efficient identification protocol Medical documentation: Sometimes difficult to get Sometimes difficult to get Does not guarantee educational impact Does not guarantee educational impact Does not direct intervention Does not direct intervention

21
CDE recommends Gold Standard It is still best practice is to establish traumatic brain injury through medical documentation via hospital records and/or from a doctor or clinician who has knowledge of the Center for Disease Control (CDC) requirements for TBI. Severe and moderate TBI– usually (not always) lend themselves to medical documentation.
 lend themselves to medical documentation..")
22
Mild TBI (mTBI) aka Concussion 1.6 to 3.8 mTBI per year in the United States. 1.6 to 3.8 mTBI per year in the United States. How many mTBI are not seen by a medical professional? How many mTBI are not seen by a medical professional? Estimated 42% are not seen by medical professional. Estimated 42% are not seen by medical professional. Very difficult to establish medical documentation on mTBI cases

23
Identification Protocol 1. Medical Documentation 2. Reported Incident 3. Credible History 4. TBI Screen 5. Establish Educational Impact

25
Credible History The gold standard for determining prior TBI is self/parent-report as determined by a structured or in-depth interview (Corrigan & Bogner, 2007) Comprehensive Health History Interview Comprehensive Health History Interview (Health history must be an interview; it cannot be a form mailed to the parent/caregiver) (Health history must be an interview; it cannot be a form mailed to the parent/caregiver) Credible history of TBI requires a skilled interviewer to know how to ask certain questions, to ask pointed questions multiple times and in a variety of ways, to establish the details of the TBI(s).
 Comprehensive Health History Interview Comprehensive Health History Interview (Health history must be an interview; it cannot be a form mailed to the parent/caregiver) (Health history must be an interview; it cannot be a form mailed to the parent/caregiver) Credible history of TBI requires a skilled interviewer to know how to ask certain questions, to ask pointed questions multiple times and in a variety of ways, to establish the details of the TBI(s).")
26
Questions should include: Where Where When When How How Medical intervention(s) sought at the time, later, through the recovery Medical intervention(s) sought at the time, later, through the recovery Are answers medically plausible? Are answers medically plausible? Be aware of assumptions – for example, the report of a scalp laceration or head injury does not automatically define a brain injury Be aware of assumptions – for example, the report of a scalp laceration or head injury does not automatically define a brain injury

27
Credible History continued… 2. There needs to be a reported incident(s) as well as on- going symptoms/behaviors that persist beyond the incident (Corrigan & Bogner, 2007). During the health interview, details of the incident should be clear and consistent. The description of the injury should not vary widely from report to report, from reporter to reporter (if there are multiple reporters of the same incident). During the health interview, details of the incident should be clear and consistent. The description of the injury should not vary widely from report to report, from reporter to reporter (if there are multiple reporters of the same incident). If there are multiple injuries, specifics about each injury should be well-detailed and consistent. If there are multiple injuries, specifics about each injury should be well-detailed and consistent.
 as well as on- going symptoms/behaviors that persist beyond the incident (Corrigan & Bogner, 2007). During the health interview, details of the incident should be clear and consistent. The description of the injury should not vary widely from report to report, from reporter to reporter (if there are multiple reporters of the same incident). During the health interview, details of the incident should be clear and consistent. The description of the injury should not vary widely from report to report, from reporter to reporter (if there are multiple reporters of the same incident). If there are multiple injuries, specifics about each injury should be well-detailed and consistent. If there are multiple injuries, specifics about each injury should be well-detailed and consistent..")
28
Interviewer must know acute and latent symptoms of TBI Acute symptoms: Latent symptoms that emerge or develop later, symptoms that morph. Assess pre versus post-injury learning, behaviors, social skills, personality. Physical Physical Headache Dizziness Blurred vision Nausea/vomit Poor balance Sensitivity to light/sound Seeing stars Vacant/glassy look Cognitive Cognitive Feeling in a fog Feeling slowed down Slowed speech Easily confused Difficulty remembering/concentrating Distracted Emotional Emotional Personality change Emotionally labile Irritable Sad Anxious Apathetic Maintenance Maintenance Fatigue Drowsiness Excess sleep Sleeping less than usual Unable to initiate or maintain sleep

29
Credible History continued… 3. Finally, a screen or in-depth interview is not enough to diagnose TBI. These tools are simply to screen for potential TBI. If a screen or in-depth interview suggest there has been a credible history of TBI, a thorough assessment/evaluation is suggested (Corrigan & Bogner, 2007). Confirm credible history with: Confirm credible history with: CSU Brain Checklist Screen CSU Brain Checklist Screen
. Confirm credible history with: Confirm credible history with: CSU Brain Checklist Screen CSU Brain Checklist Screen.")
30
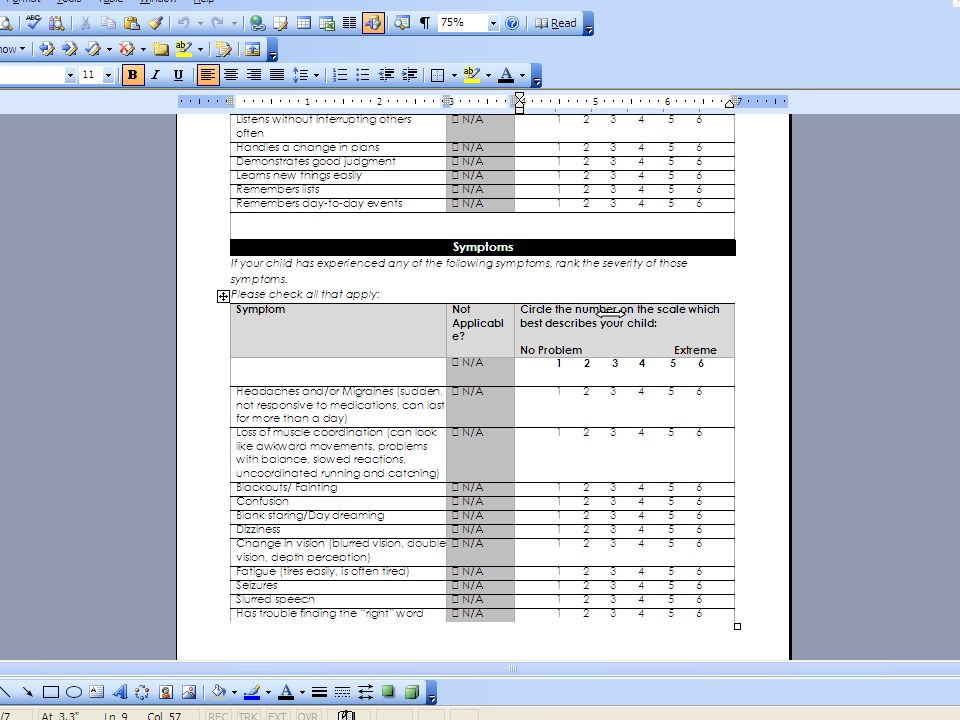
CSU Brain Checklist Screen 3 Primary Sections 1. Injury or Illness 2. Behaviors that Affect Learning 3. Symptoms

34
Educational Impact Medical documentation/credible history simply confirms the presence of the TBI. It does not or cannot automatically establish the impact of the TBI. Confirming that an injury has occurred does not shed light upon the affect of the injury on subsequent physical, educational, behavioral, emotional, social outcome. Once medical documentation has been established, CDE requires that school teams continue to proceed through the protocol to establish educational impact.

35
Establishing Educational Impact Functional Assessment/Observation Functional Assessment/Observation Focused Assessment Focused Assessment

36
Functional Observation Teacher, parent and student interview Teacher, parent and student interview Functional school setting observation Functional school setting observation Functional Community-Referenced Assessment 1. Interview 2. Observation 3. Summary

37
Formal Focused Assessment Cognitive Cognitive Neuropsychological Neuropsychological Achievement Achievement Speech Language Speech Language Occupational Therapy/Physical Therapy Occupational Therapy/Physical Therapy Adaptive Adaptive Emotional/Behavioral/Executive Functions Emotional/Behavioral/Executive Functions

38
Why it Matters Under-Identification Cycle 1. Students are under-identified so TBI appears as a low incidence disability 2. Numbers drives money, there is a lack of funding for TBI 2. This feeds into a lack of awareness and lack of training for school personnel 3. Which develops a cycle of failure for these students

39
The Importance Of Accurate Identification Student receives appropriate interventions Student receives appropriate interventions Prevent a cycle of failure Prevent a cycle of failure Allows the student to begin developing self advocacy skills Allows the student to begin developing self advocacy skills Accurate identification ensures more appropriate funding and subsequent service provision Accurate identification ensures more appropriate funding and subsequent service provision

Similar presentations


 on Applied Behavior Analysis (ABA) principles within the EIBI autism classroom,>")


