Download presentation
Presentation is loading. Please wait.

1
for epidemiological studies
Sampling Techniques for epidemiological studies Biagio Pedalino

2
Objectives To decide whether to conduct sampling
To choose among a list of sampling techniques To define sampling To describe sampling techniques

3
Approach We are normally interested in:
- Distribution of a variable of interest in a specific population

4
Definition of population
A population is defined by: Its nature (an individual, housing, a firm etc.) Its intrinsic characteristics (gender, housing type, industries) Its localisation (city, neighbourhood etc.) who, where and when
 Its intrinsic characteristics (gender, housing type, industries) Its localisation (city, neighbourhood etc.) who, where and when.")
5
Examples of populations
The inhabitants of London in 2010 French nationality women living in Paris in 2010 Children in elementary schools in France in 2010 HIV seropositive patients in hospital centers in France in 2006 Individuals recently entered in the French prisons in 2010

6
Variable of interest We are interested in a (non random) variable y in a population U (of k units) It must be defined carefully and accurately (i.e. vaccination status) Example We are interested in HIV (variable y) prevalence in a population. The variable of interest is defined, for each unit k in the population by: y= 1 (HIV seropositive); 0 (otherwise, i.e. negative, not known, etc)
 Example. We are interested in HIV (variable y) prevalence in a population. The variable of interest is defined, for each unit k in the population by: y= 1 (HIV seropositive); 0 (otherwise, i.e. negative, not known, etc)")
7
Example of research question
What is the proportion of individuals vaccinated against Hepatitis B in Lazareto, in October 2012 ? Variable of interest? Population? Time? How to obtain the information about the variable ? Census Build a sample

8
Example of research question
What is the proportion of individuals vaccinated against Hepatitis B in Lazareto, in October 2012 ? Variable of interest? Population? Time? How to obtain the information about the variable ? Census Build a sample

9
Example of research question
What is the proportion of children vaccinated against Hepatitis B in Minorca, in 2012 ? Variable of interest? Population? Time? How to obtain the information about the variable ? Census Build a sample

10
Example of research question
What is the proportion of children vaccinated against Hepatitis B in Minorca, in 2012 ? Variable of interest? Population? Time? How to obtain the information about the variable ? Census Build a sample

11
Definition of sampling
Sampling is the process of selecting units from a specific population to collect information on a variable of interest

12
Sample Sampling frame Target population

13
Why bother in the first place?
Get information from large populations with: Reduced costs Reduced field time Increased accuracy

14
Definition of sampling terms
Sampling frame List of all the sampling units from which sample is drawn Lists: e.g. all children < 5 years of age, households, health care units… Sampling scheme Method of selecting sampling units from sampling frame Randomly, convenience sample…

15
Definition of sampling terms
Sampling unit (element) Subject under observation from whom information is collected Example: children <5 years, hospital discharges, health events… Sampling fraction Ratio between sample size and population size Example: 100 out of 2000 (5%)
 Subject under observation from whom information is collected. Example: children <5 years, hospital discharges, health events… Sampling fraction. Ratio between sample size and population size. Example: 100 out of 2000 (5%)")
16
Sampling errors Systematic error (or bias)
Representativeness (validity) Information bias Sampling error (random error) Precision
 Information bias. Sampling error (random error) Precision.")
17
Validity Sample should accurately reflect the distribution of relevant variable in population Person (age, sex) Place (urban vs. rural) Time (seasonality) Representativeness essential to generalise
 Time (seasonality) Representativeness essential to generalise.")
18
Representativeness Often used as synonym of validity of a sample
General rule: to build a sample representative of the whole population of interest Erroneous

19
Which is the correct sample?
Populations Women Men Women Men Women Men 50% 50% 50% 50% 50% 50% All of them are correct !!! Samples Women Men Women Men Women Men 50% 50% 30% 70% 70% 30%

20
Example: question Aim of the study is to
estimate the national prevalence of elevated Blood Lead Level (BLL 100μg/L) determine the risk factors associated to elevated BLL Among children aged 1 to 6 years in Minorca in We want to recruit 3000 children through hospitals Is the best design to select each unit with the same inclusion probability?
 determine the risk factors associated to elevated BLL. Among children aged 1 to 6 years in Minorca in We want to recruit 3000 children through hospitals. Is the best design to select each unit with the same inclusion probability")
21
Example: answer No! ... because if the expected prevalence of elevated BLL is 1% With a sample size = 3000, we expect to have 30 children with an elevated BLL in the sample Small number to achieve the second objective of the study, i.e. identification of risk factors It is one of the reasons why we do not perform surveys with equally-represented individuals in epidemiology

22
Example: solution We want to over-represent children with an elevated BLL in the sample If we know that some hospitals stand in areas where the risk of lead exposure in the dwellings is high, then we will over-represent hospitals in these high risk areas

23
Representativeness: take home messages
A sample is correct if randomly built It is not necessary that the distributions in the sample and in the population are the same

24
Information bias Systematic problem in collecting information
Inaccurate measuring Scales (weight), ultrasound, lab tests (dubious results) Badly asked questions Ambiguous, not offering right options…
, ultrasound, lab tests (dubious results) Badly asked questions. Ambiguous, not offering right options…")
25
Sampling error (random error)
No sample is an exact mirror image of the population Standard error depends on size of the sample distribution of character of interest in population Size of error can be measured in probability samples standard error

26
Quality of a sampling estimate
No precision Random error Precision but no validity Systematic error (bias) Precision & validity 7
 Precision & validity. 7.")
27
Survey errors: example
Measuring height: Measuring tape held differently by different investigators → loss of precision → large standard error Tape too short → systematic error → bias (cannot be corrected retrospectively)
")
28
Types of sampling Non-probability samples Probability samples
Convenience samples Biased Subjective samples Based on knowledge In the presence of time/resource constraints Probability samples Random only method that allows valid conclusions about population and measurements of sampling error 28

29
Non-probability samples
Convenience samples (ease of access) Snowball sampling (friend of friend….etc.) Purposive sampling (judgemental) You chose who you think should be in the study Probability of being chosen is unknown Cheaper- but unable to generalise, potential for bias
 Snowball sampling (friend of friend….etc.) Purposive sampling (judgemental) You chose who you think should be in the study. Probability of being chosen is unknown. Cheaper- but unable to generalise, potential for bias.")
30
Example of a non-probability sample
Take a sample of the population of Minorca to ask about possible exposures following a gastroenteritis outbreak Sampling frame: people walking around the Es Castel harbour at noon on a Monday

31
Probability samples Random sampling
Each unit has a known probability of being selected Allows application of statistical sampling theory to results in order to: Generalise Test hypotheses

32
Methods used in probability samples
Simple random sampling Systematic sampling Stratified sampling Multi-stage sampling Cluster sampling

33
Simple random sampling
Principle Equal chance/probability of each unit being drawn Procedure Take sampling population Need listing of all sampling units (“sampling frame”) Number all units Randomly draw units
 Number all units. Randomly draw units.")
35
Simple random sampling
5 20 27 29 32 40

36
Simple random sampling
Advantages Simple Sampling error easily measured Disadvantages Need complete list of units Units may be scattered and poorly accessible Heterogeneous population important minorities might not be taken into account

37
Systematic sampling Principle Procedure
Select sampling units at regular intervals (e.g. every 20th unit) Procedure Arrange the units in some kind of sequence Divide total sampling population by the designated sample size (eg 1200/60=20) Choose a random starting point (for 20, the starting point will be a random number between 1 and 20) Select units at regular intervals (in this case, every 20th unit), i.e. 4th, 24th, 44th etc. 37
 Procedure. Arrange the units in some kind of sequence. Divide total sampling population by the designated sample size (eg 1200/60=20) Choose a random starting point (for 20, the starting point will be a random number between 1 and 20) Select units at regular intervals (in this case, every 20th unit), i.e. 4th, 24th, 44th etc. 37.")
38
Systematic sampling Advantages Disadvantages
Ensures representativity across list Easy to implement Disadvantages Need complete list of units Periodicity-underlying pattern may be a problem (characteristics occurring at regular intervals) 38
 38.")
39
More complex sampling methods

40
Stratified sampling When to use Procedure
Population with distinct subgroups Procedure Divide (stratify) sampling frame into homogeneous subgroups (strata) e.g. age-group, urban/rural areas, regions, occupations Draw random sample within each stratum 40
 sampling frame into homogeneous subgroups (strata) e.g. age-group, urban/rural areas, regions, occupations. Draw random sample within each stratum. 40.")
41
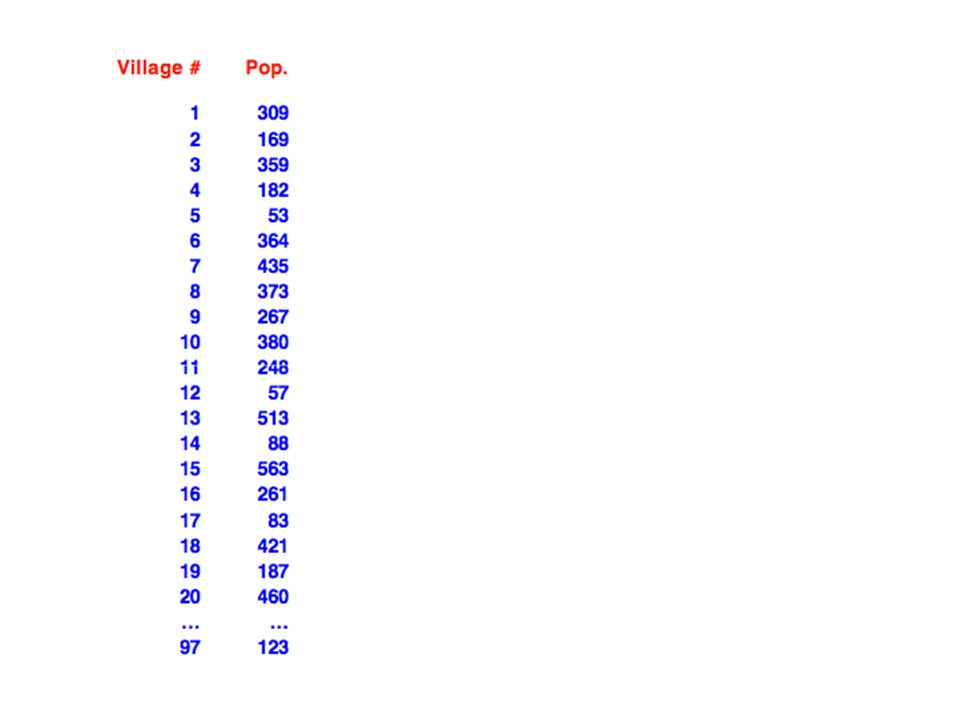
Selecting a sample with probability proportional to size
Stratified sampling Selecting a sample with probability proportional to size Area Population Proportion Sample size Sampling size fraction Urban % 1000 x 0.7 = 700 10 % Rural % 1000 x 0.3 = 300 10 % 1000 Total 41

42
Stratified sampling Advantages Disadvantages
Can acquire information about whole population and individual strata Precision increased if variability within strata is smaller (homogenous) than between strata Disadvantages Sampling error is difficult to measure Different strata can be difficult to identify Loss of precision if small numbers in individual strata (resolved by sampling proportional to stratum population) 42
 than between strata. Disadvantages. Sampling error is difficult to measure. Different strata can be difficult to identify. Loss of precision if small numbers in individual strata (resolved by sampling proportional to stratum population) 42.")
44
Multiple stage sampling
Principle: Consecutive sampling Example : sampling unit = household 1st stage: draw neighbourhoods 2nd stage: draw buildings 3rd stage: draw households 8

45
Cluster sampling Principle
Whole population divided into groups e.g. neighbourhoods A type of multi-stage sampling where all units at the lower level are included in the sample Random sample taken of these groups (“clusters”) Within selected clusters, all units e.g. households included (or random sample of these units) Provides logistical advantage
 Within selected clusters, all units e.g. households included (or random sample of these units) Provides logistical advantage.")
48
Number of cluster needed=25

49
Number of cluster needed=25

54
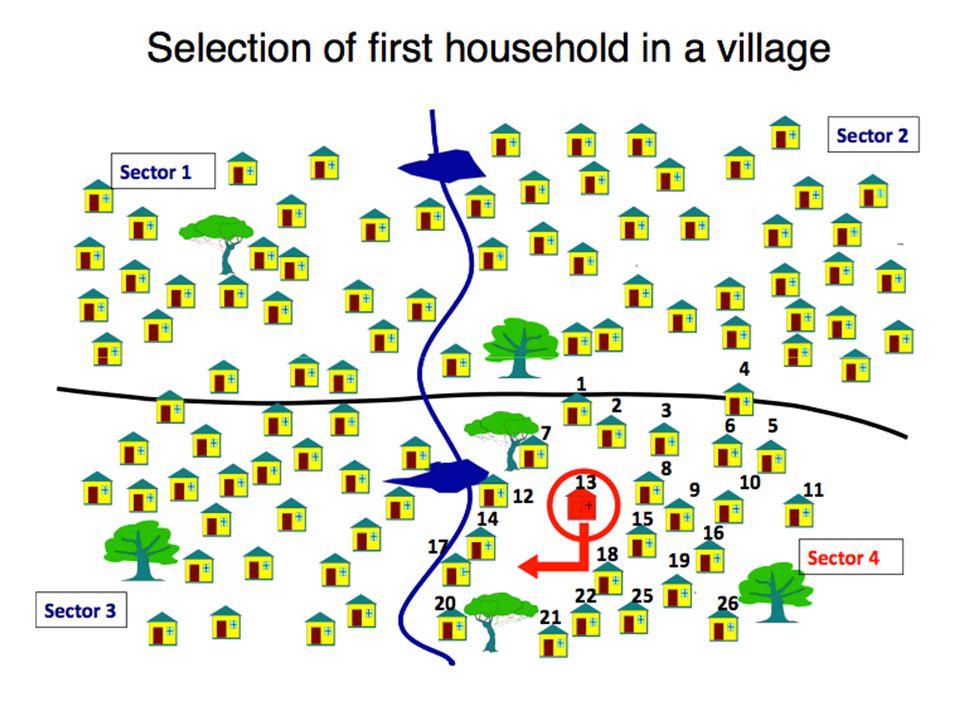
All third-stage units might be included in the sample
Stage 3: Selection of the sampling unit All third-stage units might be included in the sample 54

55
Stage 3: Selection of the sampling unit
Second-stage units => Households Third-stage unit => Individuals 55

56
Cluster sampling Advantages
Simple as complete list of sampling units within population not required Less travel/resources required Disadvantages Cluster members may be more alike than those in another cluster (homogeneous) This needs to be taken into account in the sample size and in the analysis (“design effect”)
 This needs to be taken into account in the sample size and in the analysis ( design effect )")
57
Selecting a sampling method
Population to be studied Size/geographical distribution Heterogeneity with respect to variable Availability of list of sampling units Level of precision required Resources available

58
Conclusions Probability samples are the best Ensure
Validity Precision …..within available constraints

59
Conclusions If in doubt… Call a statistician !!!!

60
Questions?

Similar presentations


 Chapter 7, Part B Sampling and Sampling Distributions Other Sampling Methods Other.>")


