Download presentation
Presentation is loading. Please wait.

1
Prediction of Crime/Terrorist Event Locations National Defense and Homeland Security: Anomaly Detection Francisco Vera, SAMSI

2
Outline Introduction Location space and feature space The model Feature selection Examples Evaluation/comparison of models Discussion

3
Introduction Based on two papers –Criminal incident prediction using a point- pattern-based density model By Hua Liu and Donald Brown –Spatial forecast methods for terrorist events in urban environments By Donald Brown, Jason Dalton, and Heidi Hoyle Same modeling approach in both papers

4
Introduction Hot spots: Criminal events tend to cluster in space. Traditional methods look for clusters in space –Only coordinates, dates and times are used –Unable to predict new hot spots Terrorist events are rare, do not cluster in space

5
Introduction Proposed method look for offenders preferences in crime site selection –Instead of looking at the coordinates, look at the features of crime locations Demographic, social, economic Distance to key features –Closest police station –Closest highway –Closest convenience store

6
Location Space North East Cops I-40 I-85

7
Feature Space Highway Cops

8
Advantages Better performance Ability to predict new hot spots Terrorist events do not cluster in location space, but they do in feature space

9
The Model Times: Locations: Features: Transition density:

10
The Model Spatial transition density Temporal transition density Assumption: Temporal transition does not depend on spatial transition

11
The Model

13
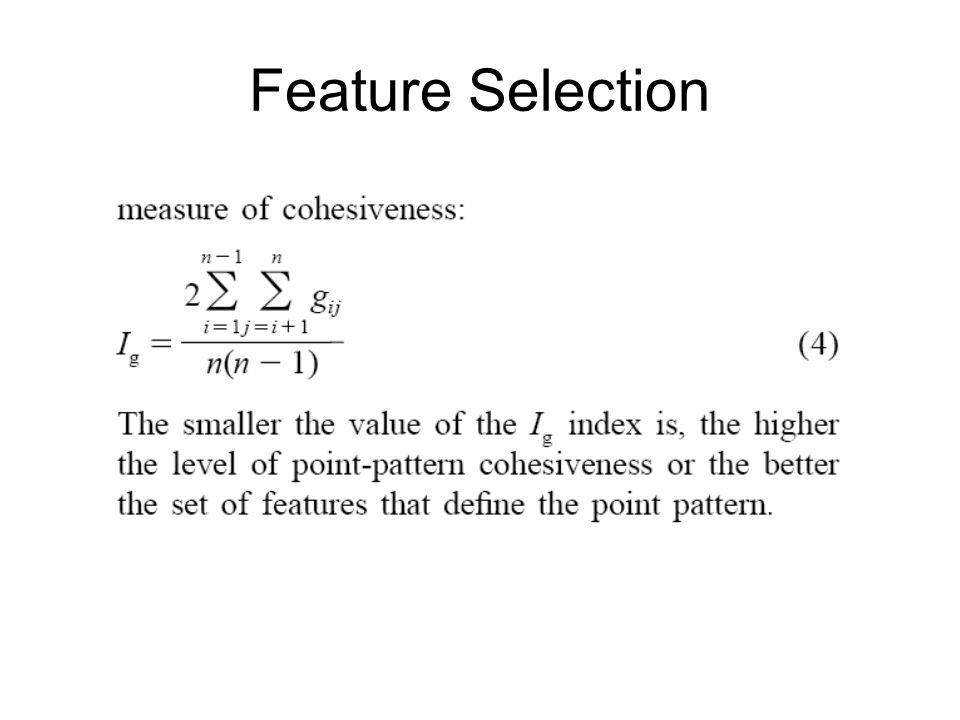
Feature Selection

15
Second paper mentions: –Use of the correlation structure to drop variables –Principal Components

19
Features Selected

20
Gaussian Mixture Model calibrated on July 7–20 data and tested on July 21–27 data (left) and July 21–August 3 data (right)
 and July 21–August 3 data (right)")
21
Weighted Product Kernel calibrated on July 7–20 data and tested on July 21–27 data (left) and July 21–August 3 data (right)
 and July 21–August 3 data (right)")
22
Filter Product Kernel calibrated on July 7–20 data and tested on July 21–27 data (left) and July 21–August 3 data (right)
 and July 21–August 3 data (right)")
23
Terrorist Events Example

24
Features Selected

25
Distance Features Only

26
Logistic Regression

28
Combination

29
Evaluation/Comparison of Models

30
The reasoning: Percentile scores should be larger at event points Evaluate percentile scores at all event point and average. Best model has highest average percentile score

31
Crime Example

32
Discussion Feature selection: Gini index seems ad- hoc. Can we do better? Different criminals have different preferences. Evaluation/comparison of different models: Can it be improved? Estimating a two-dimensional density using a density estimator from a high dimensional space (feature space)???
 .")
33
Density estimation from features Density f absolutely continuous with respect to Lebesgue measure For some small region R, let p R = R f(s) (ds) Then p R = f( R ) (R) for some R R Regions R 1, …, R N (Grid, Montecarlo, …) with (R i ) = h; i =1, …, N p i = Ri f(s) (ds) = f( i ) h
 (ds) Then p R = f( R ) (R) for some R R Regions R 1, …, R N (Grid, Montecarlo, …) with (R i ) = h; i =1, …, N p i = Ri f(s) (ds) = f( i ) h")
34
Density estimation from features Event locations s 1, …, s n N i = # of ss in region R i N i ~ bin(n, p i ); N i | N j ~ bin(n-N j, p i /(1-p j )) Generalized Linear Model g(p( )) = 0 + 1 x 1 + … + k x k N i ~ response; x 1 ( i ), …, x k ( i ) ~ predictors; g ~ link function p(s) = g -1 ( 0 + 1 x 1 (s) + … + k x k (s)) h f(s)
; N i | N j ~ bin(n-N j, p i /(1-p j )) Generalized Linear Model g(p( )) = x 1 + … + k x k N i ~ response; x 1 ( i ), …, x k ( i ) ~ predictors; g ~ link function p(s) = g -1 ( x 1 (s) + … + k x k (s)) h f(s)")
35
Thanks!

Similar presentations


>")


 ETHEM ALPAYDIN © The MIT Press, 2010>")


 Shengcai Liao, Guoying Zhao, Vili Kellokumpu,>")


 by adding a dynamic branching mechanism to neural networks.>")

>")


