Download presentation
Presentation is loading. Please wait.

1
ENERGY PATTERNS OF ENERGY FLOW IN ECOSYSTEMS

2
WHAT DO WE KNOW SO FAR? Ecosystems Biotic and abiotic components Energy and nutrients Energy transformed from one form to another When energy is transformed, energy is lost Sunlight is ultimate source of energy Food webs link organisms by trophic level

3
Isotopic views of food webs in the Everglades

4
From: Yodris, P. 1996. Food webs and perturbation experiments: theory and practice. In Food webs: integration of patterns and dynamics. Chapman & Hall.

5
PRIMARY PRODUCTION Producers capture energy of light Transform sunlight energy into energy of chemical bonds in carbohydrates 6CO 2 + 6H 2 O → C 6 H 12 O 6 + 6O 2 –For each g of C assimilated, 39 kJ energy stored Gross primary production = total energy assimilated by primary producers Net primary production = energy accumulated (in stored form) by primary producers GPP – NPP = Respiration –Energy consumed by producers for maintenance and biosynthesis
 by primary producers GPP – NPP = Respiration –Energy consumed by producers for maintenance and biosynthesis")
6
Partitioning gross primary productivity into respiration and net primary productivity Energy lost and unavailable to consumers NPP GPP

7
NUTRIENTS STIMULATE PRIMARY PRODUCTION Terrestrial production may be nutrient limited –N most common limiting element Aquatic systems often strongly nutrient-limited –Open ocean –Addition of nutrients may stimulate unwanted production

8
PRIMARY PRODUCTION VARIES AMONG ECOSYSTEMS Maximum under favorable conditions –Intense sunlight –Warm temperatures –Abundant precipitation –Nutrients

10
Grams carbon/m 2 /yr for globe, as calculated from satellite imagery. Oceans = 46%, land = 54%

11
NPP vs. Temperature + Precipitation

12
http://sfbay.wr.usgs.gov/archive/ColeCloern/images/Yieldvs.Prod.gif Why is 1º productivity important?

13
HETEROTROPHS - CONSUMERS Get energy from external sources “Animals” Primary consumers Secondary consumers Tertiary consumers –Carnivores Decomposers –Detritivores –Eat dead organic matter

14
Decomposers Primary consumers Primary producers Secondary consumers Tertiary consumers

15
Decomposers Primary consumers Primary producers Secondary consumers Tertiary consumers

16
ECOLOGICAL PYRAMIDS Trophic levels placed in order Reflects: –Numbers of organisms at each level –Biomass of each level –Energy at each level

17
ECOLOGICAL PYRAMIDS Elton observed predators tended to be larger and less numerous than their prey - described as the ‘pyramid’ of numbers or biomass Elton hypothesized that this occurred because predators have to be larger than prey

18
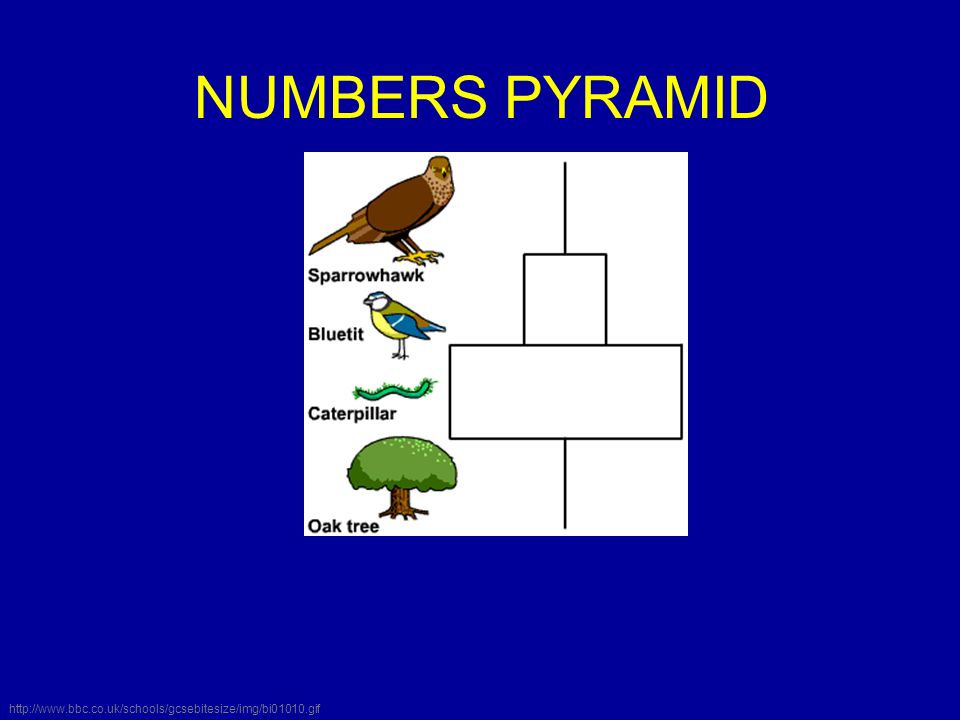
# PRIMARY PRODUCERS # HERBIVORES # CONSUMERS # CONSUMERS=TOP CARNIVORES # DECOMPOSERS PYRAMID OF NUMBERS

19
kg PRIMARY PRODUCERS kg HERBIVORES kg CONSUMERS kg CONSUMERS=TOP CARNIVORES kG DECOMPOSERS PYRAMID OF BIOMASS

20
kJ PRIMARY PRODUCERS kJ HERBIVORES kJ CONSUMERS kJ CONSUMERS=TOP CARNIVORES kJ DECOMPOSERS PYRAMID OF ENERGY

21
NUMBERS PYRAMID

22
http://www.bbc.co.uk/schools/gcsebitesize/img/bi01010.gif
23
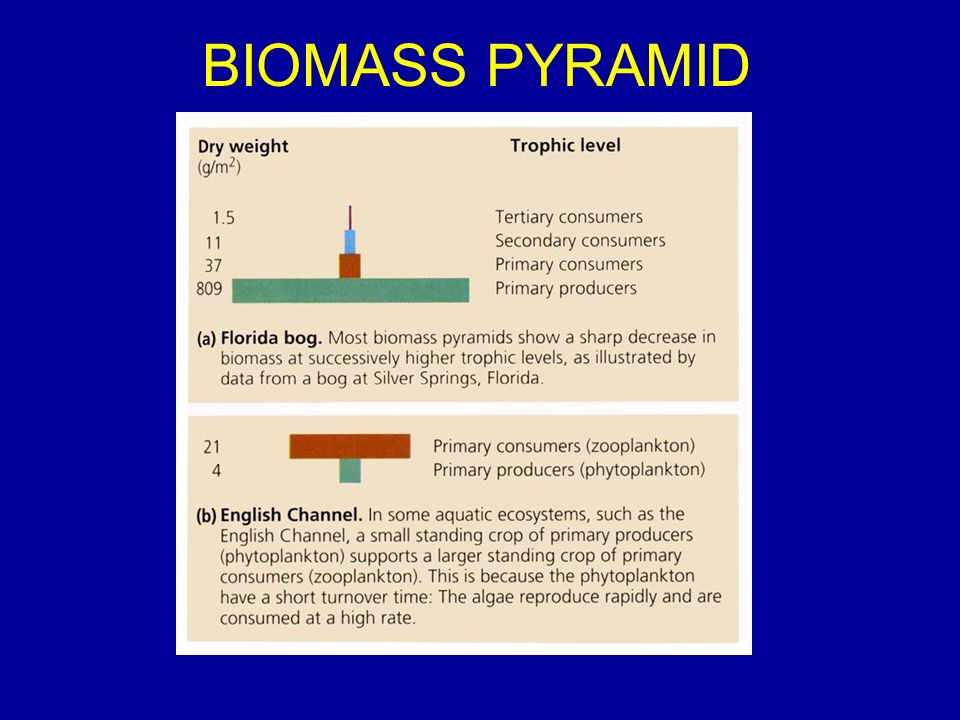
BIOMASS PYRAMID

25
BIOMASS AND (NUMBERS) PYRAMID
 PYRAMID")
26
ENERGY PYRAMID

27
Heat is lost as energy flows through food chain

28
Energy pyramids can never be inverted, but biomass pyramids can be inverted when lower trophic levels are dominated by palatable and small organisms that turnover rapidly

29
What % of energy is available to the next tropic level?

30
ENERGY TRANSFER EFFICIENCY 10% Efficient between trophic levels What happens to other 90% –How is it dispersed? –Is it lost? –Account for it

31
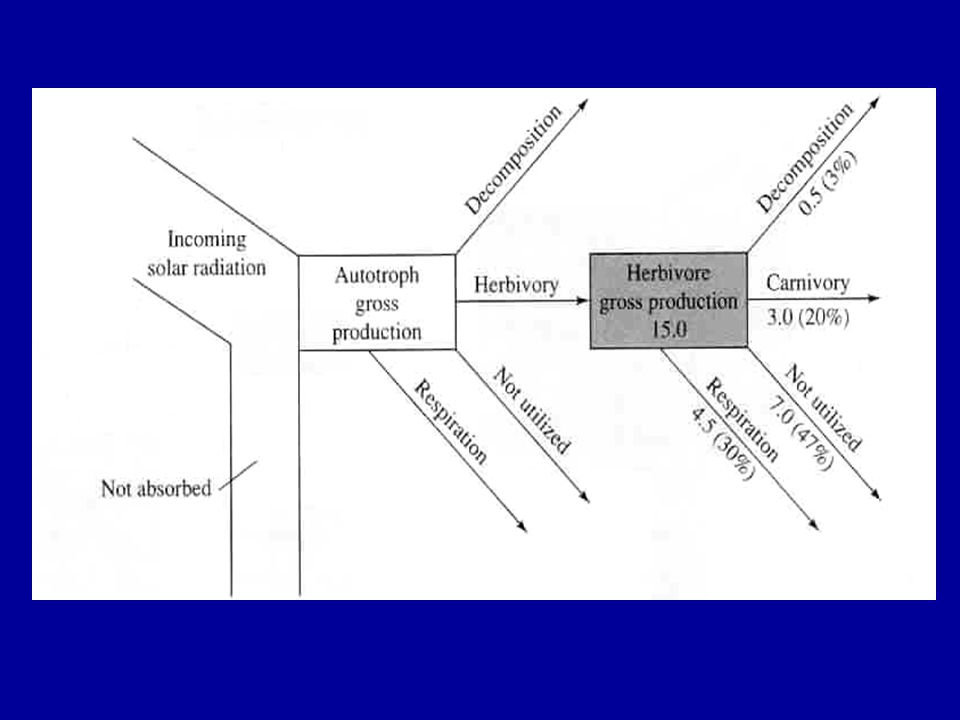
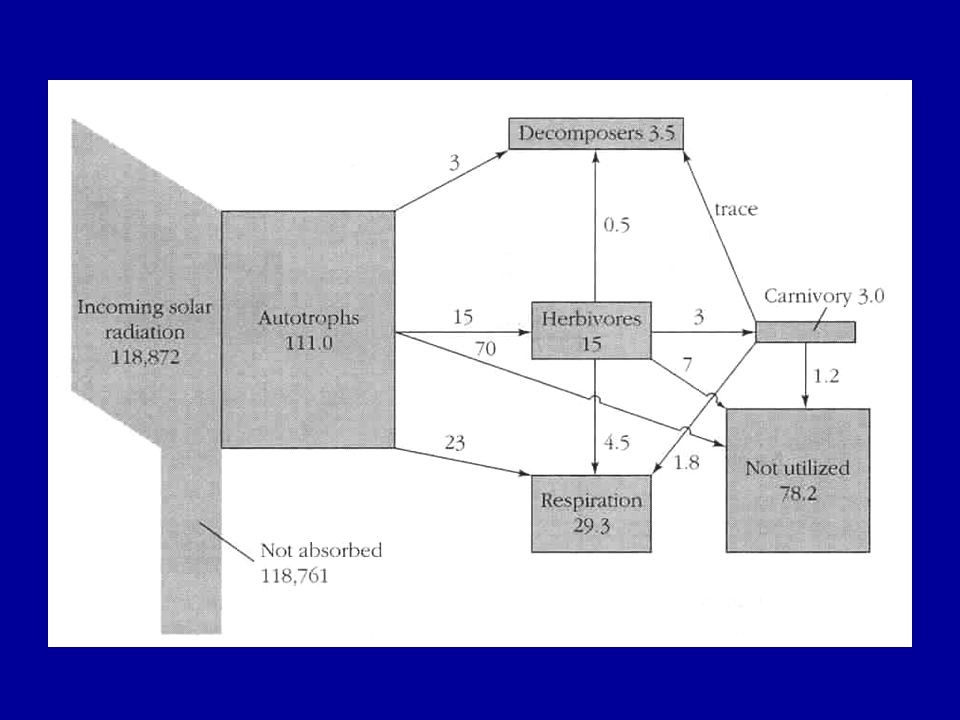
ENERGY BUDGET

32
Energy Budget – energy flow & distribution through ecosystem

36
ONLY 5% TO 20% OF ENERGY PASSES BETWEEN TROPHIC LEVELS Energy reaching each trophic level depends on: –Net primary production (base of food chain) –Efficiencies of transfers between trophic levels Plants use 15-70% of light energy assimilated for maintenance Herbivores and carnivores expend more energy on maintenance than plants: - Production of each trophic level is only 5-20% of level below it
 –Efficiencies of transfers between trophic levels Plants use 15-70% of light energy assimilated for maintenance Herbivores and carnivores expend more energy on maintenance than plants: - Production of each trophic level is only 5-20% of level below it")
37
ECOLOGICAL EFFICIENCY Elephant dung Not all food components can be assimilated Owl pellets

38
FUNDAMENTAL ENERGY RELATIONSHIPS Components of an animal’s energy budget are related by: Assimilated Energy = Ingested Energy – Egested Energy Production = Assimilated Energy – (Respiration-Excretion)
")
39
ASSIMILATION EFFICIENCY Assimilation Efficiency = Assimilation/Ingestion Function of Food Quality: –SEEDS: 80% –YOUNG VEGETATION: 60-70% –PLANT FOODS OF GRAZERS, BROWSERS: 30-40% –DECAYING WOOD: 15% –ANIMAL FOODS: 60-90%

40
NET PRODUCTION EFFICIENCY Net production efficiency = production/assimilation depends on metabolic activity: –birds: <1% –small mammals: <6% –sedentary ectotherms: as much as 75% Gross production efficiency = assimilation efficiency x net production efficiency –= production/ingestion, ranges from below 1% (birds and mammals) to >30% (aquatic animals). High rate of metabolism results in low production efficiencies

41
DETRITUS FOOD CHAINS Ecosystems support two parallel food chains: –herbivore-based (relatively large animals feed on leaves, fruits, seeds) –detritus-based (microorganisms and small animals consume dead remains of plants and indigestible excreta of herbivores) –herbivores consume: 1.5-2.5% of net primary production in temperate forests 12% in old-field habitats 60-99% in plankton communities
 –detritus-based (microorganisms and small animals consume dead remains of plants and indigestible excreta of herbivores) –herbivores consume: % of net primary production in temperate forests 12% in old-field habitats 60-99% in plankton communities")
42
Stopped here

43
What limits the length of the food chain?

44
Food chain length may be limited by: Energy constraint hypothesis –Energy is lost with each transfer –Food chain length should be related to productivity –Not supported by research Dynamic stability hypothesis –Long food chains easily disrupted –Support is tentative Ecosystem size –Species diversity higher

46
http://www.yale.edu/post_lab/images/FCL_ecosize_large.gif

47
SOME GENERAL RULES Assimilation efficiency increases at higher trophic levels. GPP and NPP efficiencies decrease at higher trophic levels. Ecological efficiency ~ 10%. ~ 1% of NPP ends up as production on the third trophic level – the energy pyramid narrows quickly. To increase human food supplies means eating lower on the food chain!

48
Food energy available to the human population depends on their trophic level.

49
http://ginsea.aos.wisc.edu/labs/mendota/All-north.jpg
50
From Carpenter, S. R., and J. F. Kitchell, eds. 1993. The Trophic Cascade in Lakes. Cambridge University Press.

52
More piscivores Less piscivores

Similar presentations


:>")


 A. Food chains and food webs Grazing Detrital (decomposer) B. Energy budget - flow of.>")


