Download presentation
Presentation is loading. Please wait.

1
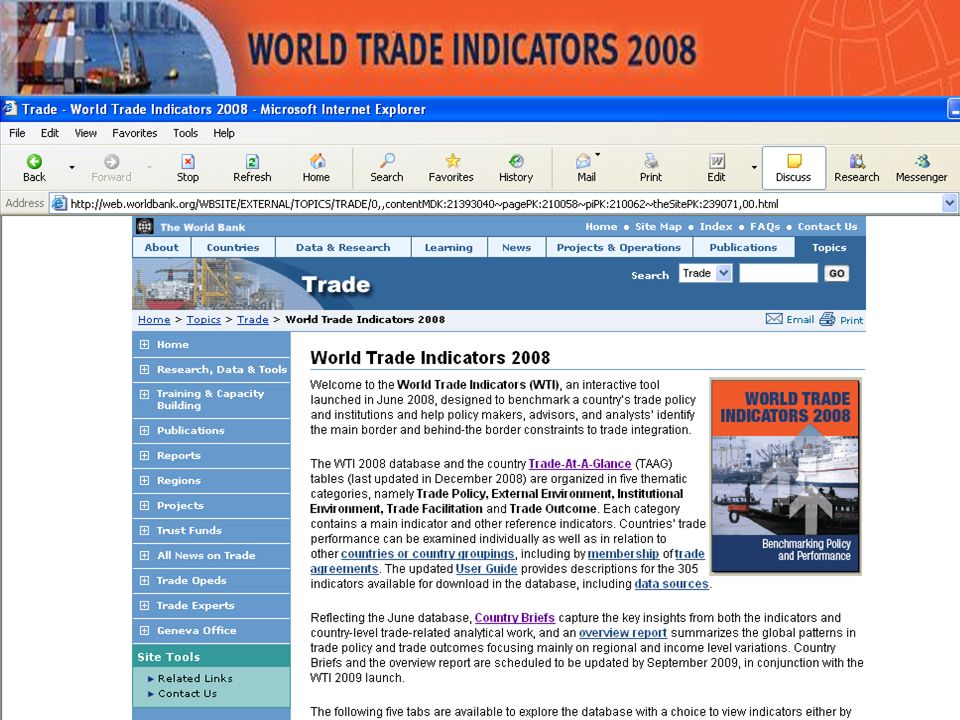
World Trade Indicators 2008 http://www.worldbank.org/wti2008 http://www.worldbank.org/wti2008 Ravindra A. Yatawara Data Day at the WTO May 18 th - May 19 th to 2009 Geneva, Switzerland

2
What is the WTI Project? Comprehensive database of trade-related indicators of policy and performance Yearly data from 1995-2008 (thanks to ITC for 2005- 08) Information on other trade databases and links Online Tool- Benchmarking and Ranking Tool Country rankings (default and customized) Charts, tables, and maps (default and customized) Users can choose time periods and country groups 210 Country Trade-at-a-Glance (TAAG) tables 139 Country briefs Overview report
 Information on other trade databases and links Online Tool- Benchmarking and Ranking Tool Country rankings (default and customized) Charts, tables, and maps (default and customized) Users can choose time periods and country groups 210 Country Trade-at-a-Glance (TAAG) tables 139 Country briefs Overview report.")
3
Provide impetus for trade policy changes by highlighting performance relative to competitors/partners Support overall trade negotiations and policy design by facilitating overtime and cross-country comparison of different dimensions of policy affecting trade outcomes – data quite aggregated- not HS6 Support overall trade negotiations and policy design by facilitating overtime and cross-country comparison of different dimensions of policy affecting trade outcomes – data quite aggregated- not HS6 Highlight gaps in the data Why?

4
Production weighted tariff averages Share of tariff lines with a zero MFN tariff rate Share of tariff lines with a zero MFN tariff rate MFN zero duty imports and exports values MFN zero duty imports and exports values Imports and exports to/from partners in FTA and CUs Imports and exports to/from partners in FTA and CUs Utilization rates and value of EU and US preferences Utilization rates and value of EU and US preferences Extent of services trade liberalization commitments Index of export product concentration from UNCTAD Index of import product concentration Export market destination/ import origin concentration indices Share of top 5 exports in total exports Remittance Inflows as a % of Total Exports/Imports Database assembles existing information and provides new indicators

5
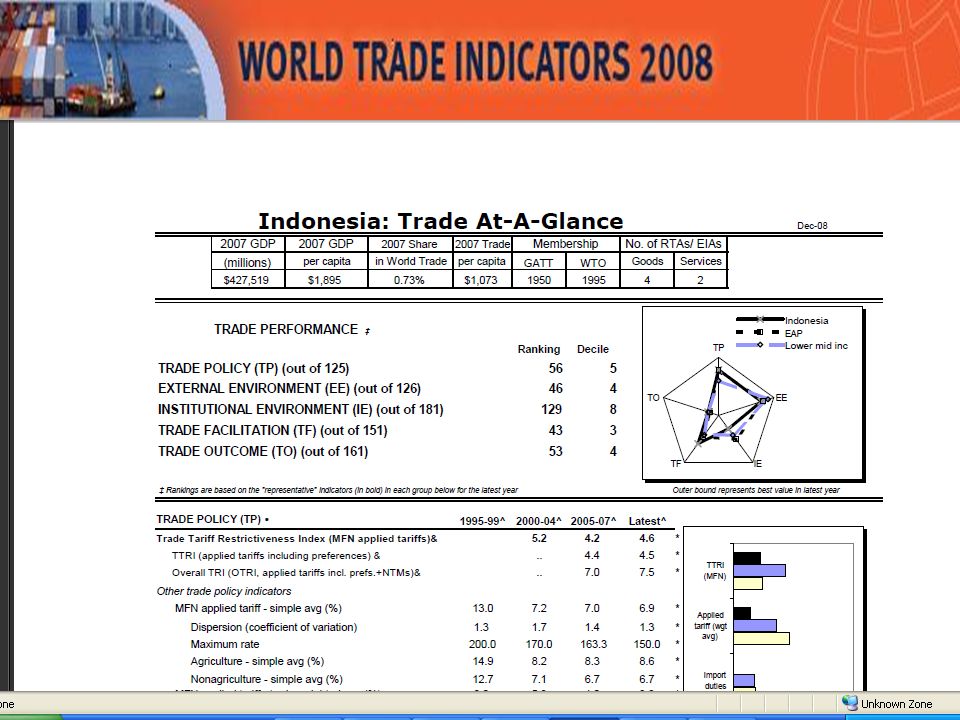
Structure of WTI database: organizing for users TRADE OUTCOME TRADE POLICY EXTERNAL ENVIRONMENT BUSINESS/ INSTITUTIONAL ENVIRONMENT TRADE FACILITATION

6
–Tariff Trade Restrictive Indices (default), OTRIs- –Tariffs -MFN applied vs. applied incl pref –Ad valorem (AV) only, incl AVE –All goods, agric, NAMA –Average, weighted,dispersion, max –MFN- O import value (% of import value) –GATS comittement index TRADE POLICY- Values/Ranks
 only, incl AVE –All goods, agric, NAMA –Average, weighted,dispersion, max –MFN- O import value (% of import value) –GATS comittement index TRADE POLICY- Values/Ranks.")
7
Market Access – MA- TTRI (OTRI) ROW tariffs REER External Environment
 ROW tariffs REER External Environment")
8
Doing Business Indicators Governance indicators Institutional Environment

9
Logistics Performance Index (LPI) – default Logistics Performance Index (LPI) – default Trading Across Borders - Doing Business Trading Across Borders - Doing Business Trade Facilitation
 – default Logistics Performance Index (LPI) – default Trading Across Borders - Doing Business Trading Across Borders - Doing Business Trade Facilitation")
10
Trade Outcomes Goods and Services trade growth- real,nominal, share of GDP Goods and Services trade growth- real,nominal, share of GDP Goods vs. Services Goods vs. Services Product and Market Concentration indices for Exports and Imports Product and Market Concentration indices for Exports and Imports

11
WTI Functionalities Views: Country Rankings Country Rankings Country Snapshots Country Snapshots Country Comparisons Country Comparisons Overtime Comparisons Overtime Comparisons Map Map

13
Indicators Category Trade Policy External Environment Institutional Environment Trade Facilitation Trade Outcome Country TTRI (MFN applied tariff) - All Goods MA-TTRI (applied tariff incl. prefs.) - All Goods Ease of Doing Business - rank (out of 178) LPI - Overall Real growth in total trade (g+s, %) Year 2006-2008 Latest Hong Kong, China 17848152 Singapore 1541148 Switzerland 34321739 Papua New Guinea 4795 144 Turkey 5525934109 Default ranking: Top 5 countries
 - All Goods Ease of Doing Business - rank (out of 178) LPI - Overall Real growth in total trade (g+s, %) Year Latest Hong Kong, China Singapore Switzerland Papua New Guinea Turkey Default ranking: Top 5 countries.")
14
Alternative ranking: Top 5 countries Indicators Category Trade Policy External Environment Institutional Environment Trade Facilitation Trade Outcome Country Applied Tariff - Simple Average - All Goods (%) ROW Applied Tariff (incl. prefs) - Simple Average - All Goods (%) Ease of Doing Business - rank (out of 178) LPI - Overall Real growth in total trade (g+s, %) Year 2006-2008 Latest Hong Kong, China 119648152 Macao, China 1164.. 6 Singapore 31301148 Georgia 46315..54 Austria 510527583
 - Simple Average - All Goods (%) Ease of Doing Business - rank (out of 178) LPI - Overall Real growth in total trade (g+s, %) Year Latest Hong Kong, China Macao, China Singapore Georgia Austria")
16
Overhang=Bound-Applied Policy Space

17
Share of exports to FTA/CU partner

22
Launch – September More Analytics Export taxes, trade finance Actual services trade restrictiveness WTI 2009

23
Thank You Comments, Suggestions, Ideas welcome ryatawara@worldbank.org

Similar presentations


, Jehan Sauvage (OECD) and Ben Shepherd (Developing Trade Consultants Ltd.)>")

 Conference.>")


 For more information,>")

 Workshop on PTAs and the WTO: A New Era Geneva, 4 November 2010.>")


 and related fisheries issues European Commission 15 June 2005 EU/ACP Economic Partnership Agreements.>")

