Download presentation
Presentation is loading. Please wait.

2
Trade Choices You have $1,000 to spend and your alternatives are: Purchase 1 U.S.-made television and 1 U.S.-made bicycle. or Purchase 1 Chinese-made television, 1 Korean-made bicycle and 2 cases of French wine. or Purchase $1,000 of stock in a Canadian company. Which do you choose?

3
Voluntary Trade Creates Wealth

4
Example 1

10
Win - Win

11
Win – Win ?

12
Win – Win ??

13
Win – Win ???

14
Apples and Oranges Apple price $.70/lb Orange Price $.70/lb Washington Grower 20 acres yields Apples 50 bu/acre Oranges 1bu/acre Florida Grower 20 acres yields Apples 2bu/acre Oranges 40 bu/acre Trade & Comparative Advantage – Example

15
RankCountryExportsImportsTotal Trade % of Total Trade ---Total, All Countries 665.2948.21,613.4100.0% 1Canada127.0141.0268.016.6% 2China49.3174.5223.813.9% 3Mexico98.3119.0217.213.5% 4Japan27.755.382.95.1% 5Germany21.150.271.34.4% 6Korea, South18.827.946.72.9% 7United Kingdom21.322.443.72.7% 8France13.119.732.82.0% 9Saudi Arabia7.224.431.62.0% 10Brazil17.711.229.01.8% Top 10 U.S. Trade Partners, Total Trade, Year to Date (May, 2014) US$, bn, unrevised http://www.census.gov/foreign-trade/statistics/highlights/top/top1405yr.html
 US$, bn, unrevised")
16
RankCountry Imports % of Total Imports ---Total, Top 15 Countries 726.576.6% 1China174.518.4% 2Canada141.014.9% 3Mexico119.012.5% 4Japan55.35.8% 5Germany50.25.3% 6Korea, South27.92.9% 7Saudi Arabia24.42.6% 8U.K22.42.4% 9France19.72.1% 10India19.22.0% Country Exports % of Total Exports Total, Top 15 Countries 477.571.8% Canada127.019.1% Mexico98.314.8% China49.37.4% Japan27.74.2% U.K.21.33.2% Germany21.13.2% Korea, South18.82.8% Netherlands17.92.7% Brazil17.72.7% Hong Kong16.82.5% U.S. Trade, Imports & Exports, Year to Date (May, 2014) US$, bn, unrevised http://www.census.gov/foreign-trade/statistics/highlights/top/top1405yr.html
 US$, bn, unrevised")
17
RankCountrySurplus 1Hong Kong14.5 2Netherlands8.8 3United Arab Emirates 7.6 4Australia6.7 5Brazil6.5 6Singapore6.1 7Belgium5.3 8Panama4.2 9Argentina2.7 10Egypt2.6 RankCountryDeficit 1China-28.8 2Germany-6.6 3Japan-5.1 4Mexico-4.3 5Canada-2.8 6Korea, South-2.7 7Saudi Arabia-2.7 8India-2.4 9Ireland-2.1 10Italy-2.1 U.S. Trade Surplus & Deficit, Year to Date (May, 2014) US$, bn, unrevised http://www.census.gov/foreign-trade/statistics/highlights/top/top1405yr.html
 US$, bn, unrevised")
18
http://www.census.gov/foreign-trade/data/index.html

19
Balance of Payments

20
Example

22
The Data

24
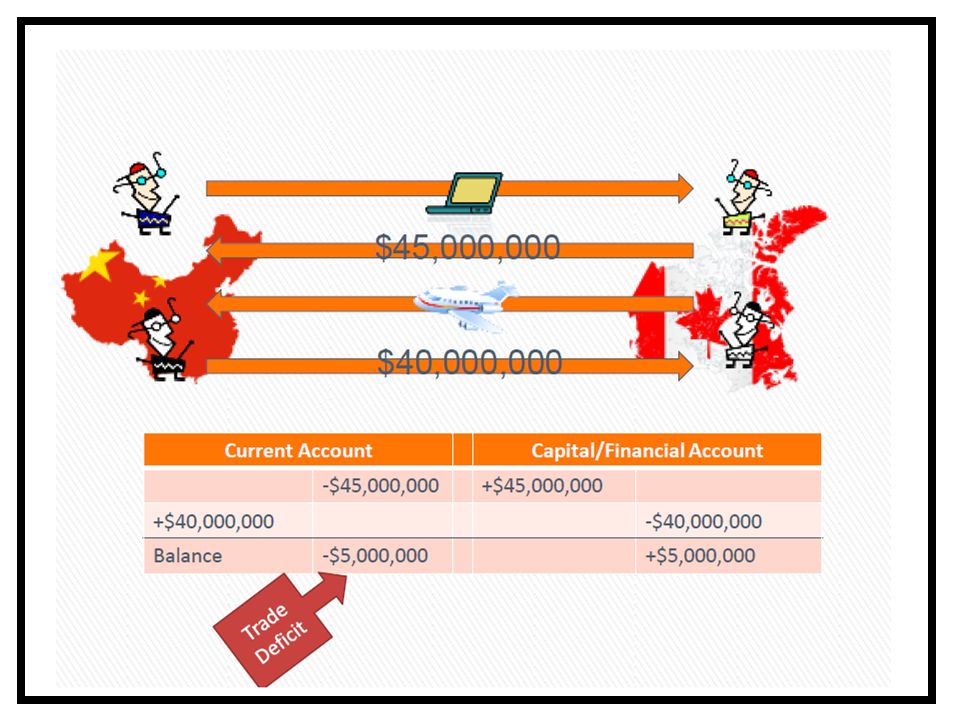
The Balances

25
Trade Deficit

26
International Comparisons of Hourly Compensation Costs in Manufacturing

Similar presentations


 Total TradeTotal.>")
