Download presentation
Presentation is loading. Please wait.

1
Indonesia and Global Economy Growth in Developed and Developing Countries Dr. Adrian Teja

2
Economic Issues Winners Countries Keep Winning, Losers Countries Keep Losing. –Why Winners Win and Loser Lose? But... Some Countries Able To Change Their Fate, From Loser Countries to be Winner Countries. –Why? –Will poor countries automatically catch up with rich countries over time? –What Drive Long Run Economic Growth?

3
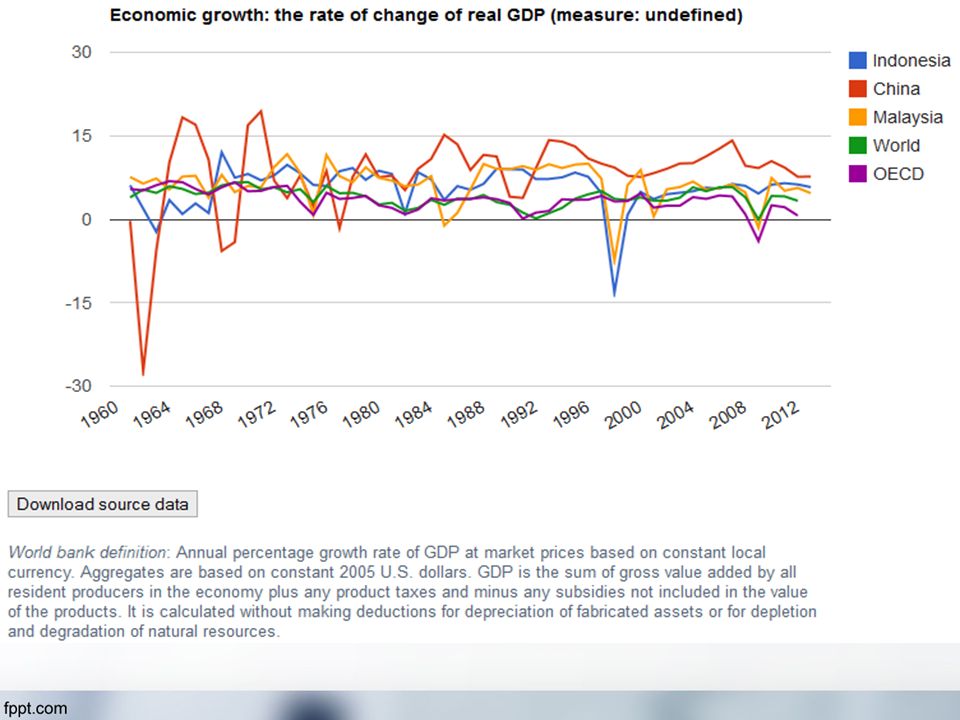
Real GDP Growth Among Countries (1) DescriptionAverage Annual Real GDP Growth (percent) Real GDP Per Capita in Dollars a 1971–19801981–19901991–20002001–2010 1950197019902010 Advanced Economies 3.2 3.1 2.8 1.6 Canada 4.0 2.8 2.4 1.8 $12,053$19,919$31,1969$41,288 United States 3.1 2.9 3.4 1.6 14,55922,80635,32846,697 France 2.9 2.4 1.7 1.2 8,26618,18628,12734,358 Germany 2.7 2.3 0.9 na 28,62437,367 Ireland 4.7 3.9 7.1 2.6 5,4969,86918,81236,433 Italy 3.4 2.2 1.7 0.3 5,95416,52227,73431,069 Spain 3.0 2.9 2.1 3,96411,44421,8330,504 United Kingdom 1.6 2.7 2.8 1.5 11,60218,00227,46937,378 Hong Kong 9.2 6.5 3.9 4.1 3,1288,03124,73443,324 Japan 4.3 4.0 1.3 0.8 3,04815,41329,81334,828 Singapore 10.5 7.3 5.6 4,2998,627,5556,224 South Korea 7.4 9.1 7.2 4.2 1,1853,00912,08330,079 Taiwan 10.9 7.9 6.5 3.8 1,4253,94815,46536,413 Australia 3.2 3.3 3.4 3.0 13,21921,44430,62845,951 New Zealand 1.6 2.5 2.9 2.3 13,79518,25522,33131,223
 DescriptionAverage Annual Real GDP Growth (percent) Real GDP Per Capita in Dollars a 1971– – – – Advanced Economies Canada $12,053$19,919$31,1969$41,288 United States ,55922,80635,32846,697 France ,26618,18628,12734,358 Germany na 28,62437,367 Ireland ,4969,86918,81236,433 Italy ,95416,52227,73431,069 Spain ,96411,44421,8330,504 United Kingdom ,60218,00227,46937,378 Hong Kong ,1288,03124,73443,324 Japan ,04815,41329,81334,828 Singapore ,2998,627,5556,224 South Korea ,1853,00912,08330,079 Taiwan ,4253,94815,46536,413 Australia ,21921,44430,62845,951 New Zealand ,79518,25522,33131,223")
4
Real GDP Growth Among Countries (2) DescriptionAverage Annual Real GDP Growth (percent) Real GDP Per Capita in Dollars a 1971–19801981–19901991–20002001–2010 1950197019902010 Developing Countries 4.3 4.2 5.4 6.3 Developing Asia 6.2 6.9 7.4 8.5 China 10.4 9.1 10.4 10.5 4026981,6778,569 India 3.9 5.9 5.6 7.5 6589221,393,575 Indonesia 8.4 5.4 4.0 5.2 8041,1822,5174,740 Pakistan 4.5 6.0 3.9 4.8 6669851,6452,600 Philippines 6.6 1.7 3.0 4.7 1,2962,1362,663,672 Vietnam 4.7 5.9 7.6 7.3 6897701,0733,369 Middle East 2.9 3.0 4.0 4.9 Egypt 5.9 4.4 4.9 1,1321,563,1375,306 Turkey 4.1 5.2 3.6 4.0 2,3274,4137,74111,769 Saudi Arabia 11.0 1.7 2.7 3.3 5,0617,29220,39922,951 Latin America 6.5 1.6 3.3 3.4 Argentina 2.9 –1.2 4.2 4.6 6,1649,0267,95213,468 Brazil 8.8 1.5 2.5 3.6 2,3654,3246,9599,589 Mexico 6.6 1.8 3.5 1.8 4,187,63410,75413,710 Peru 7.6 –0.8 4.0 5.7 3,4645,7864,5168,671 Venezuela 1.6 1.9 2.1 3.5 8,10411,599,02810,56 Africa 3.5 2.5 2.4 5.7 Botswana 17.1 10.9 6.4 4.2 4497743,7315,311 Ethiopia 3.0 1.9 2.9 8.4 314479462749 Kenya 7.4 4.3 1.7 4.1 7911,1131,3591,376 Nigeria 7.4 2.0 1.9 8.7 8141,1831,2032,037 South Africa 4.1 1.5 1.8 3.5 4,3616,9596,5958,716
 DescriptionAverage Annual Real GDP Growth (percent) Real GDP Per Capita in Dollars a 1971– – – – Developing Countries Developing Asia China ,6778,569 India ,393,575 Indonesia ,1822,5174,740 Pakistan ,6452,600 Philippines ,2962,1362,663,672 Vietnam ,0733,369 Middle East Egypt ,1321,563,1375,306 Turkey ,3274,4137,74111,769 Saudi Arabia ,0617,29220,39922,951 Latin America Argentina 2.9 – ,1649,0267,95213,468 Brazil ,3654,3246,9599,589 Mexico ,187,63410,75413,710 Peru 7.6 – ,4645,7864,5168,671 Venezuela ,10411,599,02810,56 Africa Botswana ,7315,311 Ethiopia Kenya ,1131,3591,376 Nigeria ,1831,2032,037 South Africa ,3616,9596,5958,716")
5
Real GDP Growth Among Countries (3) a The measure of GDP per capita is in constant US dollar market prices for 2010 and adjusted for cross-country differences in the relative prices of goods and services using purchasing power parity (PPP). Sources: International Monetary Fund, World Economic Outlook database for growth rates, and Conference Board, Total Economy Database (September 2011).
..")
7
What explains the diverse experiences among the developing countries and between the developed and developing ones? The literature on economic growth focuses primarily on the role of capital and labor resources and the use of technology as sources of growth. In addition to these purely economic drivers, developed and developing countries differ with respect to the presence or absence of appropriate institutions that support growth. These institutions enable developing countries to raise their standards of living and eventually move into the ranks of developed countries.

8
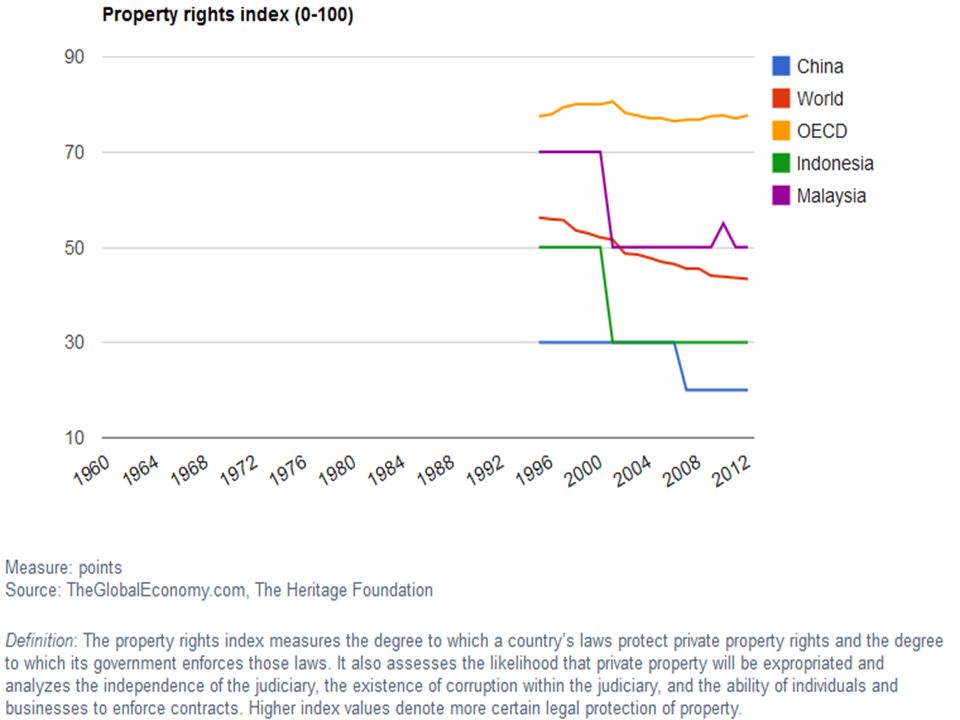
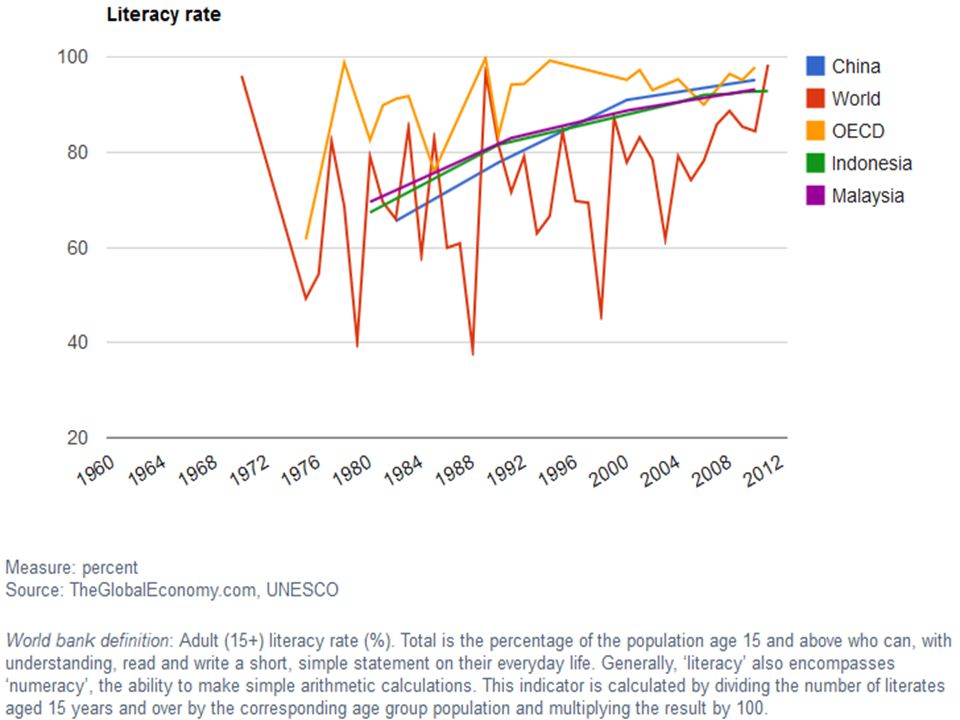
Key Requirements and Institutions For Growth 1.Savings and Investment 2.Financial Markets and Intermediaries 3.Political Stability, Rule of Law, and Property Rights 4.Education and Health Care Systems 5.Tax and Regulatory Systems 6.Free Trade and Unrestricted Capital

9
Saving and Investment Why? Theories?

10
Saving = Investment Closed Economy

12
Source: APO Productivity Data Book 2014

13
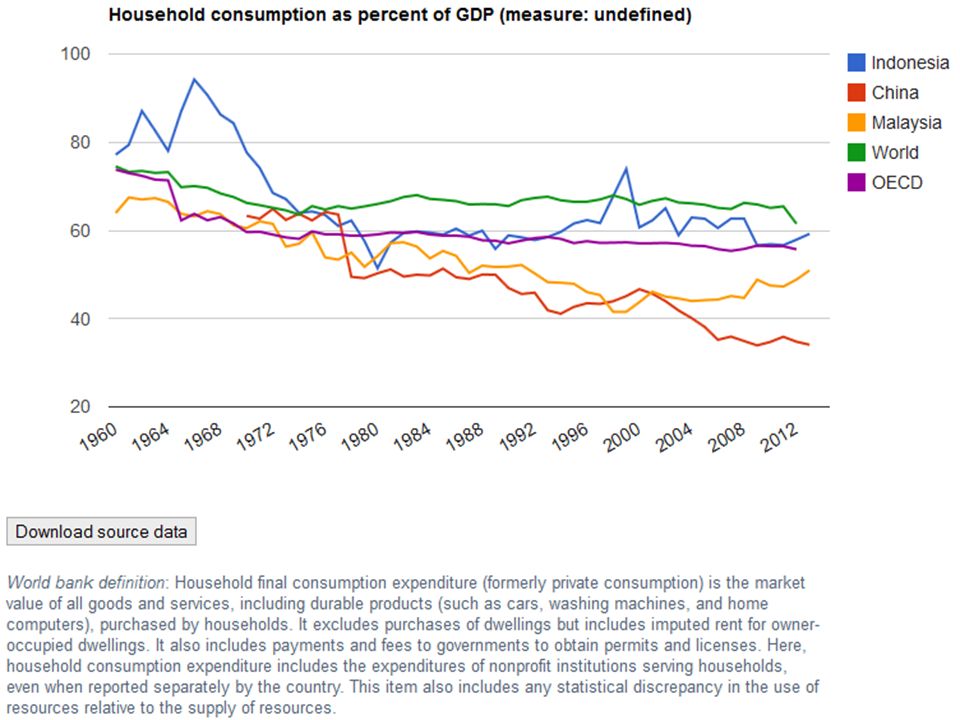
Group Assignment What is the Differences of Consumption Expenditure Pattern Between High Food Consumption Share Countries and Low Food Consumption Share Countries? Time 10 minutes

14
Financial Market and Intermediaries Why? Theories?

15
Saving ≠ Investment Open Economy

21
How to Finance? Stock Market Bond Market Foreign Direct Investment

25
Political Stability, Rule of Law, and Property Rights Why? Theories?

30
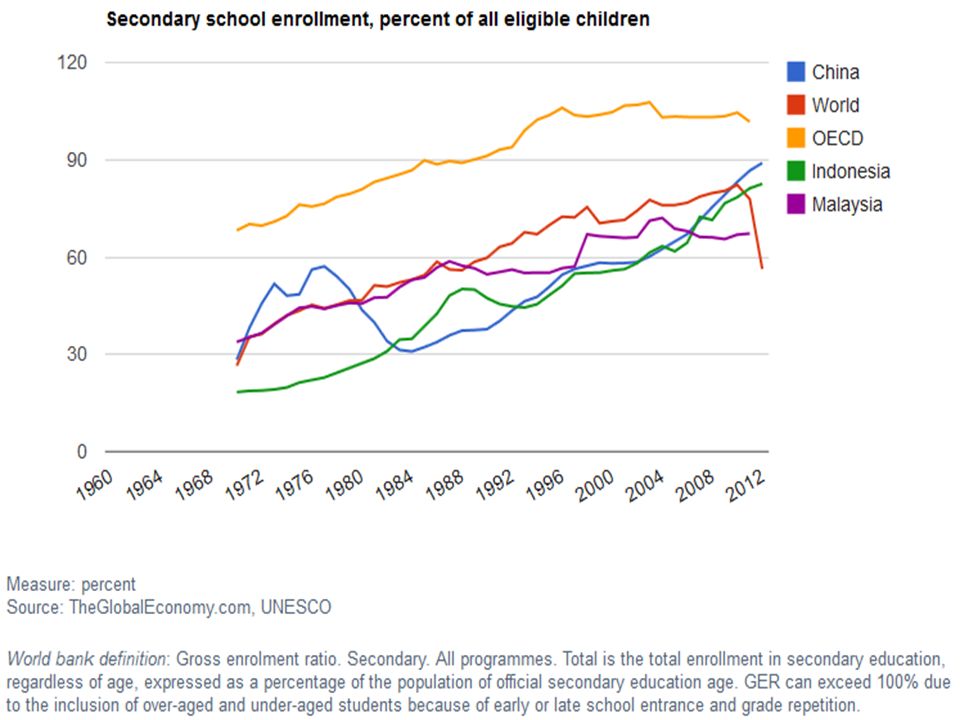
Education and Health Care System Why? Theories?

44
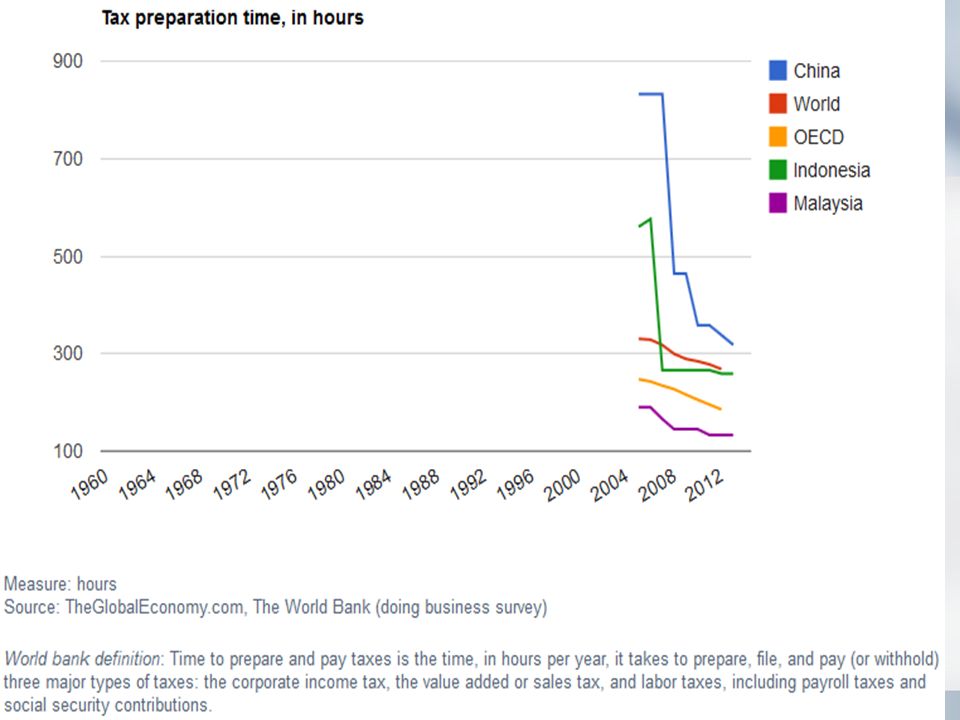
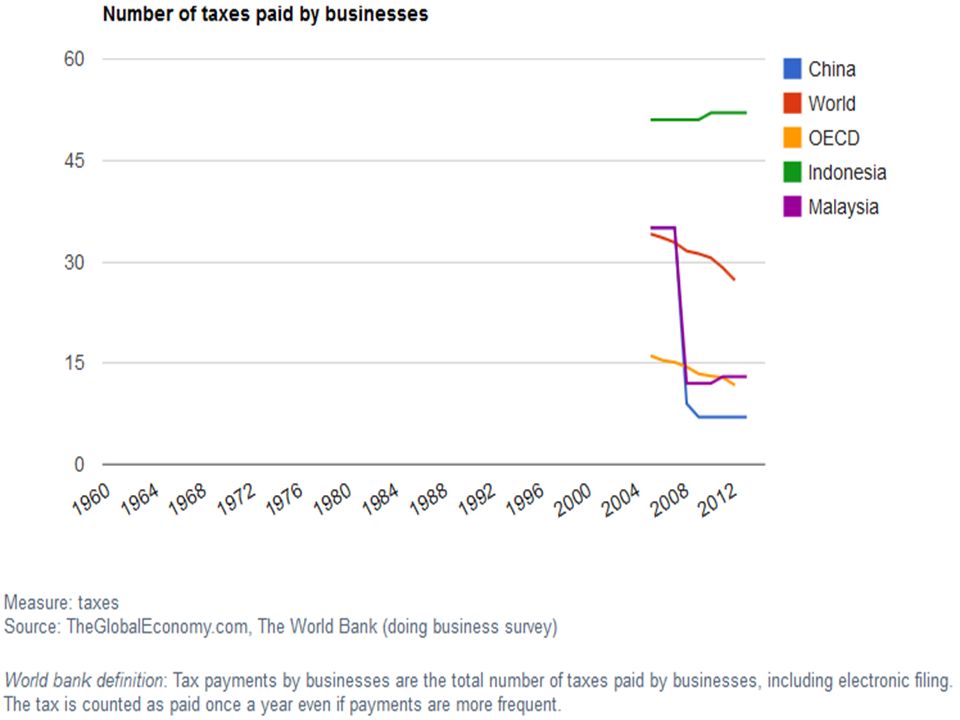
Tax and Regulatory Systems Why? Theories

49
Free Trade and Unrestricted Capital Why? Theories?

53
Group Assignment What Are Your Opinions Regarding Key Requirement and Institution for Growth in Indonesia? Rank the Priority? Explain. Compare Your Opinion with Jokowi JK Vision- Mission Priority? After more than 100 days, how much your group expectation change from Jokowi-JK Administration?

Similar presentations


 2013 summary report Model developed by the Economist Intelligence Unit (EIU)>")


 -15 -10 -5 0 5 10 15 1996199719981999200020012002200320042005 (est.)2006 (est.)2007.>")


