Download presentation
Presentation is loading. Please wait.

1
A Model of the Food-Web Bioaccumulation of PCBs in San Francisco Bay Frank A.P.C. Gobas and Jon A. Arnot School of Resource & Environmental Management Simon Fraser University Burnaby British Columbia Canada

2
Biological effect levels in seals, bird eggs Human Health Risk levels Concentrations in prey species (food-web) Concentrations in higher trophic species Concentrations in sport fish Concentrations in Water & Sediment Loadings End-Point Acceptable loadings Target Levels, criteria
 Concentrations in higher trophic species Concentrations in sport fish Concentrations in Water & Sediment Loadings End-Point Acceptable loadings Target Levels, criteria")
3
Biota Sediment Accumulation Factor (BSAF) BSAF = C B / C S Sediment
 BSAF = C B / C S Sediment")
5
SFB Food-Web Bioaccumulation Model C sediment C biota Input Model Output C biota = BSAF x C sediment Log C biota = log BSAF + log C sediment

6
SFB Food-Web Bioaccumulation Model C sediment C biota

7
Model Performance Analysis Model Bias (MB) = 10 BSAF predicted BSAF observed Log ( BSAF predicted,i BSAF observed,i ) / n i=1 n
 = 10 BSAF predicted BSAF observed Log ( BSAF predicted,i BSAF observed,i ) / n i=1 n")
8
Model Uncertainty Analysis 1. Monitoring data 2. Stochastic Analysis : Monte Carlo Simulations

9
C s, PCB congener 1 C b, PCB congener 1 Congener Specific Calculation C s, PCB congener 2 C b, PCB congener 2 C s, PCB congener 3 C b, PCB congener 3 C sediment, PCB C biota, PCB + * *

10
Results: Model Performance Analysis

13
Results: Results: Model Performance Analysis - PCB

14
Model Application Forwards Calculation SFB Food-Web Bioaccumulation Model + =

15
Distributions of PCB concentrations in sediments in the Northern (blue line), Southern (red line) and Central (green line) sections of San Francisco Bay as well as the distribution for the entire Bay (black line) based on a total of 1,284 samples collected at RMP stations between 1999 and 2001.
, Southern (red line) and Central (green line) sections of San Francisco Bay as well as the distribution for the entire Bay (black line) based on a total of 1,284 samples collected at RMP stations between 1999 and 2001.")
18
Threshold Effect Concentration: Immunotoxicity (Kannan et al. 2000)
")
19
Model Application Backwards Calculation SFB Food-Web Bioaccumulation Model = -

20
Brown : Current Concentration in Sediment Green : Based on NOAEL Red: Based on LOAEL Blue: Based on Threshold Effect Concentration Grey: Based on human health hazard (H=1) Black: Based Upperbound estimate of 1:100,000 excess life time cancer risk in SFB fish eating humans Yellow : Based on 5% exceedence of the threshold effect concentration
 Black: Based Upperbound estimate of 1:100,000 excess life time cancer risk in SFB fish eating humans Yellow : Based on 5% exceedence of the threshold effect concentration")
21
Bay-wide geometric mean concentrations

22
Conclusions Developed and constructed a food-web bioaccumulation model of PCBs for San Francisco Bay (Excel spreadsheet). Tested the model against empirical field data. Model Bias among species ranged between 0.83 and 1.35 (for PCB congeners) and 0.73 and 1.19 (for PCB). Ideal =1. Range of model predicted BSAFs that include 95% of the observed BSAF values ranges between a factor of 2 to 4 of the mean depending on the species. The model can be used to set Bay-wide target PCB concentrations for the sediment of San Francisco Bay. The model can be further developed to make more spatially explicit calculations of the relationship between PCB concentrations in sediments and biota when information on migrations routes and corresponding sediment concentrations become available.
 and 0.73 and 1.19 (for PCB). Ideal =1. Range of model predicted BSAFs that include 95% of the observed BSAF values ranges between a factor of 2 to 4 of the mean depending on the species. The model can be used to set Bay-wide target PCB concentrations for the sediment of San Francisco Bay. The model can be further developed to make more spatially explicit calculations of the relationship between PCB concentrations in sediments and biota when information on migrations routes and corresponding sediment concentrations become available..")
23
We thank the many people who have helped us to bring all the information together for the development of the model.

24
OrganismCriterion Tissue Concentration SUM PCBs (SFEI) (ug/kg wet weight) % equal or exceed Shiner surfperchHuman Health Risk – 10 -5 Cancer51.981.3 Shiner surfperchHuman Health Risk – Threshold20731.8 JacksmeltHuman Health Risk - 10 -5 Cancer51.926.9 JacksmeltHuman Health Risk – Threshold2072.9 White croakerHuman Health Risk - 10 -5 Cancer51.984.3 White croakerHuman Health Risk – Threshold20736.3 Cormorant EggEcological Risk – LOAEL500017.0 Tern EggEcological Risk – LOAEL400010.3 Female Harbor SealEcological Risk - Threshold Effect473056.4 Male Harbor SealEcological Risk - Threshold Effect473076.3
 (ug/kg wet weight) % equal or exceed Shiner surfperchHuman Health Risk – Cancer Shiner surfperchHuman Health Risk – Threshold JacksmeltHuman Health Risk Cancer JacksmeltHuman Health Risk – Threshold White croakerHuman Health Risk Cancer White croakerHuman Health Risk – Threshold Cormorant EggEcological Risk – LOAEL Tern EggEcological Risk – LOAEL Female Harbor SealEcological Risk - Threshold Effect Male Harbor SealEcological Risk - Threshold Effect")
25
Results: Model Performance Analysis - PCB

26
Model Application Forwards Calculation SFB Food-Web Bioaccumulation Model + =

27
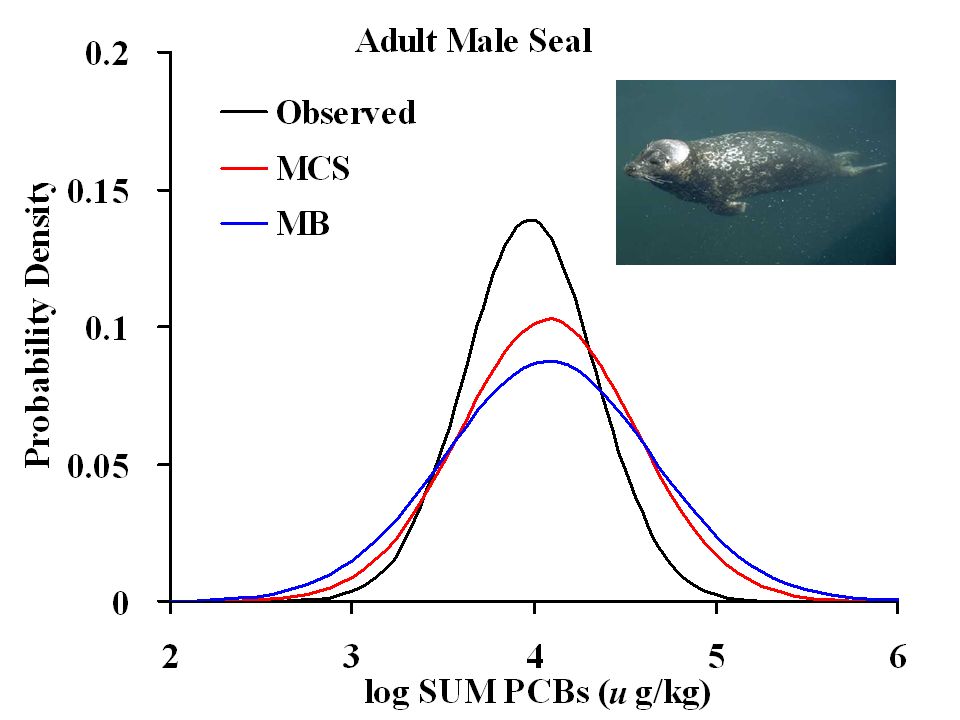
SpeciesNameMB (5 - 95% ile)MB* (5 - 95% ile) California musselsMytilus californianus0.97 (0.24 - 3.96)0.73 (0.38 – 1.41) Pacific oysterCrassostrea gigas0.91 (0.23 - 3.58)0.71 (0.32 – 1.56) Shiner surfperchCymatogaster aggregate1.17 (0.32 - 4.33)0.97 (0.31- 2.98) JacksmeltAtherinopsis californiensis1.14 (0.48 - 2.72)0.95 (0.27- 3.39) White croakerGenyonemus lineatus1.35 (0.38 - 4.84)1.02 (0.39 – 2.64) Double-crested cormorantPhalacrocorax auritus1.19 (0.44 - 3.21)0.85 (0.37 – 1.93) Male harbor sealPhoca vitulina1.05 (0.72 - 1.54)1.19 (0.23 – 6.22) Female harbor sealPhoca vitulina0.87 (0.47 - 1.63)0.79 (0.34 - 1.85) PCB congeners PCB Results: Model Performance Analysis
MB* (5 - 95% ile) California musselsMytilus californianus0.97 ( )0.73 (0.38 – 1.41) Pacific oysterCrassostrea gigas0.91 ( )0.71 (0.32 – 1.56) Shiner surfperchCymatogaster aggregate1.17 ( )0.97 ( ) JacksmeltAtherinopsis californiensis1.14 ( )0.95 ( ) White croakerGenyonemus lineatus1.35 ( )1.02 (0.39 – 2.64) Double-crested cormorantPhalacrocorax auritus1.19 ( )0.85 (0.37 – 1.93) Male harbor sealPhoca vitulina1.05 ( )1.19 (0.23 – 6.22) Female harbor sealPhoca vitulina0.87 ( )0.79 ( ) PCB congeners PCB Results: Model Performance Analysis")
30
Model for uptake, elimination & bioaccumulation of PCBs in organisms other than phytoplankton & algae

31
G w.E w.C w + G d.E d.C d C b = G w.E w + G f.E d + V b (k m +k g ) K bw K bf Model Calculations
 K bw K bf Model Calculations")
32
26% 4% 1.5% 1 0.15 0.058 1 6.5 17.3 Mineralization OCZf Algae,Macro- phytes Suspended solids Bottom sediments

Similar presentations