Download presentation
Presentation is loading. Please wait.

1
The Greenhouse Effect

2
Natural process – Earth’s surface absorbs infrared radiation from Sun. Gases and clouds in the atmosphere trap this energy and radiate it back in all directions. This makes Earth’s avg. temp about +15 o C Without the Greenhouse effect, the Earth would have an avg. temp of -18 o C

4
Some terms: Parts per million (ppm) – a measurement of the concentration of gas (also ppb, and ppt) Anthropogenic – resulting from human influence Pre-Industrial – before the 1800’s Industrial Age
 – a measurement of the concentration of gas (also ppb, and ppt) Anthropogenic – resulting from human influence Pre-Industrial – before the 1800’s Industrial Age")
5
Earth’s Atmosphere: N 2 : 78.08%O 2 : 20.95% Ar:.93%Trace Gases: 0.04%

6
Most atmospheric gases do not absorb radiation (N 2, O 2, Ar, H 2, Ne, Kr) Some gases do, called greenhouse gases (GHG’s): H 2 OCO 2 CH 4 O 3 N 2 O
 Some gases do, called greenhouse gases (GHG’s): H 2 OCO 2 CH 4 O 3 N 2 O")
7
Concentration in atmosphere depends on temp. Causes 2/3 of greenhouse effect Feedback loop: – The warmer the air, the more water vapour the air can hold – The more water vapour the air can hold, the warmer it gets

8
CO 2 concentration is 385ppm – 0.0385% of Earth’s atmosphere Before the Industrial age, it was 280ppm Causes ¼ of greenhouse effect Natural SourcesAnthropogenic Sources Cellular respiration Volcanic eruptions Burning of organic matter (forest fires) Burning fossil fuels Coal-based power plants natural gas heating industrial processes Deforestation
 Burning fossil fuels Coal-based power plants natural gas heating industrial processes Deforestation")
10
Very efficient at absorbing radiation (23x more powerful than CO 2 ) Pre-industrial concentration was 0.700ppm Modern concentration is 1.785ppm (2.55x higher) Natural SourcesAnthropogenic Sources Plant decomposition Animal digestion (cow farts) Natural gas pipelines Rice and cattle farming Decay in landfills and sewage Coal mining Deforestation
 Pre-industrial concentration was 0.700ppm Modern concentration is 1.785ppm (2.55x higher) Natural SourcesAnthropogenic Sources Plant decomposition Animal digestion (cow farts) Natural gas pipelines Rice and cattle farming Decay in landfills and sewage Coal mining Deforestation")
11
Relationship between CO 2 and Temperature Do the temperature and CO 2 lines look similar? Let’s overlap the two lines to make sure.

12
Ozone exists naturally in the stratosphere (20- 60km up), and protects against UV Ozone in troposphere (0-20km up) is a GHG Causes smog in cities
, and protects against UV Ozone in troposphere (0-20km up) is a GHG Causes smog in cities")
13
A scale that tells us how much time in the Sun would cause sunburn on a specific day Index0-3.94.0-6.97.0-8.99.0-up CategoryLowModerateHighExtreme Average time to sunburn > 1 hour~ 30 mins~ 20 mins< 15 minutes

14
300x more effective at absorbing energy than CO 2 Pre-industrial concentration was 270 ppb Modern concentration of 321 ppb (1.2x more) Natural SourcesAnthopogenic Sources Soil and water bacteria Livestock feed and waste Fertilizers Fossil fuels Sewage treatment
 Natural SourcesAnthopogenic Sources Soil and water bacteria Livestock feed and waste Fertilizers Fossil fuels Sewage treatment")
15
GasConcentrationHeat Trapping Ability Anthropogenic Source Preindustrial2008 CFC’s (Chloroflu ro- carbons) Trace251ppt (CFC-11) 525ppt (CFC-12) 1000’s of times greater than CO 2 (Can last more than 50K years) Refrigerants (refrigerators and air conditioners) Sulfur hexafluo ride None7ppt22,800x that of CO 2 (lasts for 3000+ years) Electrical utilities, and magnesium production
 Trace251ppt (CFC-11) 525ppt (CFC-12) 1000’s of times greater than CO 2 (Can last more than 50K years) Refrigerants (refrigerators and air conditioners) Sulfur hexafluo ride None7ppt22,800x that of CO 2 (lasts for years) Electrical utilities, and magnesium production")
16
SOURCES OF ANTHROPOGENIC GHG ’S GHG’s Ranking Activity

17
Sources of GHG’s Work in groups of 3 or 4 (your teacher will assign your groups) Get a package of pictures from your teacher Look over the pictures, and read the captions, and rank them according to which you think will be the greatest and least sources of GHGs Arrange your rankings according to the diagram to the right. Most Second Most Middle Least

18
Walkabout Walk around to other groups, and compare your results to others Copy the following chart into your notes:

19
Producing and Using Energy 324 Transportation 190 Fugitive Emissions 67 Agriculture 62 Industrial Processes 54 Waste Management 21 Land use and Forestry 20 Pg. 390

20
Solutions Brainstorming

23
Why should we worry about the greenhouse effect? Wouldn’t it be great is Canadian winters were warmer, and summers longer?

24
Temperature Change Data 1880-1884

25
1886-1890

26
1896-1900

27
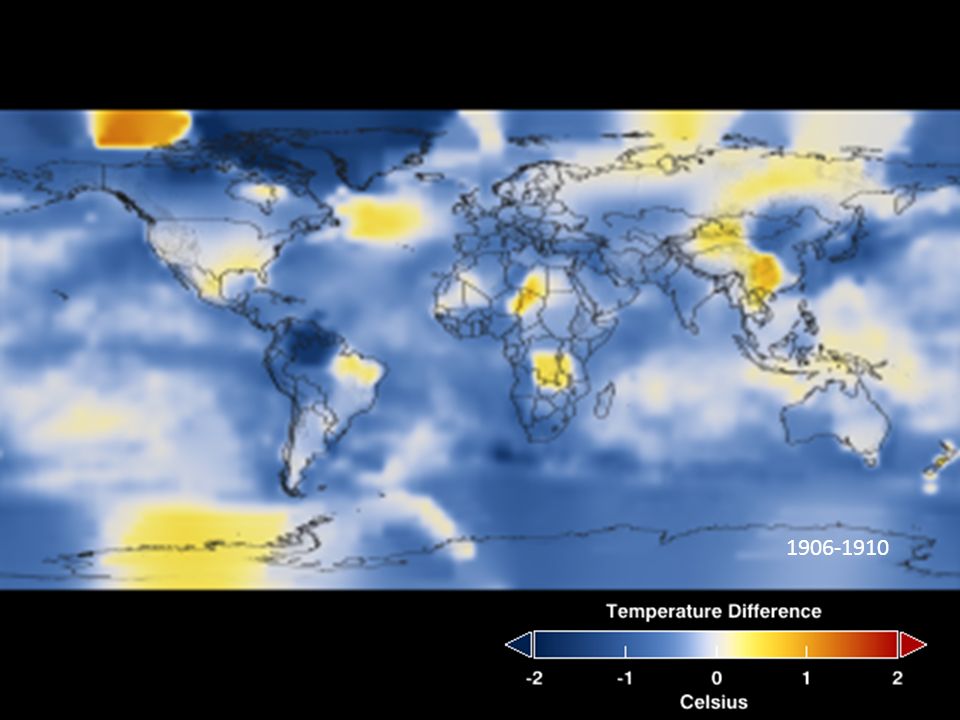
1906-1910
28
1916-1920

29
1926-1930

30
1936-1940

31
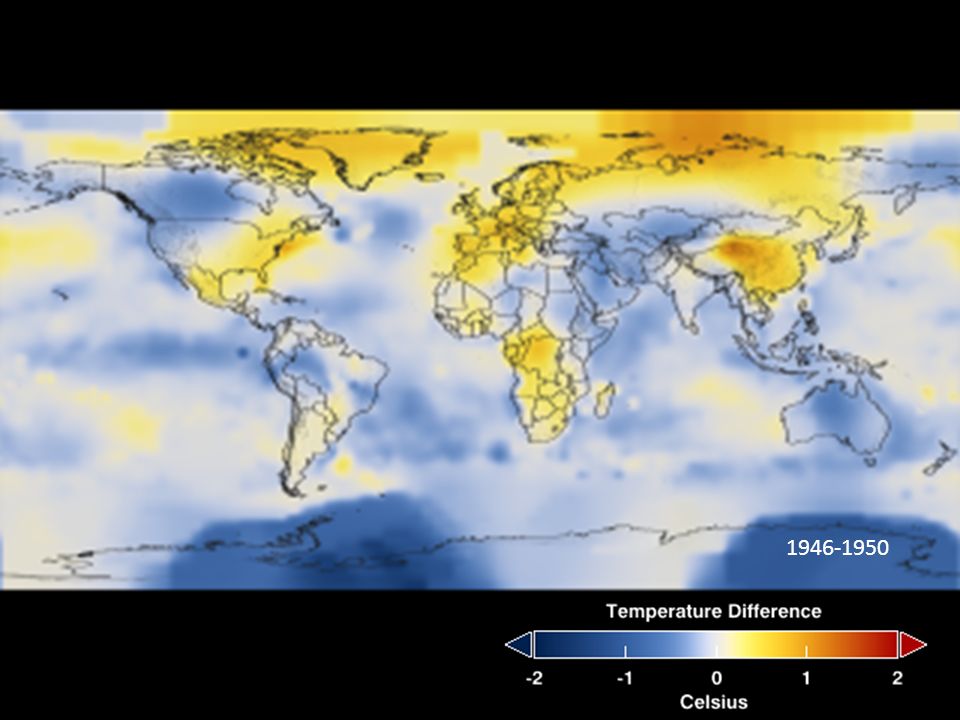
1946-1950
32
1956-1960

33
1966-1970

34
1976-1980

35
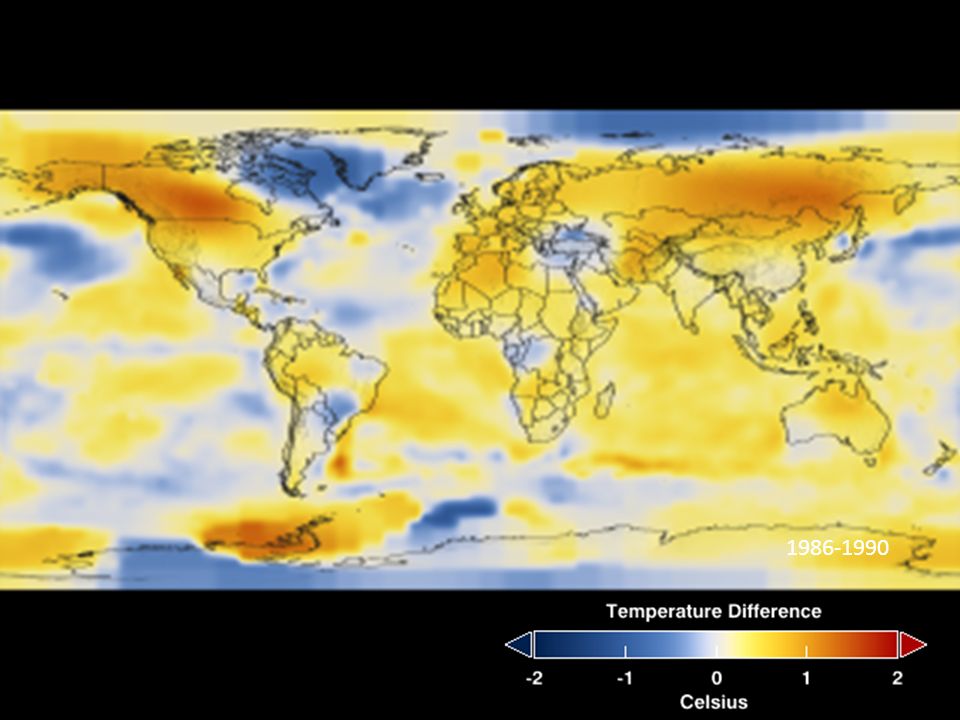
1986-1990
36
1996-2000

37
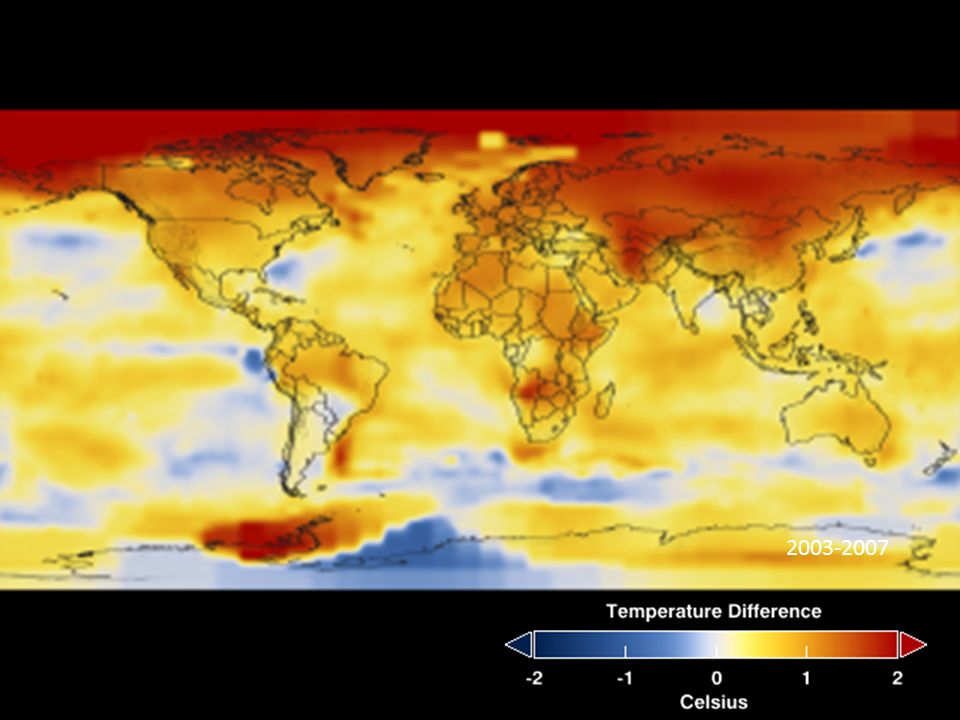
2003-2007
38
Kilimanjaro 1970

39
Kilimanjaro 2000 Ice onKilimanjaro 0 5 10 15 1900192019401960198020002020 Year Area (km 2 )
")
Similar presentations


 trap and store energy and distribute it around the world.>")


