Download presentation
Presentation is loading. Please wait.

1
Harmonization vs. Competition: Fiscal Union vs. Decentralization Free Market Road Show, April 27, 2012

2
Defining the Problem There is no “European” problem. There is no “Eurozone” problem. There is no “Euro” problem. There is a problem of many nations taxing too much and spending too much. This is leading to anemic economic performance. International investors don’t trust some nations to pay thir bills.

3
Making Bad Policy Even Worse Proposals for tax harmonization and/or a fiscal union will exacerbate the problems in Europe. No economic rationale for identical/similar tax rates. No economic rationale for fiscal transfers. Look at the U.S., particularly in the past. Look at Switzerland today.

4
Growth Matters…a Lot

5
Definition of Good Fiscal Policy Government spending should grow slower than nominal GDP. Over time, this reduces burden of public sector. Eliminates risk of higher taxes. Deficits eventually disappear. Debt shrinks as share of GDP. Politicians don’t like this approach since they can’t buy votes with other people’s money.

6
Size of Government Matters…a Lot There is a “Rahn Curve” relationship between government spending and economic growth similar to the “Laffer Curve” relationship between tax rates and tax revenue.

7
Big Government Inevitably…

8
…Erodes a Nation’s Social Capital

9
Demographics Is Fiscal Destiny Ageing populations and welfare states are an unstable combination. Pay-as-you-go systems are Ponzi schemes. Not enough future workers to support redistribution programs. Without reform, massive debt or massive tax increases. Probably both

10
Two Workers per Retiree

11
Increased Burden of Gov’t Spending

12
The Sovereign Debt Crisis Greece was the tip of the iceberg Ireland was phase two. Spain and Portugal phase three. Italy and Belgium phase four. Japan in a special category. Almost all other industrialized nations are on this path. Rare exceptions such as Australia, perhaps Switzerland and even Sweden.

13
Where Is the Debt Tipping Point? Rogoff and Reinhart say 90 percent of GDP is the danger zone. Depends on the nation. Industrialized world has breathing room. Greece got in trouble over 100 percent. Japan still doing fine at 200 percent. Spain and Portugal in trouble at less than 90 percent.

14
France – 400 Percent of GDP

15
Germany – 300-plus Percent of GDP

16
Greece – 400 Percent of GDP

17
Ireland – 300 Percent of GDP

18
Italy – 250 Percent of GDP

19
Netherlands – 400 Percent of GDP

20
Japan – 600 Percent of GDP

21
Portugal – 300 Percent of GDP

22
Spain – 300 Percent of GDP

23
U.K. – 500-plus Percent of GDP

24
U.S. – 450 Percent of GDP

25
Implications for Tax Policy Burden of government spending will increase by at least 10 percentage points of GDP. BIS model shows worse results, driven by interest assumptions. That won’t happen because it means an end to Western civilization. But what will happen? In Europe, some nations will default and leave the euro (so they can inflate).
..")
26
Can Europe Tax to Prosperity? Taxes on personal income averaged 9 percent of GDP as of 2008. VAT rates already average more than 20 percent. Payroll tax rates also very high in most European nations. A reverse of trend of lower corporate rates is almost certain. But…

27
Revenge of the Laffer Curve? Politicians can increase tax rates, but that does not necessarily mean they collect more tax revenue. If economic growth slows, taxable income also slows. If incentives to avoid and evade rise, taxable income slows even more. America conducted a Laffer Curve experiment in the 1980s.

28
Tax Rates, the Rich, and Revenue In 1980, there were 116,800 rich people. Those rich people reported $36.2 billion of income to the IRS. They paid $19.0 billion of income tax to the federal government.

29
Tax Rates, the Rich, and Revenue In 1980, there were 116,800 rich people. Those rich people reported $36.2 billion of income to the IRS. They paid $19.0 billion of income tax to the federal government. By 1988, there were 723,700 rich people. Those rich people reported $353.0 billion of income to the IRS. They paid $99.7 billion of income tax to the federal government.

30
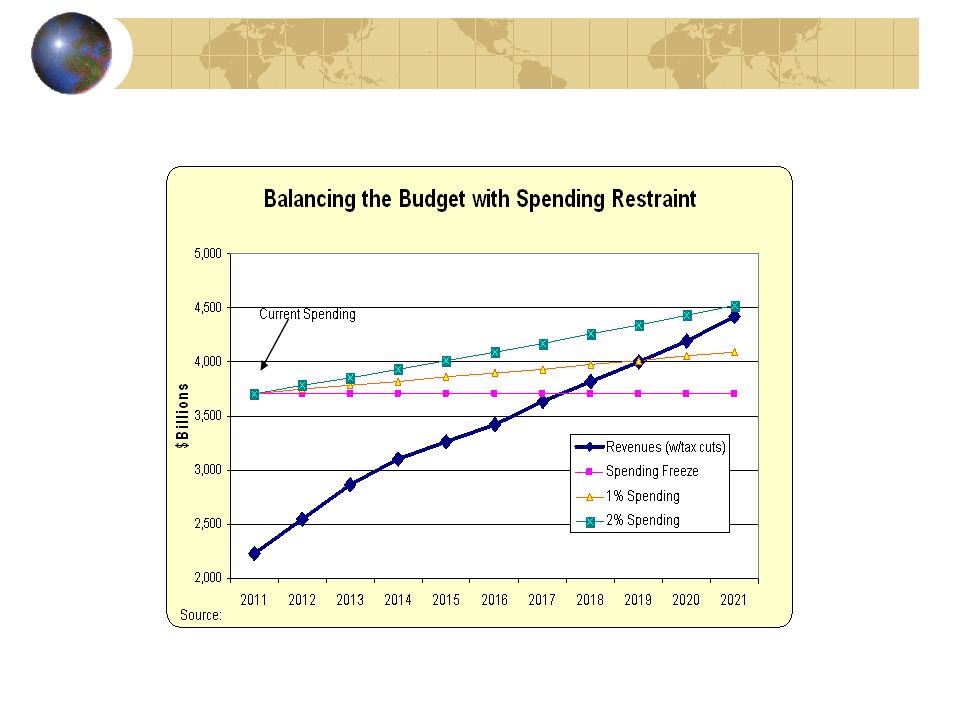
What Should Be Done? The answer is simple – just restrain the growth of spending, as U.S. example shows. If nominal revenue is projected to grow 7 percent each year, as CBO projects, red ink can be reduced if spending grows by a lesser amount. A freeze balances the budget by 2017. Letting spending grow by 2 percent each year means fiscal balance in 2022.

32
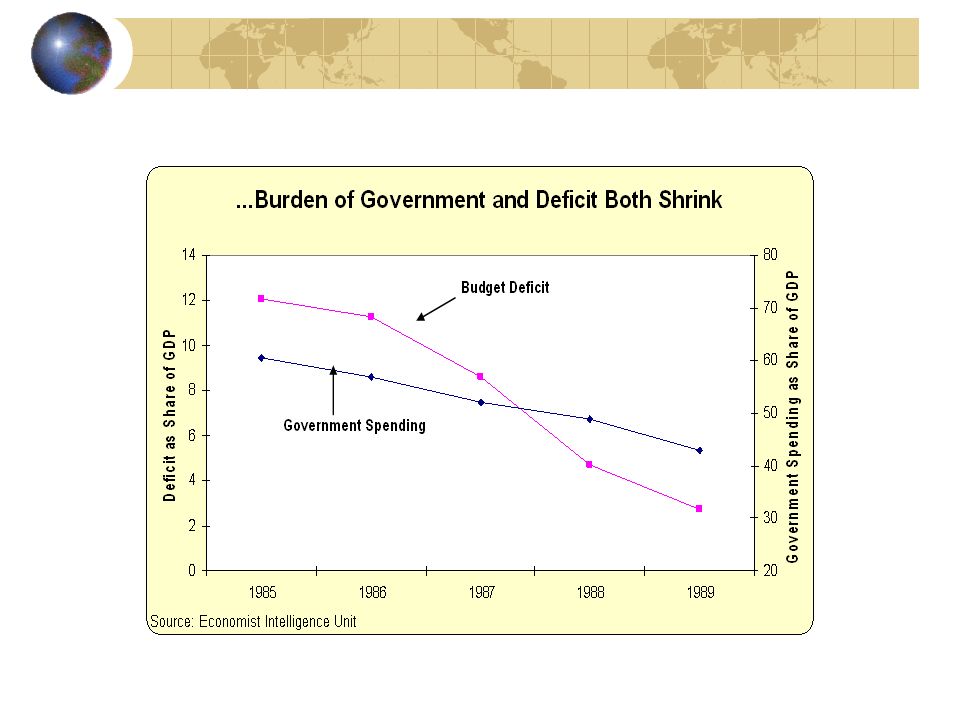
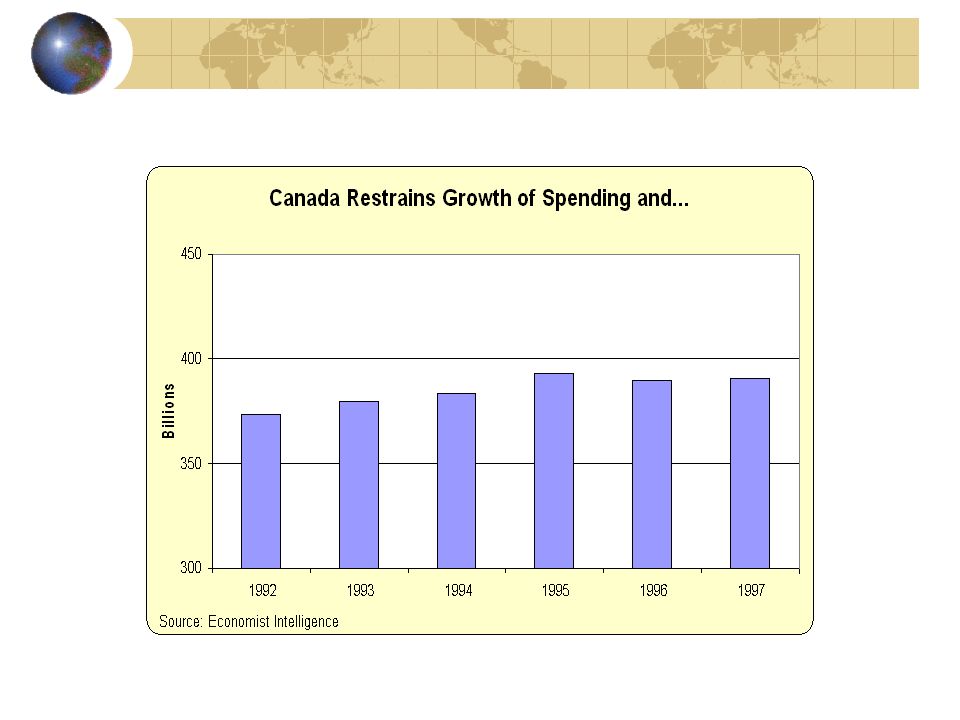
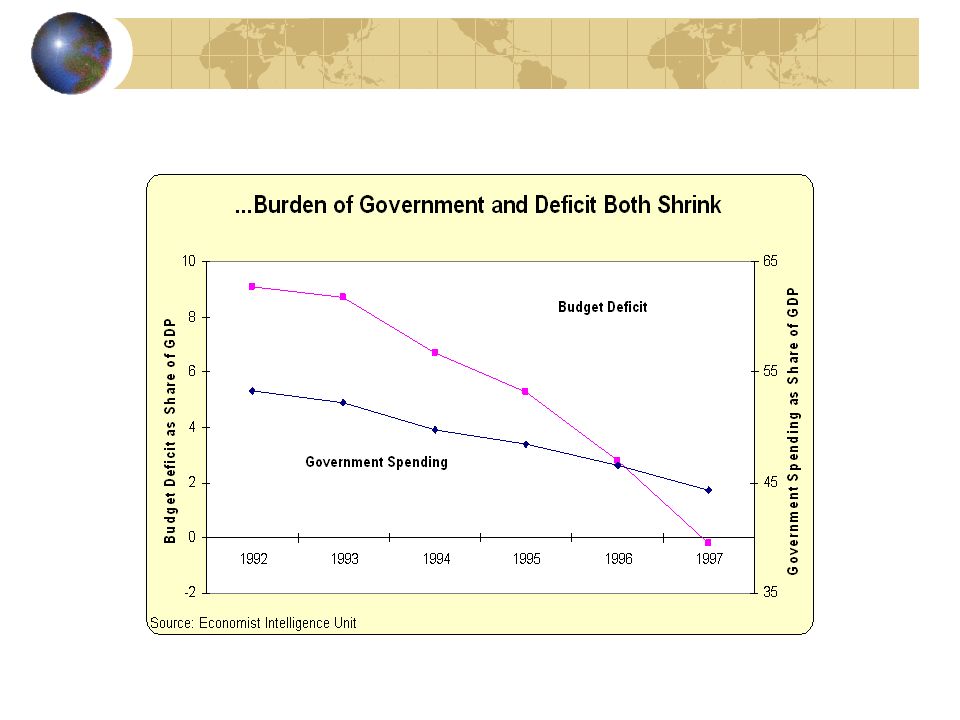
Other Nations Have Reformed Good fiscal policy does not require miracles, just spending restraint. If spending grows slower than nominal GDP, good things happen. Greater levels of fiscal restraint mean quicker progress. If spending grows faster than nominal GDP, sooner or later a nation becomes Greece. But sometimes nations do the right thing.

39
Conclusion Three challenges for Europe Correctly identifying the problem – big government is the disease. Deficits and debt are symptoms. Figuring out ways to “bend the cost curve” of government spending. Convincing voters that liberty is better than dependency – particularly when dependency means fiscal disaster.

Similar presentations


 - $186.5 Billion (2007) Budget Surplus – The amount by which revenues.>")


 DEBT – TOTAL AMOUNT OF BORROWING.>")


