Download presentation
Presentation is loading. Please wait.

1
Hyetograph Models Professor Ke-Sheng Cheng
Dept. of Bioenvironmental Systems Engineering National Taiwan University

2
Introduction The design storm hyetograph, i.e. time distribution of the total storm depth, plays an essential role in water resources planning and stormwater management design. Given a hyetograph model, design storm hyetographs can be developed for locations where sufficient rainfall data are available. For areas without sufficient rainfall data, or for major projects that involve large watershed area, regional hyetographs are necessitated.

3
Hyetograph models The alternating block model The average rank model
The trianglar model SSGM

4
The Alternating Block Model
Calculate the total storm depth D from the IDF relationship Determine the incremental time interval to be used for total rainfall apportionment. The total number of incremental rainfalls of the design storm is Laboratory for Remote Sensing Hydrology and Spatial Modeling Dept. of Bioenvironmental Systems Engineering, National Taiwan University

5
Laboratory for Remote Sensing Hydrology and Spatial Modeling
Calculate the average intensity and total depth of design storms with a fixed return period T but variable durations k=1, 2, …, n-1 Calculate the total rainfall difference between design storms of consecutive durations. Laboratory for Remote Sensing Hydrology and Spatial Modeling Dept. of Bioenvironmental Systems Engineering, National Taiwan University

6
Laboratory for Remote Sensing Hydrology and Spatial Modeling
Form a ranked data series of incremental rainfall depth by ranking the incremental rainfall depth in descending order, i.e., Laboratory for Remote Sensing Hydrology and Spatial Modeling Dept. of Bioenvironmental Systems Engineering, National Taiwan University

7
Laboratory for Remote Sensing Hydrology and Spatial Modeling
Assign to the most central interval, and to its right (or left) and left (or right), respectively. Other remaining incremental rainfalls in the ranked series are sequentially allocated in a similar alternating manner. Laboratory for Remote Sensing Hydrology and Spatial Modeling Dept. of Bioenvironmental Systems Engineering, National Taiwan University
 and left (or right), respectively. Other remaining incremental rainfalls in the ranked series are sequentially allocated in a similar alternating manner. Laboratory for Remote Sensing Hydrology and Spatial Modeling. Dept. of Bioenvironmental Systems Engineering, National Taiwan University.")
8
Laboratory for Remote Sensing Hydrology and Spatial Modeling
Dept. of Bioenvironmental Systems Engineering, National Taiwan University

9
Laboratory for Remote Sensing Hydrology and Spatial Modeling
The Average Rank Model Pilgrim and Cordery (1975) Gather rainfall data of several largest storms of a pre-specified duration. The pre-specified duration is divided into a number of equal time intervals, which are usually determined by considering the minimum time period of the subsequent rainfall-runoff modeling. Laboratory for Remote Sensing Hydrology and Spatial Modeling Dept. of Bioenvironmental Systems Engineering, National Taiwan University
 Gather rainfall data of several largest storms of a pre-specified duration. The pre-specified duration is divided into a number of equal time intervals, which are usually determined by considering the minimum time period of the subsequent rainfall-runoff modeling. Laboratory for Remote Sensing Hydrology and Spatial Modeling. Dept. of Bioenvironmental Systems Engineering, National Taiwan University.")
10
Laboratory for Remote Sensing Hydrology and Spatial Modeling
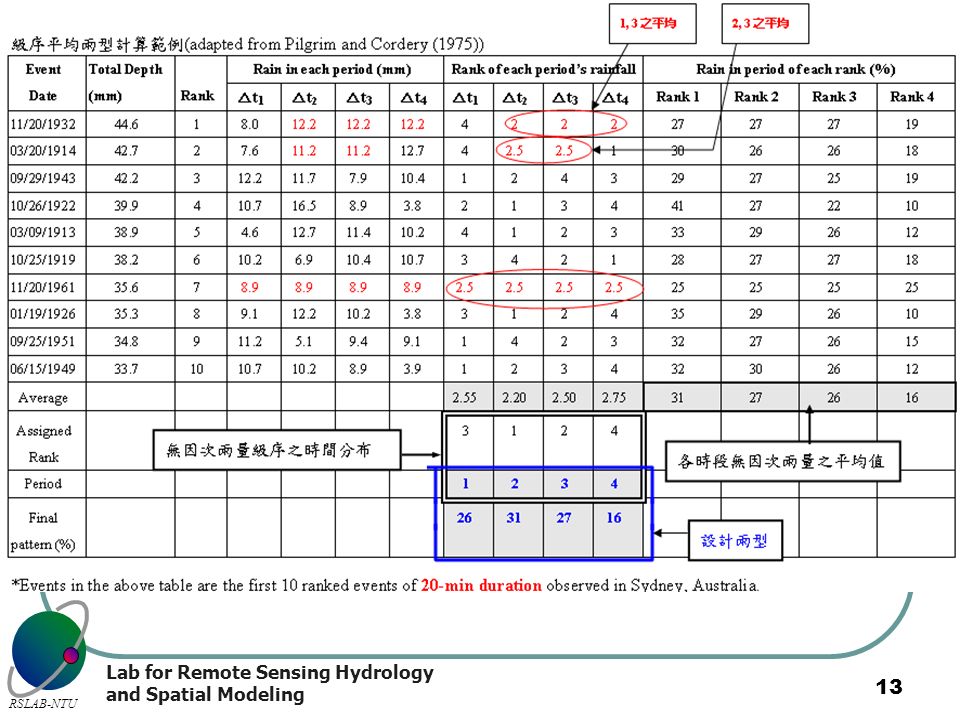
Rank time intervals for each event according to the rainfall depth in each interval. The average ranking for each time interval is calculated using all events. Average rankings are likely to be non-integer and are used to give an assigned rank to each time interval. Laboratory for Remote Sensing Hydrology and Spatial Modeling Dept. of Bioenvironmental Systems Engineering, National Taiwan University

11
Laboratory for Remote Sensing Hydrology and Spatial Modeling
Determine the percentage of total rainfall for each event in each of the ranked time interval for that event. Average rainfall percentages for time intervals of rank 1, 2, 3,… for all events are calculated. Assign the average rainfall percentage of each rank to time interval of the same assigned rank. Laboratory for Remote Sensing Hydrology and Spatial Modeling Dept. of Bioenvironmental Systems Engineering, National Taiwan University

12
Laboratory for Remote Sensing Hydrology and Spatial Modeling
The average rank model is duration-specific and requires rainfall data of storm events of the same pre-specified duration. Since storm duration varies significantly, it may be difficult to gather enough storm events of the same duration. Laboratory for Remote Sensing Hydrology and Spatial Modeling Dept. of Bioenvironmental Systems Engineering, National Taiwan University

14
The Triangular Hyetograph Model
Yen and Chow (1980) It incorporates a key parameter of storm advancement coefficient to determine the time-to-peak of the design storm hyetograph. Laboratory for Remote Sensing Hydrology and Spatial Modeling Dept. of Bioenvironmental Systems Engineering, National Taiwan University
 It incorporates a key parameter of storm advancement coefficient to determine the time-to-peak of the design storm hyetograph. Laboratory for Remote Sensing Hydrology and Spatial Modeling. Dept. of Bioenvironmental Systems Engineering, National Taiwan University.")
15
Laboratory for Remote Sensing Hydrology and Spatial Modeling
Selection of representative storm events. For a historic storm event of duration tr, incremental time interval , and total depth D, its storm advancement coefficient r is determined by the following equations: Laboratory for Remote Sensing Hydrology and Spatial Modeling Dept. of Bioenvironmental Systems Engineering, National Taiwan University

16
Laboratory for Remote Sensing Hydrology and Spatial Modeling
The mass center of the storm rainfall locates at time Storm advancement coefficient r is event-specific and the average storm advancement coefficient of the raingauge site is the arithmetic mean of the event-specific advancement coefficients, i.e. Laboratory for Remote Sensing Hydrology and Spatial Modeling Dept. of Bioenvironmental Systems Engineering, National Taiwan University

17
Laboratory for Remote Sensing Hydrology and Spatial Modeling
The time-to-peak tp and peak rainfall intensity ip of the design storm hyetograph are determined as Since the time-to-peak tp does not exceed the storm duration tr, it yields that Laboratory for Remote Sensing Hydrology and Spatial Modeling Dept. of Bioenvironmental Systems Engineering, National Taiwan University

18
Laboratory for Remote Sensing Hydrology and Spatial Modeling
The peak rainfall intensity depends only on the total depth and storm duration, therefore; all sites with the same total depth of a given duration will have exactly the same peak rainfall intensity, regardless of their difference in time-to-peak tp. Laboratory for Remote Sensing Hydrology and Spatial Modeling Dept. of Bioenvironmental Systems Engineering, National Taiwan University

19
Laboratory for Remote Sensing Hydrology and Spatial Modeling
Dept. of Bioenvironmental Systems Engineering, National Taiwan University

Similar presentations
>")

>")


>")
>")


 Prof. Ke-Sheng Cheng Dept.>")


