Download presentation
Presentation is loading. Please wait.

1
Dr. Lev Manovich Director, Software Studies Initiative, Calit2 + UCSD Professor, Visual Arts Department email: manovich@ucsd.edu personal web site: www.manovich.net personal blog: databeautiful.netmanovich@ucsd.eduwww.manovich.net Software Studies Initiative: softwarestudies.com You can also contact me on Facebook, Myspace, Flickr, and Youtube (although using manovich@ucsd.edu will result in a quicker response).manovich@ucsd.edu You can follow the development of Cultural Analytics at softwarestudies.comsoftwarestudies.com Cultural Analytics: case studies (fall 2008 - spring 2009)
.")
2
you can find all material in this presentation at softwarestudies.com

3
Our research is made possible by the support from: California Institute for Telecommunication and Information (Calit2), UCSD Division Center for Research in Computing and the Arts (CRCA) UCSD UCSD Visual Arts Department UCDARnet UCHRI NEH Office of Digital Humanities Singapore Ministry of Education
, UCSD Division Center for Research in Computing and the Arts (CRCA) UCSD UCSD Visual Arts Department UCDARnet UCHRI NEH Office of Digital Humanities Singapore Ministry of Education")
4
Software Studies Initiative Researchers: Lev Manovich | Director Noah Wardrip-Fruin | Associate Director Jeremy Douglass | Postdoctoral Researcher Cicero Silva | Software Studies Brazil William Huber | Researcher | PhD student, UCSD Chanda Carey | Researcher | PhD student, UCSD Daniel Rehn | Researcher | MFA student, UCSD

5
Software Studies Initiative Collaborators: Yuri Tsivian, Department of Art History, University of Chicago: cinemetrics.lv | film analysis Adele Eisenstein: Digital Formalism project (Department for Theatre, Film and Media Studies (TFM), Vienna University; the Austrian Film Museum; Interactive Media Systems Group, Vienna University of Technology) | film analysis Isabel Galhano Rodrigues, University of Porto, Portugal | gesture analysis David Kirsh, Cognitive Science, UCSD | dance video analysis Jim Hollan, Cognitive Science, UCSD | visualization | cultural analytics software Falko Kuester, Structural Engineering, UCSD + Calit2 | visualization | cultural analytics software Yoav Freund, Computer Science and Engineering, UCSD | machine vision | cultural analytics software Kay OHalloran, Multimodal Analysis Lab, National University of Singapore | Mapping Asian Cultures project Giorgos Cheliotis: Communication and New Media, National University of Singapore | Mapping Asian Cultures project Matthew Fuller: Goldsmiths College, University of London | software studies Benjamin H. Bratton: Visual Arts, UCSD + Calit2 | software studies

6
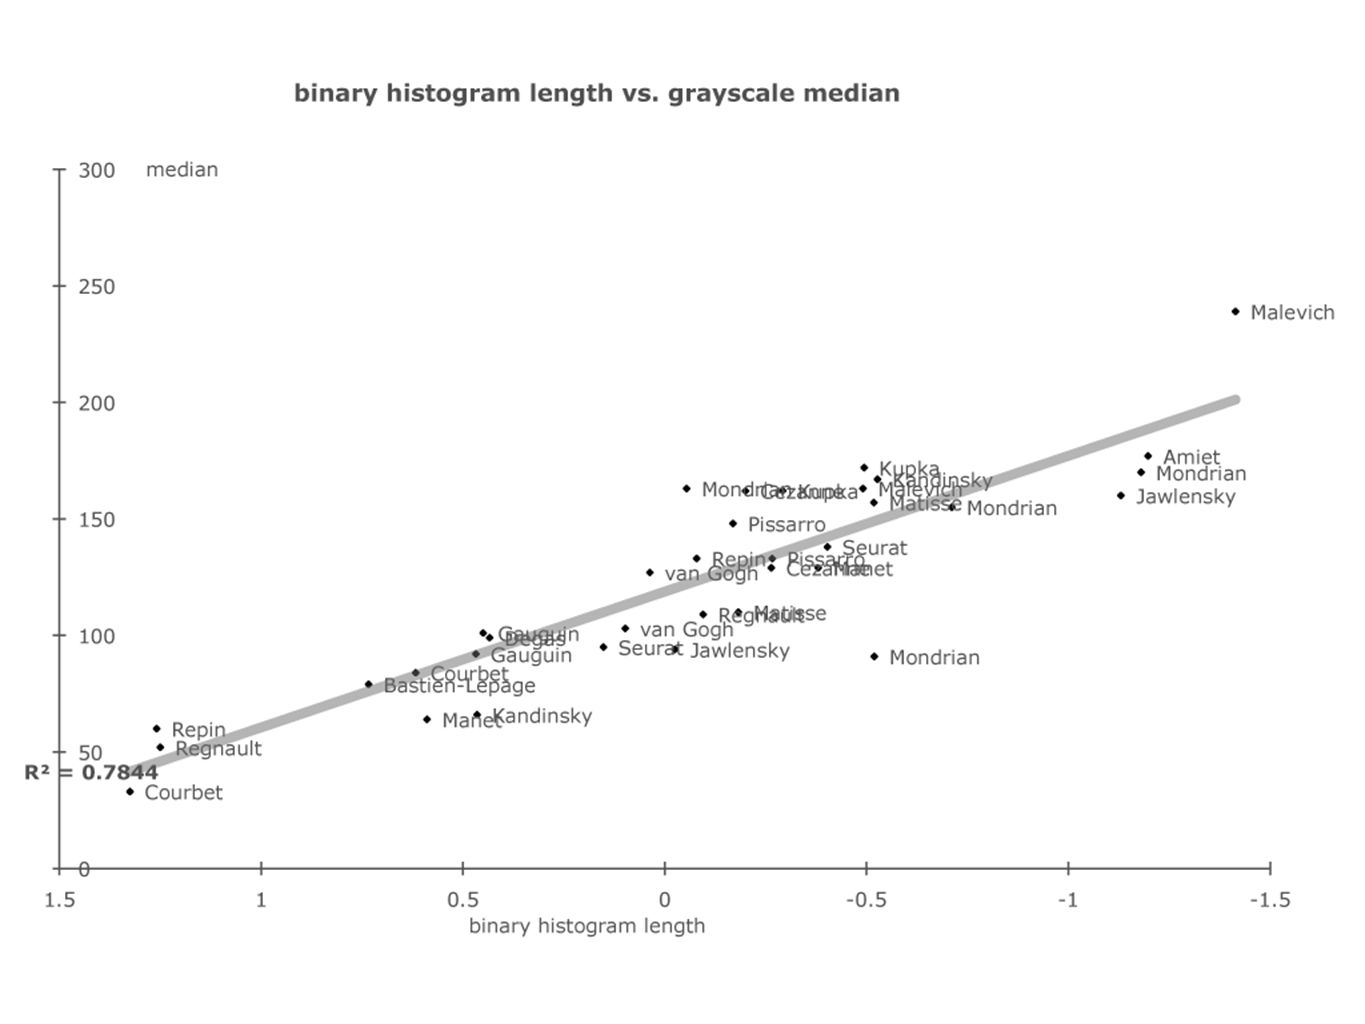
MICRO view - visual art data: 25 canonical paintings representing transition from realism to modernism,1849- 1916

19
MICRO view - visual art data: 165 paintings by Mark Rothko, 1934-1970

28
MICRO view - video games data: screen capture of a game session. game: Knights of the Old Republic

30
MICRO view - time-based media data: cartoons, music videos, motion graphics, films.

32
Comparative visualization: Betty Boop cartoon (left) vs. music videos (center and right)
 vs. music videos (center and right)")
33
Comparative visualization: Betty Boob cartoon (top) vs. music videos (center and bottom). X axis = time. Y axis = brightness mean.
. X axis = time. Y axis = brightness mean..")
34
MICRO view - feature film data: Dziga Vertov, A Man With a Movie Camera (1929. video file: archive.org

37
distribution of particular shot type over time. Each bar corresponds to one shot. Bar height = shot length.

38
Distribution of shot types over time. Bar width = shot length. Top: whole film. Bottom: close-up of the visualization.

39
Distribution of shot types over time. Left: close-up of the visualization. Top: larger view (part of the film)
.")
40
Is a shot the most important unit of a film? X axis = time. Y axis = brightness mean. Vertical bar = shot boundaries.

41
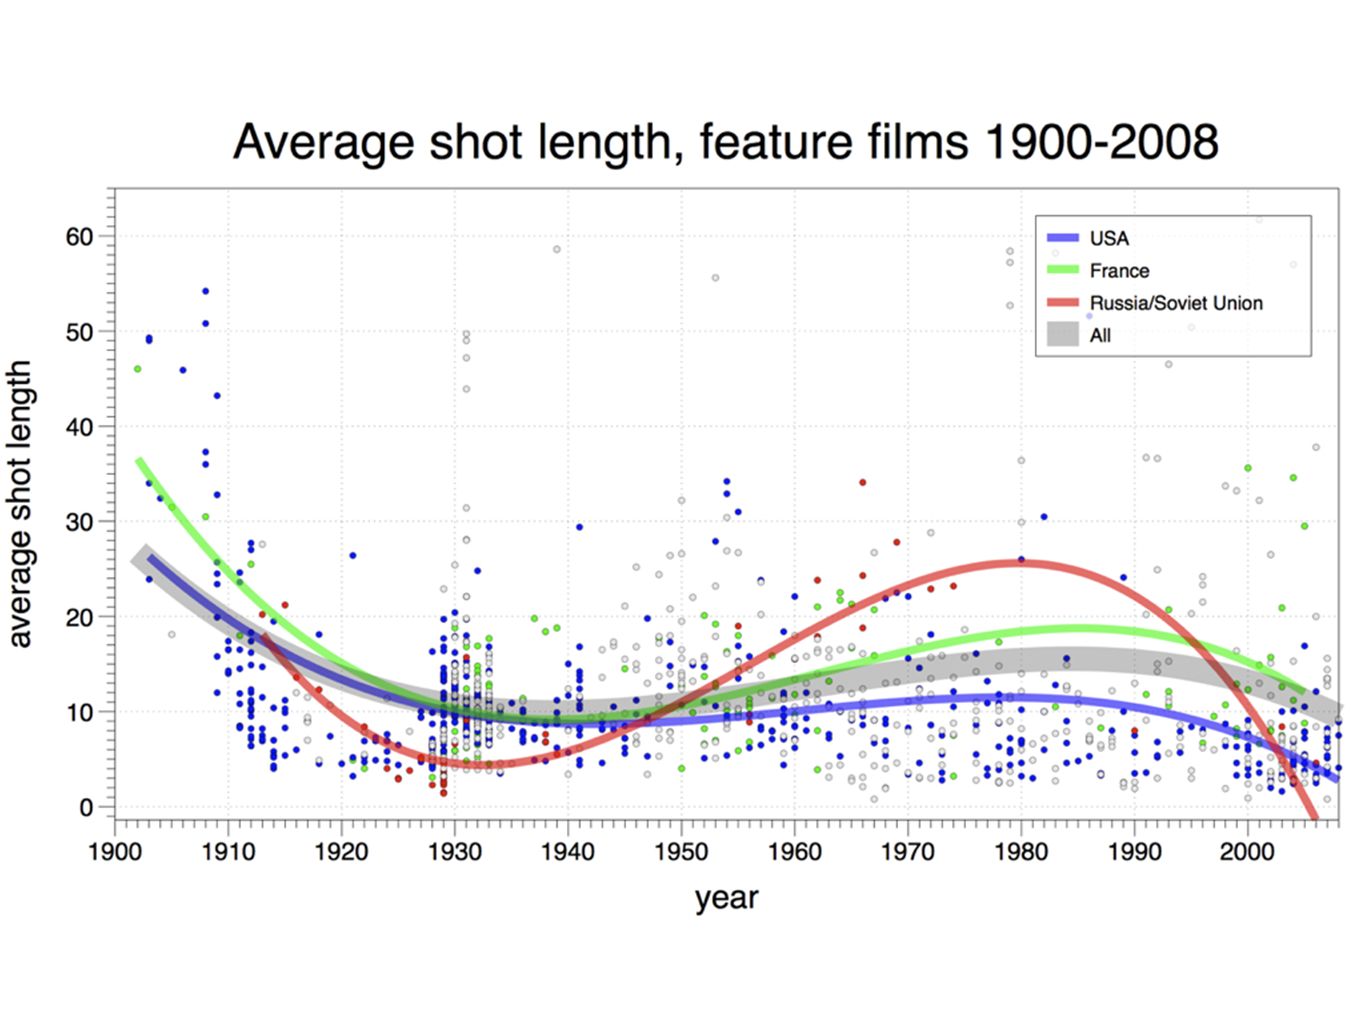
MACRO view - cinema data: average shot length stats on 1100+ feature films from cinemetrics.lv

44
MACRO view - television data: major USA TV network news. 2 shows per year, 1960-2008.

Similar presentations


 2 Buildings Will Begin Construction Later This Year Will Create New Laboratory Facilities –Clean Rooms for Nanotech and BioMEMS –Computer.>")


 Location: Los Angeles Convention Center, CA Dates: February 22-25 2012 LITHICS VISUALIZATION PROJECT Session.>")


