Download presentation
Presentation is loading. Please wait.

1
Global Warming and Climate Change
“We are embarked on the most colossal ecological experiment of all time-doubling the concentration in the atmosphere of an entire planet of one of its most important gases – and we really have no idea of what might happen.” Paul A. Colinvaux

2
Key Points How has the earth’s climate changed in the past?
How may it change in the future? What factors can affect changes in the average temperature? What are the possible side effects of a warmer earth? What can we do to slow or adapt to global climate change?

3
18-1: Past Climate Change and the Natural Greenhouse Effect
Average temperature over past 900,000 years Thousands of years ago 900 800 700 600 500 400 300 200 100 Present Average surface tem perature (°C) 9 10 11 12 13 14 15 16 17 Over the past 900,000 years there have been time periods of cooling and warming For the past 10,000 years we have had the good fortune of a stable climate Average surface temperature (°C) Average temperature over past 130 years Year 1860 1880 1900 1920 1940 1960 1980 2000 2020 13.6 13.8 14.0 14.2 14.4 14.6 14.8 15.0
 Over the past 900,000 years there have been time periods of cooling and warming. For the past 10,000 years we have had the good fortune of a stable climate. Average surface temperature (°C) Average temperature over past 130 years. Year")
4
What is the Greenhouse Effect
For the earth to maintain a constant temperature incoming solar energy must be balanced by an equal amount of outgoing energy Greenhouse Effect: gases warm the lower atmosphere by absorbing some of the infrared radiation radiated from the earths surface.

5
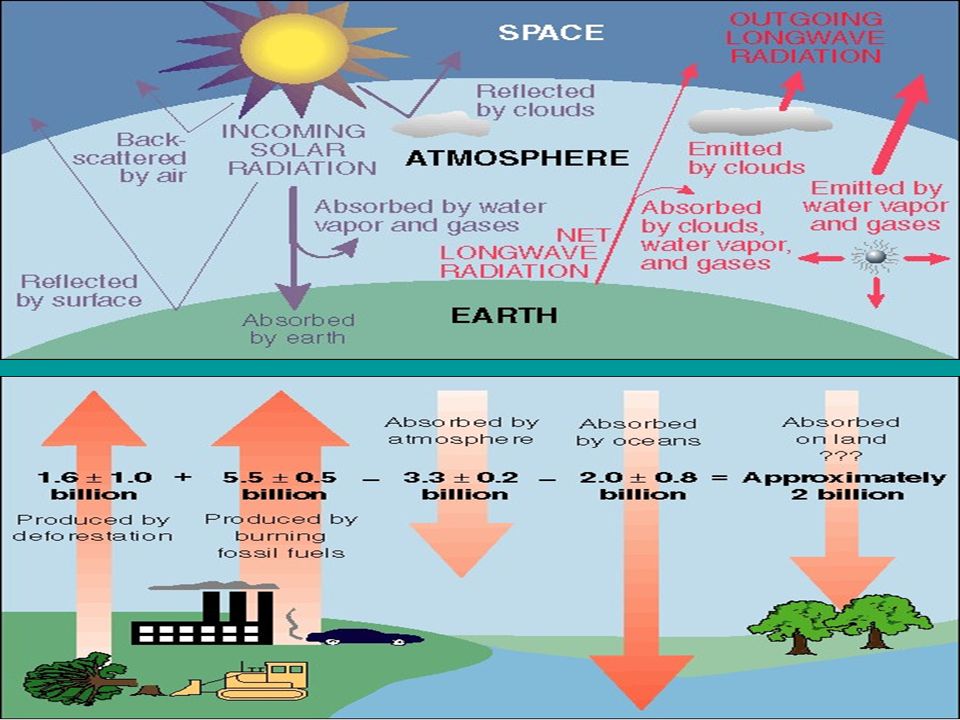
The Natural Greenhouse Effect
Rays of sunlight penetrate the lower atmosphere and warm the earth's surface. The earth's surface absorbs much of the incoming solar radiation and degrades it to longer-wavelength infrared radiation (heat), which rises into the lower atmosphere. Some of this heat escapes into space and some is absorbed by molecules of greenhouse gases and emitted as infrared radiation, which warms the lower atmosphere. As concentrations of greenhouse gases rise, their molecules absorb and emit more infrared radiation, which adds more heat to the lower atmosphere. (a) (b) (c) Fig. 6.13, p. 128
, which rises into the lower atmosphere. Some of this heat escapes into space and some is absorbed by molecules of greenhouse gases and emitted as infrared radiation, which warms the lower atmosphere. As concentrations of greenhouse. gases rise, their molecules absorb and emit more infrared radiation, which adds more heat to the. lower atmosphere. (a) (b) (c) Fig. 6.13, p")
6
Not a Real Greenhouse In a real greenhouse the air heats up because it can’t escape by convection to outside air In reality heat is released and spread through the atmosphere by convection Actual effect: Tropospheric heating effect

7
The Role of the Greenhouse Effect (GHE)
Discovered in 1896 With no GHE the earth would be too cold If the GHE acted by itself the average surface temperature would be 130o F Natural cooling takes place by: Releasing heat through evaporation Water vapor molecules rise to the clouds and release heat into the upper atmosphere Actual average temperature: 59o F

8
Primary Greenhouse Gases
Water Vapor: Controlled by the hydrologic cycle Carbon Dioxide: Controlled by the carbon cycle Evaluation of ancient glacial ice reveals: Water vapor levels have been relatively constant over the past 160,000 years Carbon dioxide levels have fluctuated Fluctuations in global carbon dioxide levels correspond with the fluctuation of the global temperature Year 1860 1880 1900 1920 1940 1960 1980 2000 2010 -0.2 0.0 0.2 0.4 0.6 0.8 1.0 1.2 Observed Model of greenhouse gases + aerosols + solar output Temperature change (°C) from 1980–99 mean
 from 1980–99 mean.")
9
Climate Change and Human Activities
Since the Industrial Revolution (1750) there has been a sharp rise in: Use of fossil fuels Deforestation and burning grasslands to raise crops Cultivating rice and using fertilizer that releases N2O
 there has been a sharp rise in: Use of fossil fuels. Deforestation and burning grasslands to raise crops. Cultivating rice and using fertilizer that releases N2O.")
10
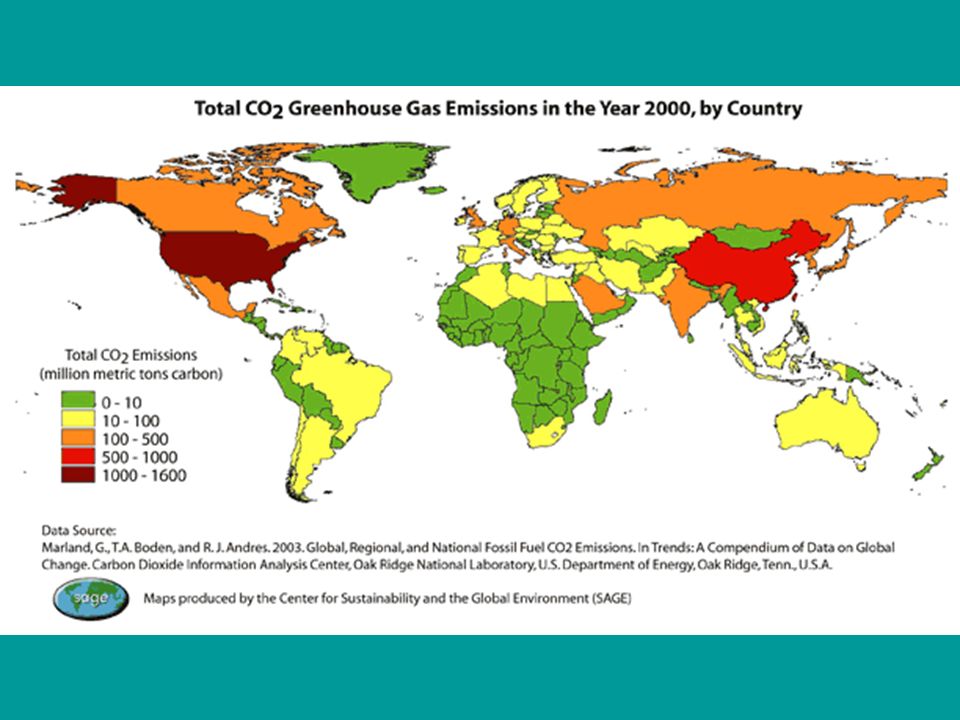
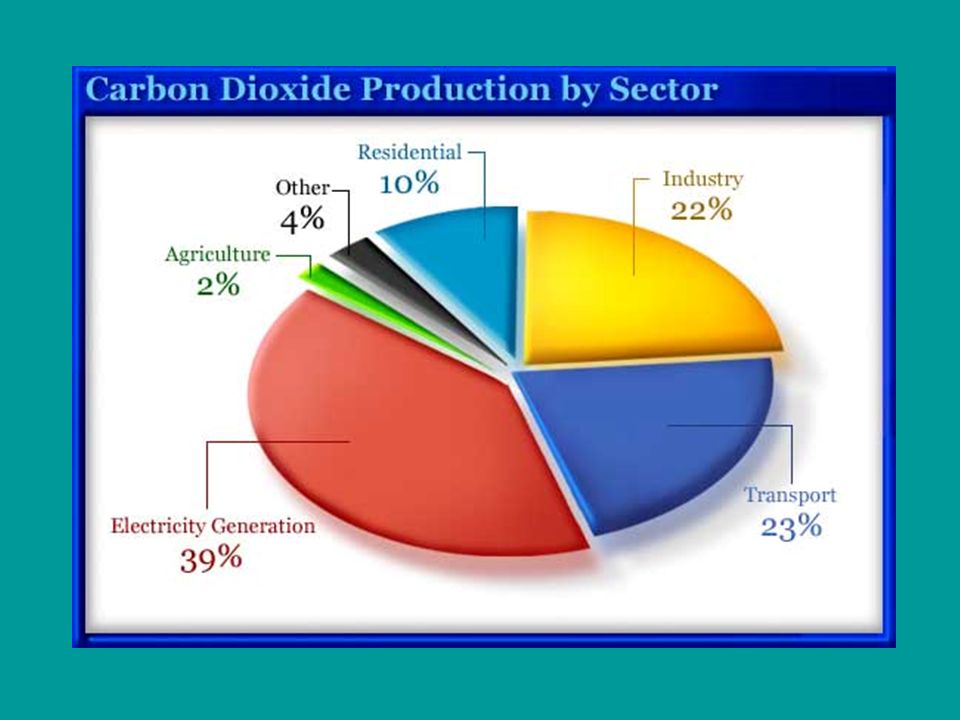
Largest Contributors to CO2 Emissions
Thousands of Coal Burning power and industrial plants 700 million gasoline burning motor vehicles (555 million of them are cars) Emissions from US factories and power plants produce more CO2 than the combination of 146 nations (75% of the world population)
 Emissions from US factories and power plants produce more CO2 than the combination of 146 nations (75% of the world population)")
12
The role of additional CO2 in the Atmosphere:
Most climate scientists believe that the increased input of CO2 will… Enhance the earth’s natural greenhouse effect Raise the average global temperature of the atmosphere near the surface of the earth “GLOBAL WARMING”

17
Are we experiencing Global Warming?
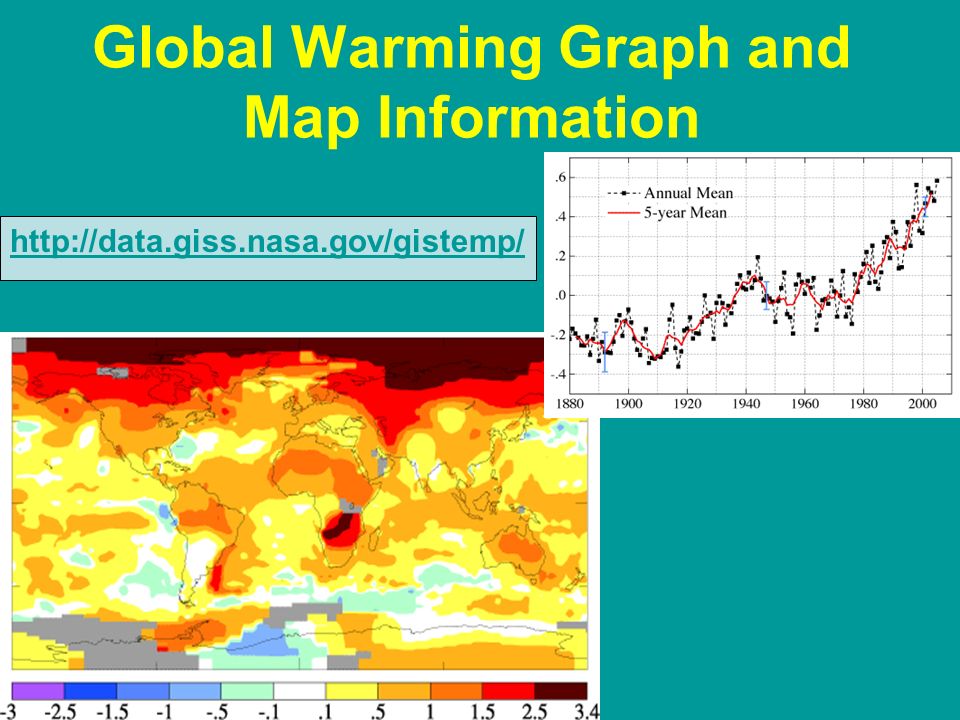
The following facts are based on analysis of ice cores, temperature measurements in hundreds of boreholes into the earths surface and atmospheric temperature measurements CO2 concentrations are at their highest level in the past 20 million years 75% of human caused CO2 emissions are from the burning of fossil fuels The 20th century is the hottest in the past 1000 years Since 1861 the global temperature has risen 1.1 – 0.4o F 10 hottest years on record have occurred since 1990

18
Global Warming Graph and Map Information
19
Carbon dioxide Methane Nitrous oxide 250 200 Index (1900 = 100) 150
1990 2000 2025 2050 2075 2100 Fig. 18.5, p. 451 Year

20
Evidence of a Warmer Troposphere
Melting of land based ice caps and floating ice at the poles and Greenland Shrinking of glaciers Average sea level rise of 4-8” over the past 100 years Northward migration of some fish, tree and other species to find an optimal temperature Early spring arrival and late autumn frosts

21
The Effect of Global Warming on Glacier National Park
1911 2000

22
Argentina's Upsala Glacier was once the biggest in South America, but it is now disappearing at a rate of 200 meters per year. The image on the left is from an 1859 etching of the Rhone glacier in Valais, Switzerland, and shows ice filling the valley. In 2001, the glacier had shrunk by some 2.5km, and its 'snout' had shifted about 450 meters higher up.

23
Rising tides Some scientists predict that a warmer climate will trigger more violent storms, which will cause increased rates of coastal erosion. This is a section of shoreline at Cape Hatteras in North Carolina in the USA, pictured in 1999 and The southern United States and Caribbean region were battered by a series of powerful hurricanes last year. The Intergovernmental Panel on Climate Change (IPCC), a consortium of several thousand independent scientists, predicts that sea levels could rise by between 9 and 88cm in the next century. This would threaten low-lying islands such as Tuvalu in the Pacific. These images, taken this year, show the effects of a higher than usual tide.
, a consortium of several thousand independent scientists, predicts that sea levels could rise by between 9 and 88cm in the next century. This would threaten low-lying islands such as Tuvalu in the Pacific. These images, taken this year, show the effects of a higher than usual tide.")
24
As the climate warms up, mountainous regions may experience lower levels of snowfall. This image shows Mount Hood in Oregon at the same time in late summer in 1985 and 2002. More pests Tree-eating wood beetles are likely to benefit from a warmer climate and reproduce in ever-increasing numbers. These images show damage to White Spruce trees in Alaska caused by the pests.

25
Temperature change (°C) from 1980–99 mean
1.2 Observed 1.0 Model of greenhouse gases + aerosols + solar output 0.8 0.6 Temperature change (°C) from 1980–99 mean 0.4 0.2 0.0 -0.2 1860 1880 1900 1920 1940 1960 1980 2000 2010 Year Fig. 18.7, p. 453
 from 1980–99 mean Year. Fig. 18.7, p")
26
What do the changes in climate mean for humans?
Affects the availability of water resources by altering rates of evaporation and precipitation Shift areas where crops can be grown Change average sea levels Alter the structure and location of the world’s biomes

28
Change in temperature (ºC)
6.0 5.5 5.0 4.5 4.0 3.5 3.0 Change in temperature (ºC) 2.5 2.0 1.5 1.0 0.5 1850 1875 1900 1925 1950 1975 2000 2025 2050 2075 2100 Fig. 18.8, p. 453 Year
 Fig. 18.8, p Year.")
29
CASE STUDY: Early Warnings from the Arctic
The poles are heating faster than the rest of the earth The ice in the Arctic Sea is large enough to cover the USA and is sensitive to air temperatures Temperatures in the Arctic have increased much faster than the average global temperature The light color of ice reflects 80% of the sunlight, if it melts the ocean will be dark and absorb 80%

30
What will happen if the Arctic Ice Melts?
Greatly amplify warming of the Arctic region Reroute warm ocean currents Could cause significant cooling in parts of the northern hemisphere Especially bad cooling in Europe and Eastern North America Tundra soil has warmed up so much that it is releasing more CO2 than it is taking in

32
Case Study: News from Antarctica and Greenland
Antarctica has 70% of the worlds fresh water and 90% of the reflective ice Since 1947 the temperatures have increased 10oF in the winter and 4.5oF in the summer. Ice the size of Delaware have broken off Ice melting off the continent adds to the water volume to raise sea levels

33
Problems in Greenland The worlds largest island (3x the size of Texas)
If the glaciers melt as they did 110, ,000 years ago: Average sea levels would rise feet Massive flooding in the low lying coastal areas and cities Could shut down the Gulf Stream and North Atlantic Current which keep Europe warmer than it naturally would be

34
This has nothing to do with global warming!!!
35
Cell Clouds Land Continent Ocean
Fig. 18.6, p. 452

36
Clouds 50–55% Snow 80–90% City 10–15% Forest 5% Grass 15–25%
Bare sand 30–60% Oceans 5% Fig. 18.9, p. 454

37
present sea level (meters)
Today’s sea level Height below present sea level (feet) present sea level (meters) Height above or below –130 –426 250,000 200,000 150,000 100,000 50,000 Years before present Present Fig , p. 456
 present sea level (meters) Height above or below. –130. – , , , , ,000. Years before present. Present. Fig , p")
38
Sea Level and Coastal Areas
Agriculture Water Resources Forests Shifts in food-growing areas Changes in crop yields Increased irrigation demands Increased pests, crop diseases, and weeds in warmer areas Changes in water supply Decreased water quality Increased drought Increased flooding Changes in forest composition and locations Disappearance of some forests Increased fires from drying Loss of wildlife habitat and species Biodiversity Sea Level and Coastal Areas Rising sea levels Flooding of low-lying islands and coastal cities Flooding of coastal estuaries, wetlands, and coral reefs Beach erosion Disruption of coastal fisheries Contamination of coastal aquifiers with salt water Extinction of some plant and animal species Loss of habitats Disruption of aquatic life Weather Extremes Human Health Human Population Increased deaths from heat and disease Disruption of food and water supplies Spread of tropical diseases to temperate areas Increased respiratory disease Increased water pollution from coastal flooding Prolonged heat waves and droughts Increased flooding More intense hurricanes, typhoons, tornadoes, and violent storms Increased deaths More environmental refugees Increased migration Fig , p. 458

39
Present range Future range Overlap Fig , p. 459

40
Prevention Cleanup Cut fossil fuel use (especially coal) Remove CO2
from smokestack and vehicle emissions Shift from coal to natural gas Transfer energy efficiency and renewable energy technologies to developing countries Store (sequester CO2 by planting trees) Sequester CO2 underground Improve energy efficiency Sequester CO2 in soil Shift to renewable energy resources Sequester CO2 in deep ocean Reduce deforestation Use sustainable agriculture Slow population growth Fig , p. 461
 Sequester CO2. underground. Improve energy. efficiency. Sequester CO2. in soil. Shift to. renewable. energy resources. Sequester CO2. in deep ocean. Reduce. deforestation. Use sustainable. agriculture. Slow population. growth. Fig , p")
41
Develop crops that need less water Waste less water
Move hazardous material storage tanks away from coast Prohibit new construction on low-lying coastal areas Stockpile 1 to 5 year supply of key foods Expand existing wildlife reserves toward poles Connect wildlife reserves with corridors Fig , p. 465

42
Scientific Consensus About Future Climate Change and its Effects
“Most of the global warming experienced over the past 50 years is the result of human activity” 90-95% chance the average global temperature will rise oF over the next 100 yrs. The average sea level will rise by 35” by the end of the century

43
The Role of Ice in Global Warming
The Ice Albedo Feedback System: As the ice melts the water that results absorbs more heat speeding up the warming process.

44
Oceans Moderate the surface temperatures:
Removes 29% of the CO2, but water is less capable of dissolving gas as the temperature increases As the temperature increases CO2 will bubble out of the oceans. Oceans store heat energy deep in the water and may release it into the atmosphere There is a conveyor belt that transfers heat around the world that runs based on differences in water density. Fresh water from melted ice may throw the system off

45
Cold water melting from Antarctica's ice cap and
icebergs falls to the ocean floor and surges northward, affecting worldwide circulation. Greenland Antarctica Fig , p. 456

47
The Role of Air Pollution on Climate Change
Aerosols actually help reduce global warming At high altitudes aerosols attract water to form clouds that reflect sunlight Soot is the second biggest contributor to global warming (15-30%) Produced as a product of burning of coal and diesel fuel
 Produced as a product of burning of coal and diesel fuel.")
48
How Rapidly Can the Climate Shift?
If it changes quickly in a few decades we may not have time to… Switch food growing regions Relocate out of flood zones Build levees and dikes This may lead to large numbers of premature deaths, social and economic chaos

49
Possible Effects of a Warmer World
Changes in water distribution Changes in plant and animal biodiversity Cause the coastlines to move in by 0.8miles putting 200 million people directly at risk Contamination of water Extreme weather patterns Higher death rates due to higher temperatures Increased spread of tropical diseases such as malaria

50
In a recent chilling assessment, the World Health Organizationn (WHO) reported that human-induced changes in the Earth's climate now lead to at least 5 million cases of illness and more than 150,000 deaths every year.
 reported that human-induced changes in the Earth s climate now lead to at least 5 million cases of illness and more than 150,000 deaths every year.")
Similar presentations


. Global Warming Global Warming – is the increase of Earth’s average surface temperature due to effect of greenhouse.>")


