Download presentation
Presentation is loading. Please wait.

1
The Results are in! Now What???

2
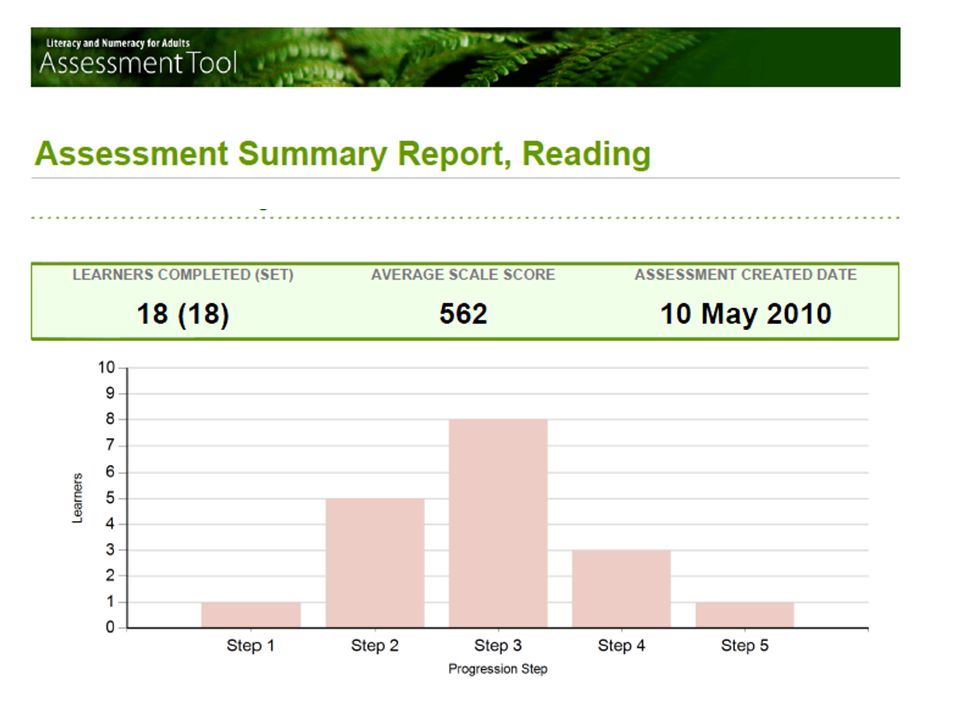
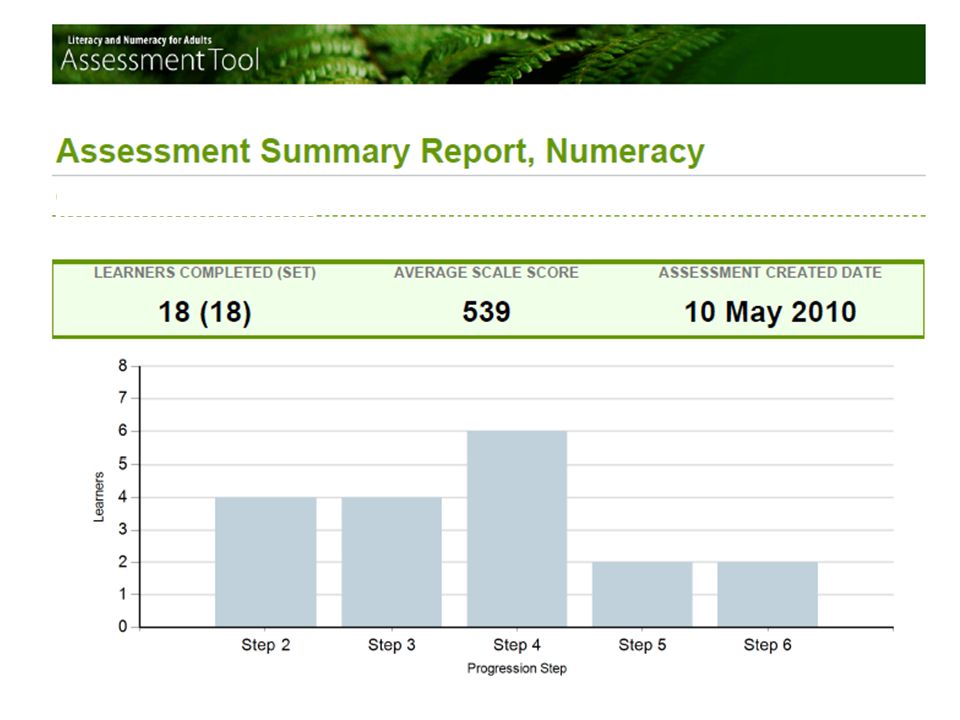
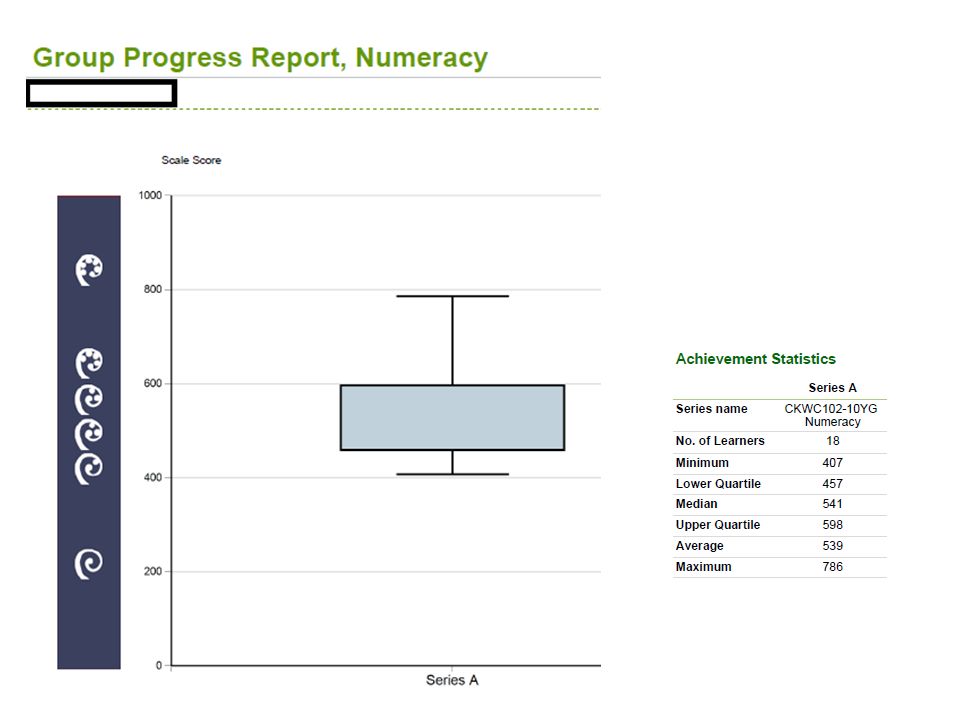
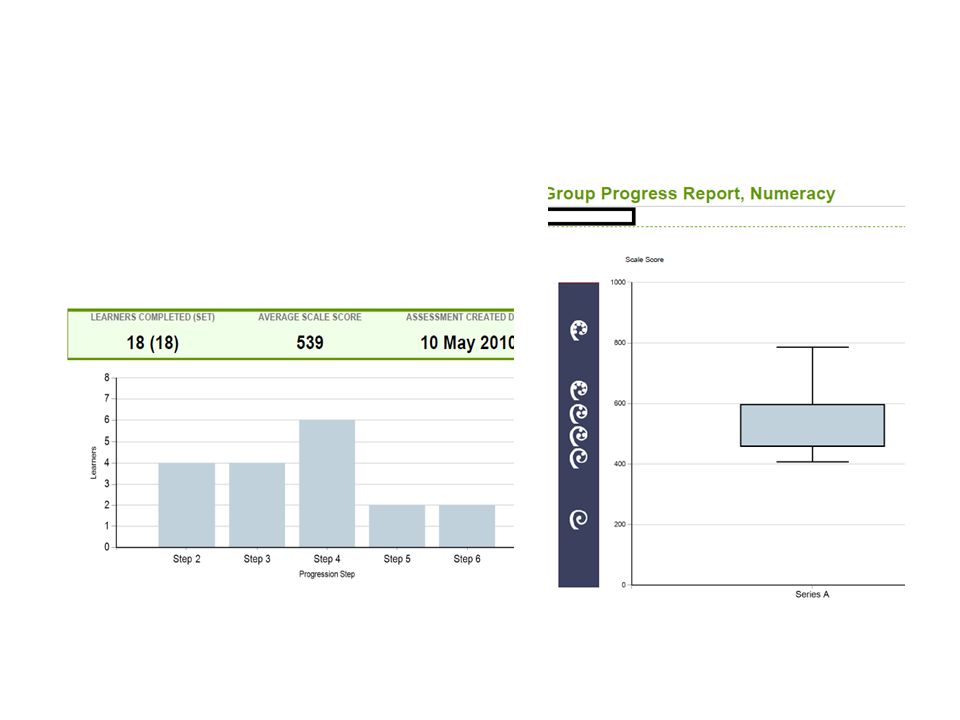
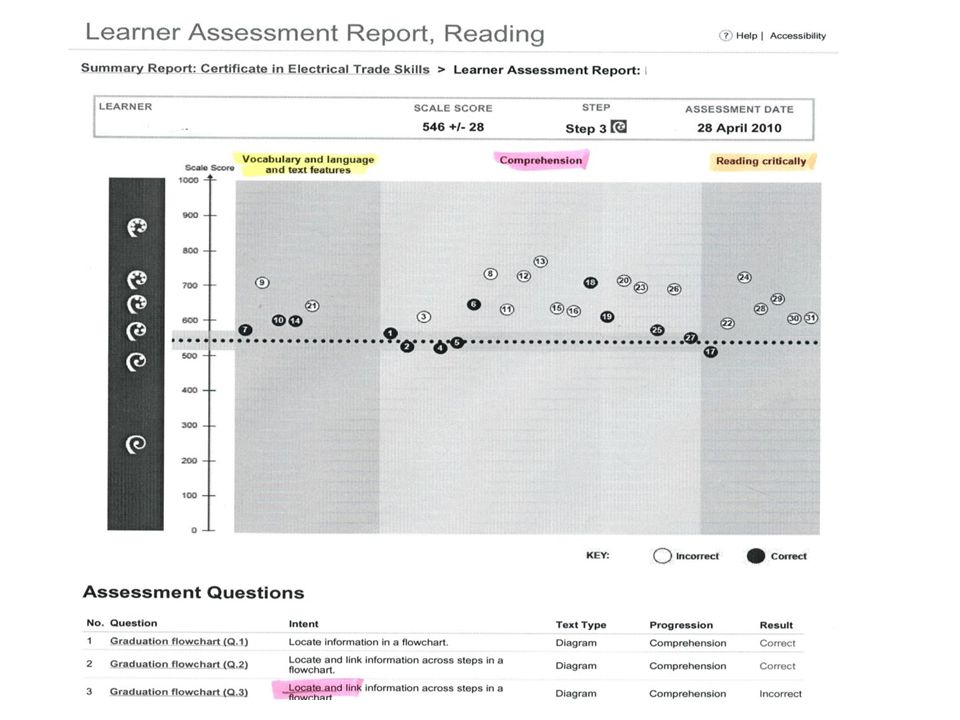
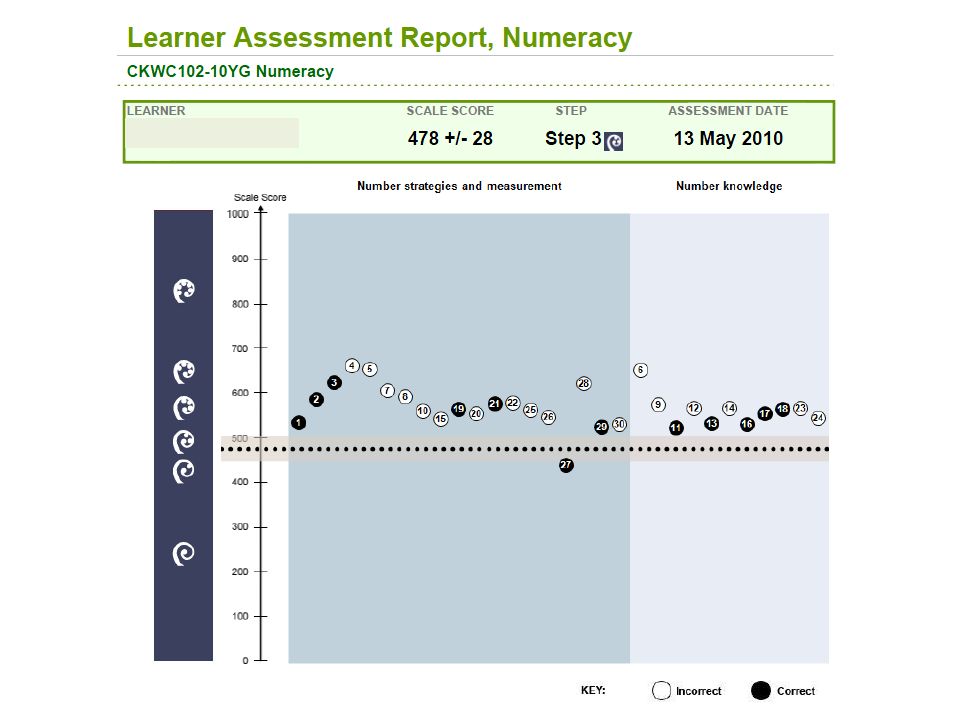
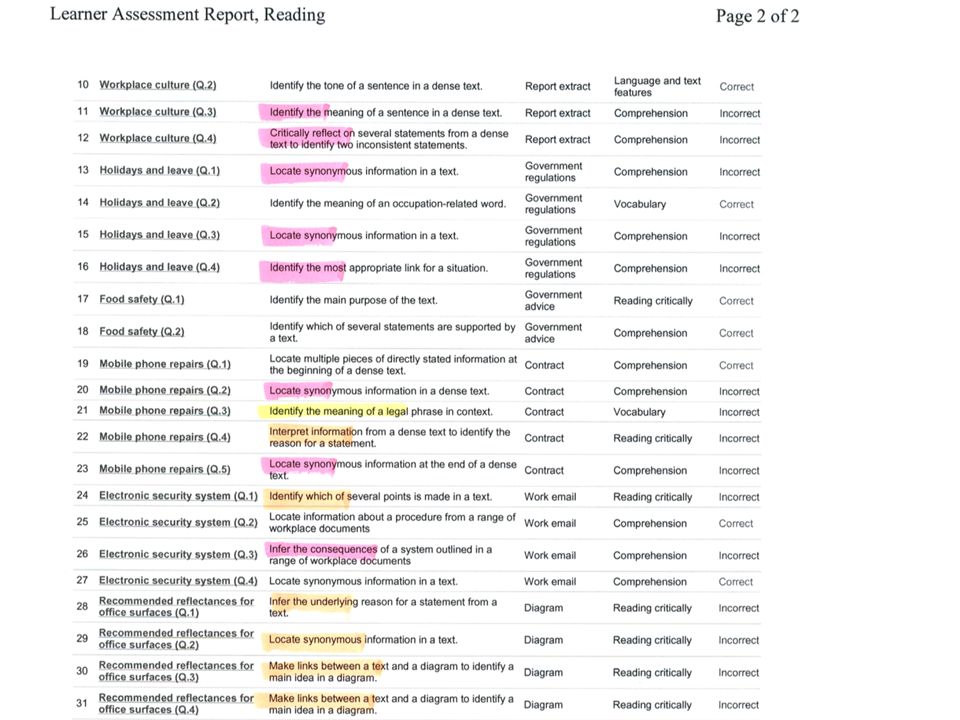
Information available Group reports – Summary Report (Bar chart) – Progress Report (Box plot, aka box-n-whisker) Individual reports – Learner Assessment Report (Scatter plot) – Question details
 – Progress Report (Box plot, aka box-n-whisker) Individual reports – Learner Assessment Report (Scatter plot) – Question details")
6
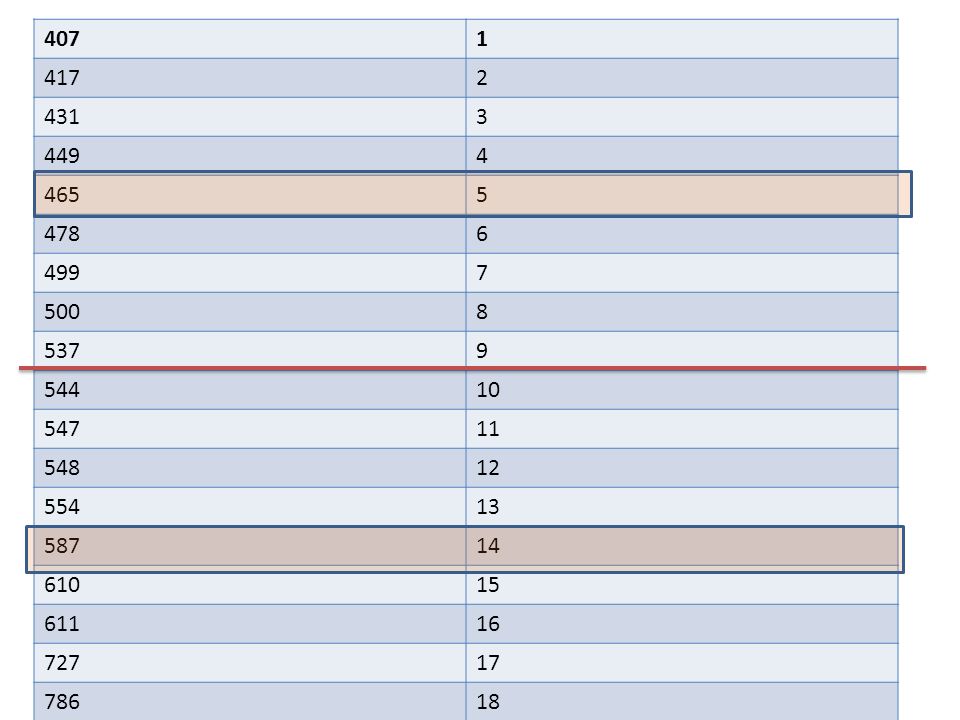
50% of our group scored in this range Bottom 25% of scores Top 25% of scores

7
4071 4172 4313 4494 4655 4786 4997 5008 5379 54410 54711 54812 55413 58714 61015 61116 72717 78618
9
Information available Group reports – Summary Report (Bar chart) – Progress Report (Box plot, aka box-n-whisker) Individual reports – Learner Assessment Report (Scatter plot) – Question details
 – Progress Report (Box plot, aka box-n-whisker) Individual reports – Learner Assessment Report (Scatter plot) – Question details")
12
Learner Profiling What generalisations can we make about a learner who answers most Reading assessment questions at step 3? What can and can’t we expect from a Step 3 reader?

13
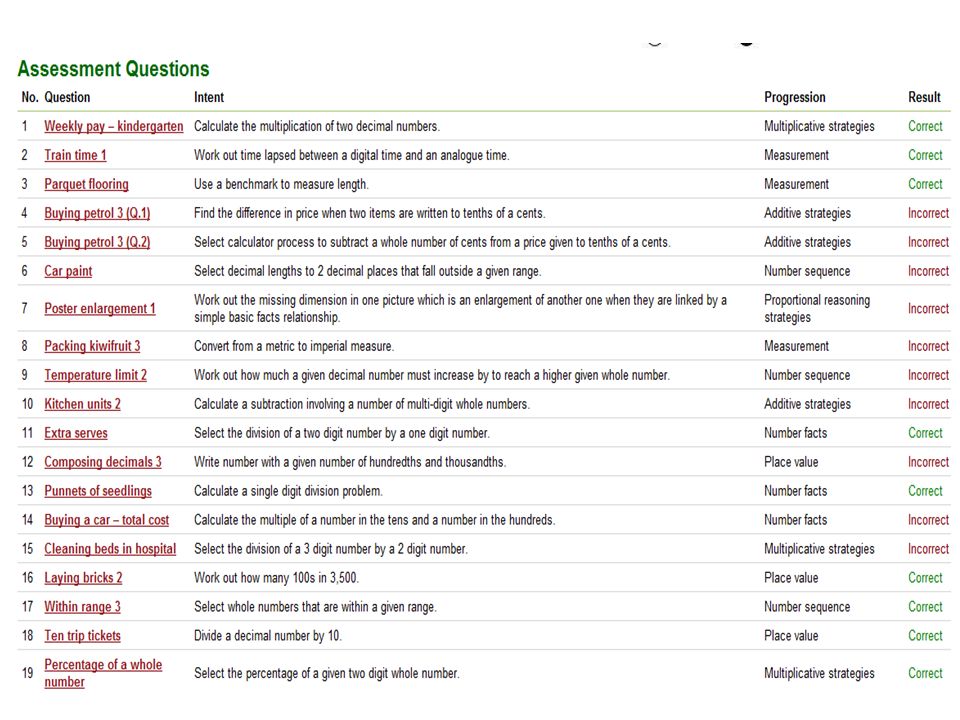
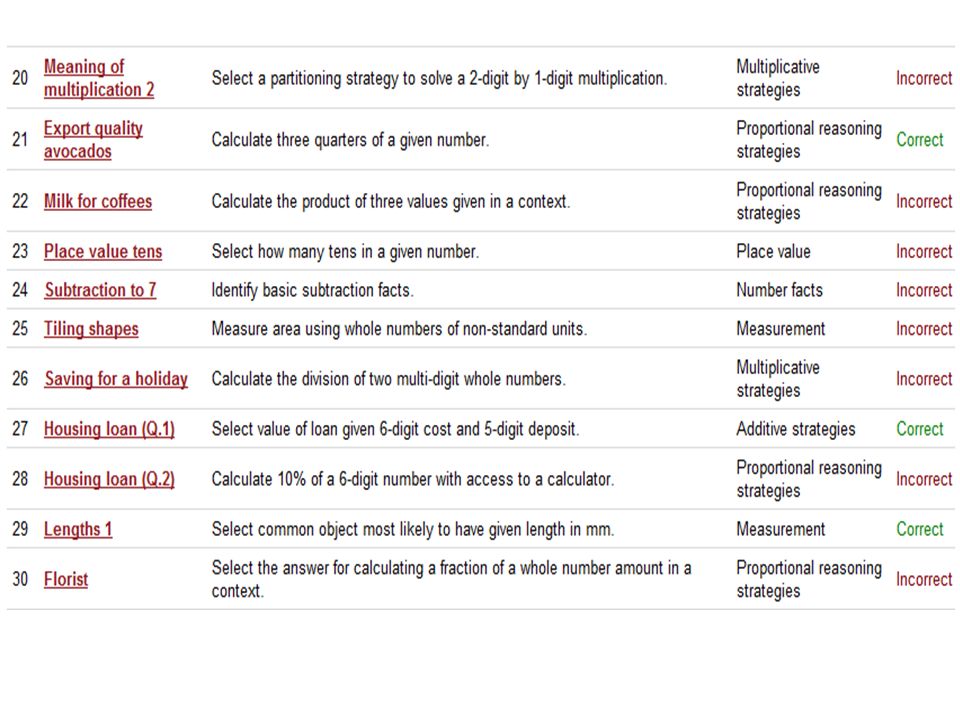
Learner Profiling What generalisations can we make about a learner who answers most Numeracy assessment questions at step 3? What can and can’t we expect from a Step 3 problem solver?

16
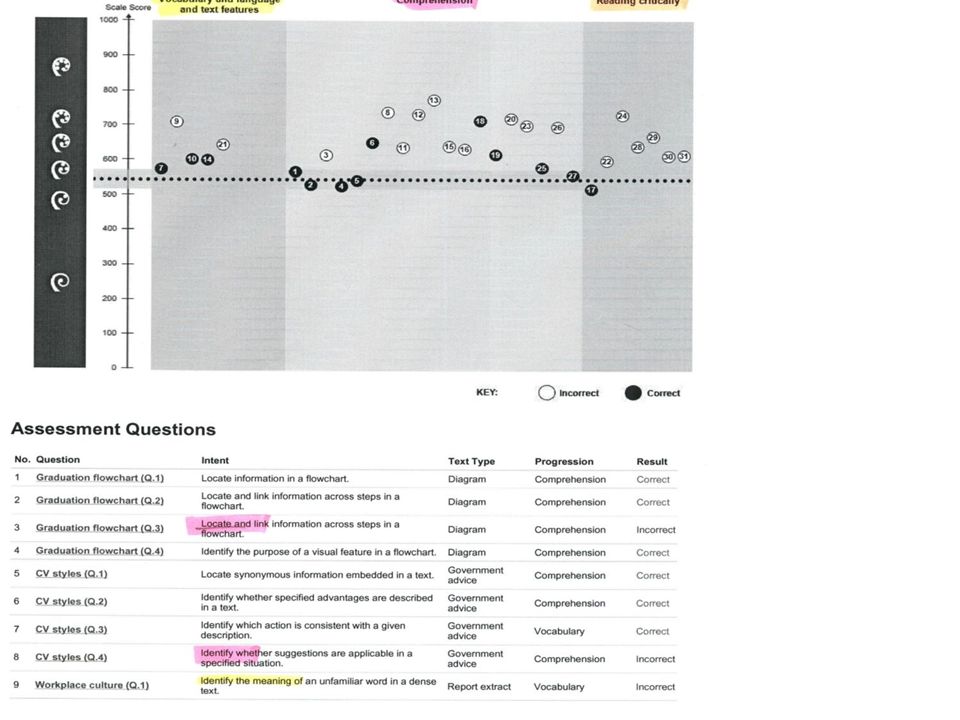
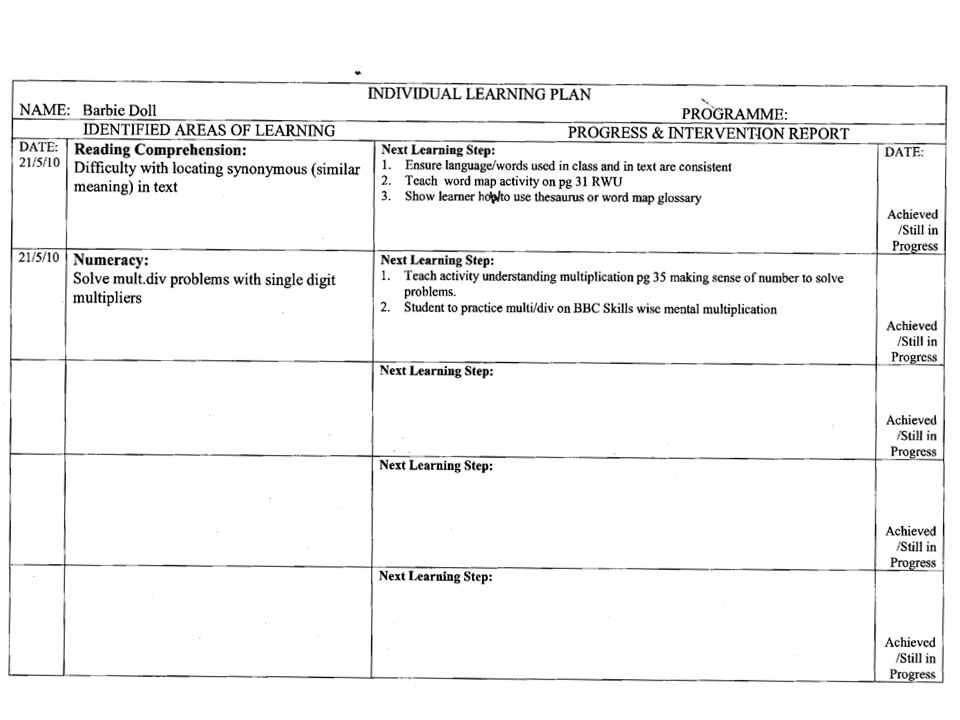
Analyse & Prioritise What key words are highlighted multiple times? Which of the highlighted skills are required regularly in your course or vocation? What deliberate acts of teaching will support your learner to acquire those skills?

20
Analyse & Prioritise What are the number knowledge gaps? Which strategies are highlighted multiple times? Any questions you’d like to look at in more detail? Which of the highlighted skills are required regularly in your course or vocation? What deliberate acts of teaching will support your learner to acquire those skills?

21
More detail about question

22
View Learner response (correct)
")
23
More detail about question

24
View Learner response (incorrect)
")
25
Possible reasons for incorrect response

26
Learner’s response highlighted

27
‘Dig deeper’ than the Reports Which of the questions might you want to look at and why? How could we minimise the in-depth analysis? How can you supplement the information in the report – contextualised formative assessment

Similar presentations


 The Next Step Induction Programme is intended to build your understanding of and knowledge about Next Step to: –Provide.>")

