Download presentation
Presentation is loading. Please wait.

1
CPI Inflation Gauge (Measure of price inflation in retail goods and services) Web address: www.bls.gov/cpi/ No monthly revision, annual revision in February. CPI: Inflation affects the following activities Costs of doing business Investment decisions Retirees quality of life Labor contracts & rental contracts Government macroeconomic policy Social security benefits, food stamps, alimony, child support payments CPI is an index number which leads to a historical perspective of inflation. (1982-84 =100) Inflation Explanations: Monetarist View – excessive money supply growth. Too many dollars, chasing to few goods. If M/M > Y/Y then P/P > 0 Keynesian View – AD > AS => shortage => Prices inflation is a function of the state of the business cycle and level of production slack/idle capacity/resource scarcity Core-CPI - best measure of underlying inflation 2 Population Groups: CPI-W (wage earners & clerical workers) 32% of population benchmark for pay increases in collective bargaining agreements and for yearly cost-of-living adjustments on social security checks. CPI-U (all urban workers)
 Inflation Explanations: Monetarist View – excessive money supply growth. Too many dollars, chasing to few goods. If M/M > Y/Y then P/P > 0 Keynesian View – AD > AS => shortage => Prices inflation is a function of the state of the business cycle and level of production slack/idle capacity/resource scarcity Core-CPI - best measure of underlying inflation 2 Population Groups: CPI-W (wage earners & clerical workers) 32% of population benchmark for pay increases in collective bargaining agreements and for yearly cost-of-living adjustments on social security checks. CPI-U (all urban workers).")
2
CPI Inflation Gauge (Measure of price inflation in retail goods and services) Deflationary Spiral: prices => corporate profits => job layoffs => household income => consumption spending => inventories => prices Forecasting Tool: Business can anticipate future technology and medical costs Investors can reassess investment strategies Union leaders use inflation forecasts in pay negotiations CPI is a lagging economic indicator 6 Other Price Gauges: PCE, Producer Prices, Import Prices, Employment Cost Index, Unit Labor Costs, GDP deflator. --------------------------------------------------------------------------------------------------------- Unexpected increase in inflation Bond Market: bond demand => bond price => nominal interest rates Stock Market: nominal interest rates => borrowing costs => profits=> stock prices Federal Reserve nominal interest rates => borrowing costs => profits => stock prices Firms prefer an increase in output rather than an increase in prices to boost revenues FX Market: AD > AS => unexpected inflation Y => r => exchange rate (good investment environment) P/P => i => exchange rate (erodes dollar-based investments held by foreigners)
 P/P => i => exchange rate (erodes dollar-based investments held by foreigners).")
3
Deflation leads to: Households postpone spending Rising real interest rates Rising debt burdens Deflation can lead to: Falling goods & services prices Falling home prices Falling stock prices Falling wages Hoarding money => deflation Austerity => stagnation/deflation Deflation => rising purchase power of dollar Deflation => lower wages => rising debt burden

4
Phillips Curve: Shows short-run inverse relationship between the P/P and U.R. Not a structural economic relationship Basic behavioral relationship that remains unchanged over long periods Not a permanent long-run tradeoff Long-run Phillips Curve is vertical Not a reliable menu of P/P and U.R. combinations in the long run.

5
Quantitative Easing 2 (Fed creating money to purchase assets) QE1 2009-2010: Fed bought $1.75 Trillion MBS and Treasury Securities QE-2 Cost/Benefit Analysis What are the tradeoffs?
 QE : Fed bought $1.75 Trillion MBS and Treasury Securities QE-2 Cost/Benefit Analysis What are the tradeoffs")
6
Quantitative Easing 2 QE-2 (11/3/10) Fed’s statutory mandate – foster maximum employment and price stability 1.Fed will purchase a further $600 billion of longer-term Treasury securities for the System Open Market Account (SOMA) by June 2011. 2.The open market trading desk will continue to reinvest principle payments from agency debt and agency MBS ($300 billion over next 8 months)
.")
7
QE2 Benefits QE2 Financial Effects: 1.Lower nominal interest rates (Treasury, corporate, mortgage) if the fall in real interest rates exceeds the rise in inflation expectations. Nominal interest rates = real interest rates + inflation expectations. 2.Lower real interest rates 3.Lower dollar exchange rate 4.Higher stock prices 5.Higher inflation expectations

8
QE2 Benefits QE2 Real Economy Effects 1.Additional 2011 economic growth of 0.6% 2.Additional 2011 job growth of 500,000 3.Lower 2011 unemployment rate by 0.4 percentage points 4.Debt refinancings will lower debt burdens and repair households and firms balance sheets 5.Rising exports 6.Chase investors into riskier assets 7.Higher stock prices will encourage additional business capital expenditures and hirings 8.Higher stock prices will boost household net worth, reducing savings rates and boosting consumption spending 9.Lower corporate risk premium => increase capital formation => job creation 10.Rising inflation => rising nominal returns on investment 11.Rising inflation expectations => boost consumption spending today at the expense of future consumption 12.Rising inflation expectations => falling real interest rates => rising consumer spending and business investment

9
QE2 Costs/Risks 1.May send signal to investors the Fed is panicking 2.The Fed is “pushing on a string” as demonstrated by the large holdings of excess reserves 3.Fed is monetizing the additional Treasury debt through June 2011 4.Low U.S. yields will chase capital abroad, appreciate foreign currencies, create global economic distortions. For example, asset price bubbles and excess accumulation of reserves. 5.QE2 will not significantly lower nominal interest rates: lower real interest rates will be offset by higher inflation expectations. 6.Falling dollar will decrease the Chinese Yuan because of its peg. 7.Low interest rates are suppose to mobilize resources, but it could misallocate resources. 8.Low interest rates may boost the economy today, only to collapse it tomorrow. 9.Low interest rates subsidize borrowers at the expense of savers. 10.Competitive Quantitative Easing – Countries competing by printing more money to reduce exchange rates. This is inherently unstable. Someone must lose share of world trade at expense of others who gain share. 11.Trade Wars – Boosting export strategy can turn into blocking imports policy 12.Gold bubble 13.QE-2 won’t work because households and firms are repairing and deleveraging their balance sheets. 14.Firm’s cash stock piles are at record levels 15.Fed’s determination to avoid deflation could actually cause deflation: ELEP is a sign the Fed expects underemployed resources for an “extended period” => private sector pessimism => business expect investments to fail and households expect falling prices => cash hoarding => weak economy => deflation.

10
Monetary policy options to prevent deflation and increase inflation expectations 1.Quantitative easing: print money to buy long-term government debt 2.Buy private-sector debt 3.Change expectations by announcing it will keep short-term rates low for a long time 4. Raise its long-run inflation target (encourage borrowing, discourage cash hoarding) 5. Reduce the interest rate paid on excess reserves. 6.Move from inflation targeting (rate of change) to price level targeting Anticipated inflation is expected and built into planning Unanticipated inflation is unexpected and disrupts planning Alters expected outcome of long-term projects Reduces long-term investment Distorts the information in prices – reduces the effectiveness of markets Results in actions based on price anticipation, instead of production
 5. Reduce the interest rate paid on excess reserves. 6.Move from inflation targeting (rate of change) to price level targeting Anticipated inflation is expected and built into planning Unanticipated inflation is unexpected and disrupts planning Alters expected outcome of long-term projects Reduces long-term investment Distorts the information in prices – reduces the effectiveness of markets Results in actions based on price anticipation, instead of production.")
11
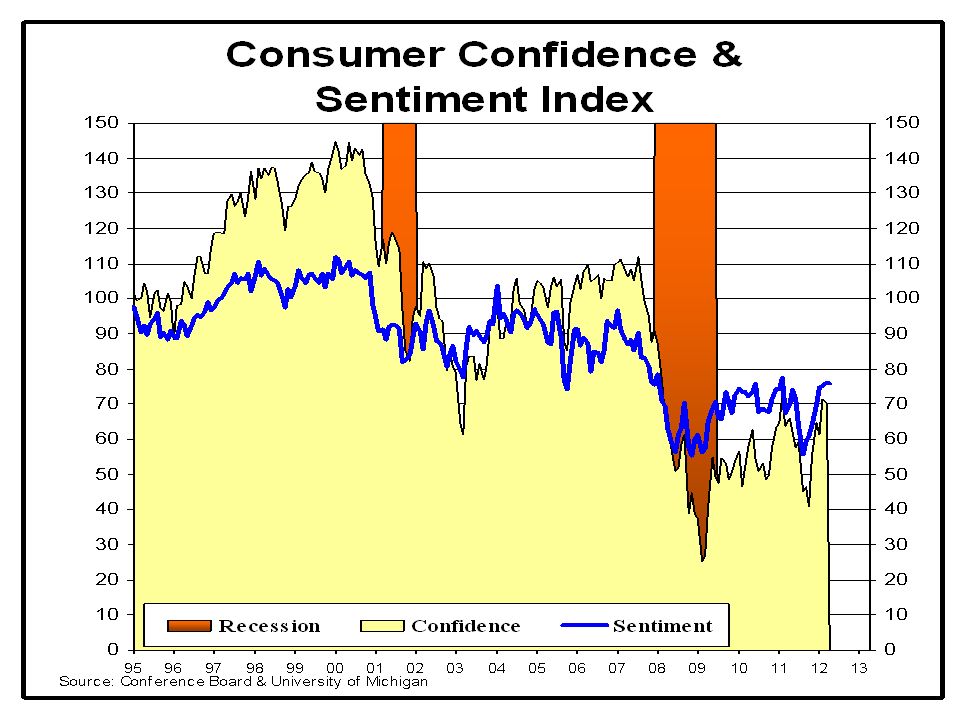
Consumer Confidence/Sentiment Index ( Real Time Measures of Consumers Attitudes on Economy, Personal Finance, and Future Spending) Web: http://www.conference-board.org/economics/consumerConfidence.cfm Web: http://www.sca.isr.umich.edu/main.php http://www.sca.isr.umich.edu/main.php Minor revisions Happy consumers are good for business so index is useful for predicting consumer spending. Unfortunately, the relationship between confidence index and spending is not a close one. Difficult to predict how humans will behave. Sales are the best method of measuring consumer confidence. A six month moving average of confidence is a better indicator of future household outlays. Index is important during economic turning points. Better at forecasting recessions than recoveries. Consumer confidence Index polls 5,000 new households, the survey has 5 questions with emphasis on labor market conditions - which can lag the economy Consumer Sentiment Index polls 500 new and continuing households (the rotating interview strategy is 60% new and 40% second time interviews => less erratic index), 50 questions with emphasis on financial and personal income expectations which is a driving force behind consumer spending => better leading indicator. ------------------------------------------------------------------------------------------------------------------------------------------------ Market Analysis: Bonds: Confidence => borrowing/spending => P/P => D Bonds => i Bonds Stocks: Confidence => borrowing/spending => Y/Y => profits => P Stocks Dollar: Confidence => borrowing/spending => Y/Y => i Bonds => dollar
, 50 questions with emphasis on financial and personal income expectations which is a driving force behind consumer spending => better leading indicator Market Analysis: Bonds: Confidence => borrowing/spending => P/P => D Bonds => i Bonds Stocks: Confidence => borrowing/spending => Y/Y => profits => P Stocks Dollar: Confidence => borrowing/spending => Y/Y => i Bonds => dollar.")
Similar presentations


>")


 Web: www.bea.doc.govwww.bea.doc.gov Monthly revisions, annual revisions in July, benchmark changes.>")