Download presentation
Presentation is loading. Please wait.

1
Labor Market Information Division Tonya Lee

2
Demographics American Community Survey Average Population Estimates for 2008-2012 AgeEstimate Under 5 years 2,996 5 to 9 years 3,075 10 to 14 years 2,998 15 to 19 years 2,983 20 to 24 years 2,573 25 to 29 years 2,714 30 to 34 years 2,982 35 to 39 years 3,023 40 to 44 years 2,887 45 to 49 years 3,017 50 to 54 years 3,180 55 to 59 years 2,807 60 to 64 years 2,487 65 to 69 years 1,966 70 to 74 years 1,479 75 to 79 years 1,130 80 to 84 years 729 85 years and over 617

3
Unemployment Data March 2014 Unemployment & 2014 Underemployment Data County Civilian Labor Force CLF EmploymentUnemployment Unemployment RateUnderemployment Available Labor Pool Blount 26,43624,7901,6466.2% 6,6938,339 Chilton 19,81618,5951,2216.2% 3,8785,099 Jefferson 305,004285,41819,5866.4% 73,93893,524 Shelby 105,853100,8075,0464.8% 25,77630,822 St. Clair 38,12735,7912,3366.1% 8,62910,965 Walker 27,15125,1861,9657.2% 5,3567,321 Unemployment + Underemployment = Potential Available Labor Pool Source: Alabama labor force data prepared by the Alabama Department of Labor in cooperation with the Bureau of Labor Statistics, Preliminary March 2014 data, based on 2013 bench mark. Underemployment data produced by the University of Alabama, Center for Business and Economic Research in cooperation with the Alabama Department of Labor, Labor Market Information Division, 2014 survey results.

4
Unemployment Data Chilton County Unemployed by Occupation 2013, Quarter 4 Occupation Number Unemployed Occupation Number Unemployed Team Assemblers23Nursing Aides, Orderlies, & Attendants 7 Cashiers15Bookkeeping, Accounting, & Auditing Clerks 6 Construction Laborers9Stock Clerks, Sales Floor6 Customer Service Reps9Retail Salespersons6 Maintenance & Repair Workers 9Light Truck or Delivery Services Drivers 6 Stock Clerks, Warehouse8Personal Care Aides5 Receptionists & Information Clerks 7Painters, Construction & Maintenance 5 Electricians7Cooks, Restaurant5 Construction Carpenters7Office Clerks, General5 Industrial Truck & Tractor Operators 7Supervisors of Retail Sales Workers 5 Source: Alabama Department of Labor, Unemployment Insurance Reports

5
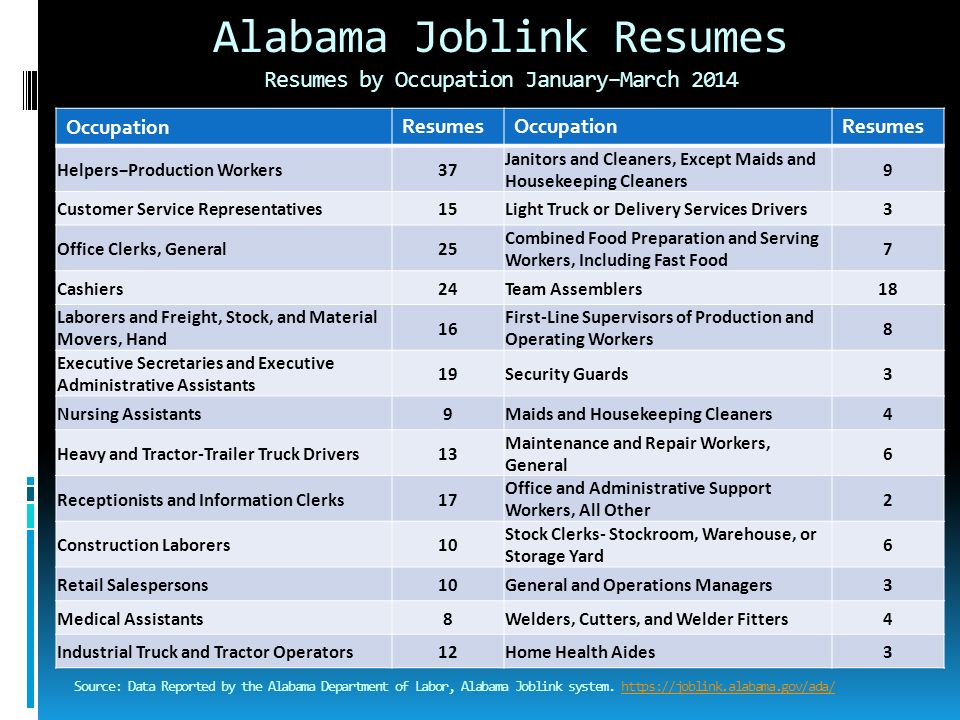
Alabama Joblink Resumes Resumes by Occupation January−March 2014 Occupation ResumesOccupationResumes Helpers−Production Workers37 Janitors and Cleaners, Except Maids and Housekeeping Cleaners 9 Customer Service Representatives15Light Truck or Delivery Services Drivers3 Office Clerks, General25 Combined Food Preparation and Serving Workers, Including Fast Food 7 Cashiers24Team Assemblers18 Laborers and Freight, Stock, and Material Movers, Hand 16 First-Line Supervisors of Production and Operating Workers 8 Executive Secretaries and Executive Administrative Assistants 19Security Guards3 Nursing Assistants9Maids and Housekeeping Cleaners4 Heavy and Tractor-Trailer Truck Drivers13 Maintenance and Repair Workers, General 6 Receptionists and Information Clerks17 Office and Administrative Support Workers, All Other 2 Construction Laborers10 Stock Clerks- Stockroom, Warehouse, or Storage Yard 6 Retail Salespersons10General and Operations Managers3 Medical Assistants8Welders, Cutters, and Welder Fitters4 Industrial Truck and Tractor Operators12Home Health Aides3 Source: Data Reported by the Alabama Department of Labor, Alabama Joblink system. https://joblink.alabama.gov/ada/https://joblink.alabama.gov/ada/
6
Expected Worker Shortfall Chilton County 2010-20202010-2030 Total Population Growth9.3%17.4% Age 20-64 population growth5.4%9.8% Nonagricultural job growth-3.5%-1.3% Worker shortfall-8.8%-11.1% Worker shortfall-819-1,032 Source: Center for Business and Economic Research (CBER), University of Alabama If the job growth declines as this projection indicates, Chilton County is projected to have approximately 1,000 more workers than jobs in the County.
, University of Alabama If the job growth declines as this projection indicates, Chilton County is projected to have approximately 1,000 more workers than jobs in the County.")
7
Demographics American Community Survey Average Population Estimates for 2008-2012 School EnrollmentEstimate Population 3 years and over, enrolled in school 9,925 Nursery school, preschool 656 Kindergarten 472 Elementary school (grades 1-8) 4,962 High school (grades 9-12) 2,406 College or graduate school 1,429 Educational AttainmentEstimate Population 25 years and over 28,945 Less than 9 th grade 2,571 9 th to 12 th grade, no diploma 4,452 High school graduate (includes equivalency) 11,356 Some college, no degree 4,994 Associate’s degree 1,964 Bachelor’s degree 2,276 Graduate or professional degree 1,332
 4,962 High school (grades 9-12) 2,406 College or graduate school 1,429 Educational AttainmentEstimate Population 25 years and over 28,945 Less than 9 th grade 2,571 9 th to 12 th grade, no diploma 4,452 High school graduate (includes equivalency) 11,356 Some college, no degree 4,994 Associate’s degree 1,964 Bachelor’s degree 2,276 Graduate or professional degree 1,332")
8
Postsecondary Education 2012-2013 HS Graduates Enrolled in Alabama Public Colleges High School HS Grads Enrolled in AL Public Colleges Enrolled in Remedial Course(s) Math Only English Only BothTotal Chilton County High School 148711651132 Isabella High School 44185319 Jemison High School 10042130417 Maplesville High School 28101113 Thorsby High School 7035112619 Verbena High School 2280022 Approximately 45% of 2012-2013 High School Graduates were enrolled in Alabama Public Colleges for Fall 2013 About 70 of the approximately 110 enrolled in public colleges are attending colleges close to Chilton County This does not include those that enroll in private Institutions Also does not include those who enroll in Institutions in other states. Source: Alabama Commission on Higher Education (ACHE) High School Feedback Reports http://ache.alabama.gov/Content/StudentDB/SDBReports.aspx http://ache.alabama.gov/Content/StudentDB/SDBReports.aspx
 High School Feedback Reports")
9
Postsecondary Education Fall 2013 Undergraduate Enrollment of Students Attending Alabama Public Two-Year and Four-Year Institutions Chilton County # Undergrads# First-Time Freshman Major Grand Total1,128194 General Studies275 69 Undeclared/Not Reported155 11 Registered Nursing/Registered Nurse102 16 Liberal Arts and Sciences/Liberal Studies44 10 Biology/Biological Sciences, General34 7 Psychology, General28 1 Accounting25 1 Business Administration and Management, General23 4 Elementary Education and Teaching23 1 Radiologic Technology/Science - Radiographer22 8 Social Work17 1 Office Management and Supervision16 3 Physical Therapy Technician/Assistant15 7 Administrative Assistant and Secretarial Science, General12 0 Computer and Information Sciences, General12 1 Finance, General12 1 Art/Art Studies, General11 1 Emergency Medical Technology/Technician (EMT Paramedic)10 4 Physical Education Teaching and Coaching10 1 Criminal Justice/Safety Studies9 2 Health and Physical Education/Fitness, General9 0 Business/Commerce, General8 2 Chemical Engineering8 1 Electrician8 1 Source: Alabama Commission on Higher Education (ACHE) Workforce Development Reports, Potential Workforce by County http://ache.alabama.gov/Content/Workforce/Workforce.aspx http://ache.alabama.gov/Content/Workforce/Workforce.aspx
10 4 Physical Education Teaching and Coaching10 1 Criminal Justice/Safety Studies9 2 Health and Physical Education/Fitness, General9 0 Business/Commerce, General8 2 Chemical Engineering8 1 Electrician8 1 Source: Alabama Commission on Higher Education (ACHE) Workforce Development Reports, Potential Workforce by County")
10
Postsecondary Education Fall 2013 Graduate Enrollment of Students Attending Alabama Public Four-Year Institutions Chilton County# Graduate Students Major Grand Total71 Elementary Education and Teaching 11 Counselor Education/School Counseling and Guidance Services 7 Secondary Education and Teaching 7 Registered Nursing/Registered Nurse 6 Educational Leadership and Administration, General 4 Mathematics, General 3 Special Education and Teaching, General 3 Criminal Justice/Safety Studies 2 Liberal Arts and Sciences/Liberal Studies 2 Medicine 2 Physical Education Teaching and Coaching 2 Physical Therapy/Therapist 2 Undeclared/Not Reported 2 Accounting 1 Business Administration and Management, General 1 Civil Engineering, General 1 Community Psychology 1 Education, General 1 Educational/Instructional Technology 1 Elementary and Middle School Administration/Principalship 1 Food Science 1 Human Resources Management/Personnel Administration, General 1 Marketing/Marketing Management, General 1 Multi-/Interdisciplinary Studies, General 1 Source: Alabama Commission on Higher Education (ACHE) Workforce Development Reports, Potential Workforce by County http://ache.alabama.gov/Content/Workforce/Workforce.aspx http://ache.alabama.gov/Content/Workforce/Workforce.aspx
 Workforce Development Reports, Potential Workforce by County")
11
Postsecondary Education Summer 2012 thru Spring 2013 Completions of Students from Alabama Public Two-Year and Four-Year Institutions: Sorted by Major Major Less than 1 year Less than 2 years Associate Less than 4 years Bachelor Post-Bachelor Master Post-Master Doctoral Chilton Chilton Total * State Totals Accounting Technology/Technician & Bookkeeping323 878 Accounting 4 4935 Administrative Assistant & Secretarial Science, General 53 8664 Agricultural Economics 1 124 Anthropology 1 171 Art Teacher Education 1 19 Art/Art Studies, General 2 2217 Bioengineering & Biomedical Engineering 1 120 Biology/Biological Sciences, General 2 2716 Biomedical Sciences, General 2 2199 Business Administration & Management, General 1 5 1 71,641 Carpentry/Carpenter 2 266 Chemistry, General 1 1149 Child Care & Support Services Management111 3331 Computer & Information Sciences, General 1 1 2612 Corrections &Criminal Justice, Other 1 165 Cosmetology/Cosmetologist, General 1 1369 Criminal Justice/Police Science111 3168 Criminal Justice/Safety Studies 1 2 3396 Early Childhood Education & Teaching 1 1203 Source: Alabama Commission on Higher Education (ACHE) Workforce Development Reports, Potential Workforce by County http://ache.alabama.gov/Content/Workforce/Workforce.aspx http://ache.alabama.gov/Content/Workforce/Workforce.aspx
 Workforce Development Reports, Potential Workforce by County")
12
2012 Annual Industry Employment Source: Data prepared by the Alabama Department of Labor, Labor Market Information Division, Quarterly Census of Employment and Wage Unit (QCEW) in cooperation with the Bureau of Labor Statistics. Data not reported is due to confidentiality restrictions enforced by the Bureau of Labor Statistics.

13
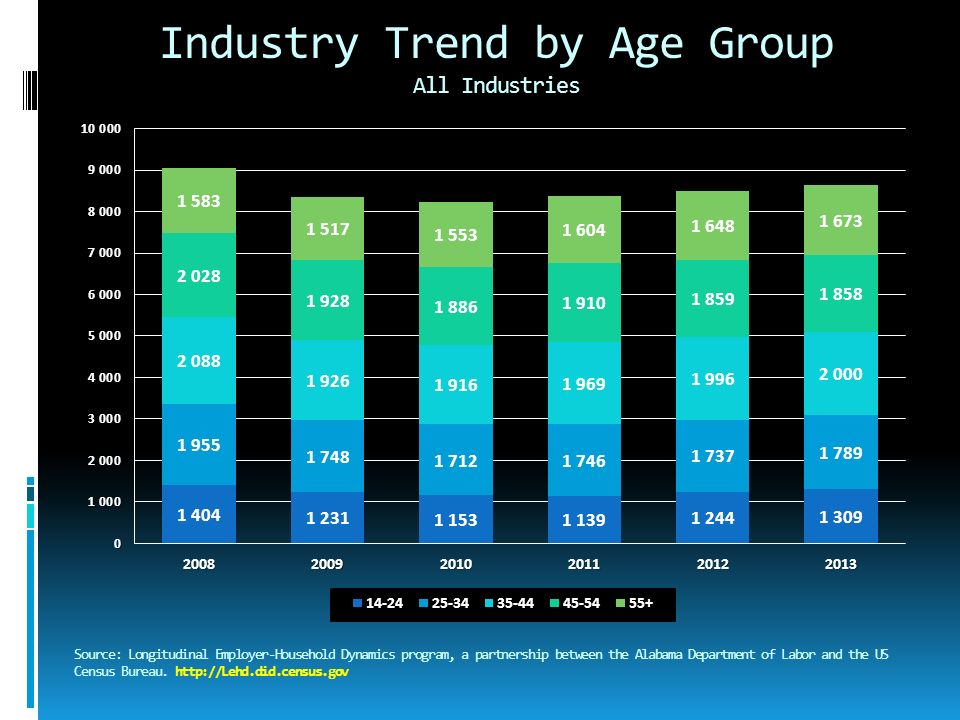
Industry Trend by Age Group All Industries Source: Longitudinal Employer-Household Dynamics program, a partnership between the Alabama Department of Labor and the US Census Bureau. http://Lehd.did.census.gov
14
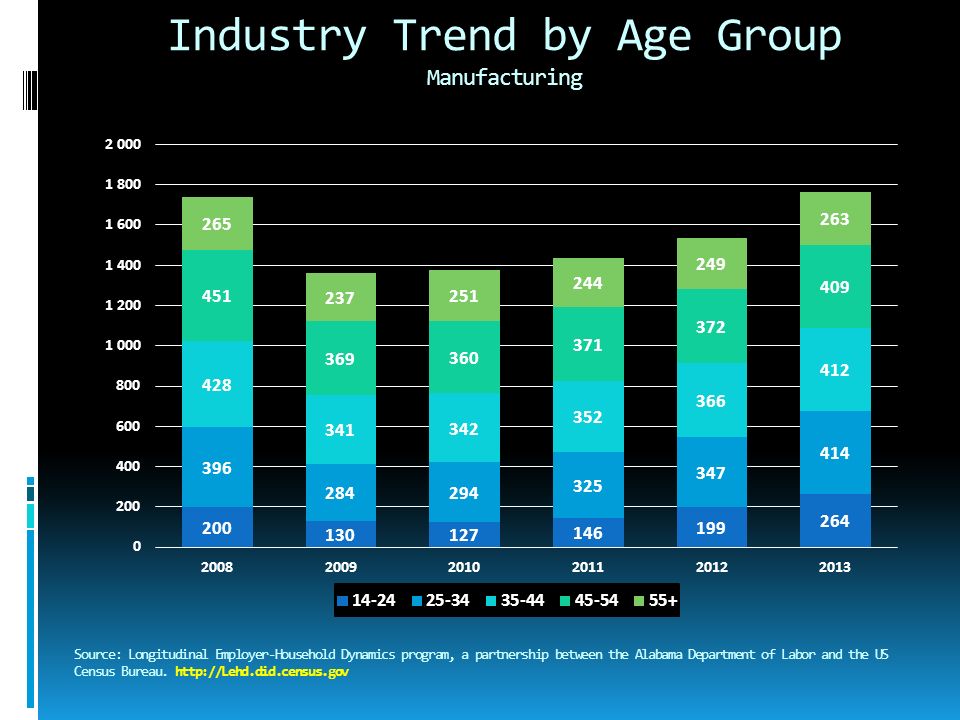
Industry Trend by Age Group Manufacturing Source: Longitudinal Employer-Household Dynamics program, a partnership between the Alabama Department of Labor and the US Census Bureau. http://Lehd.did.census.gov
15
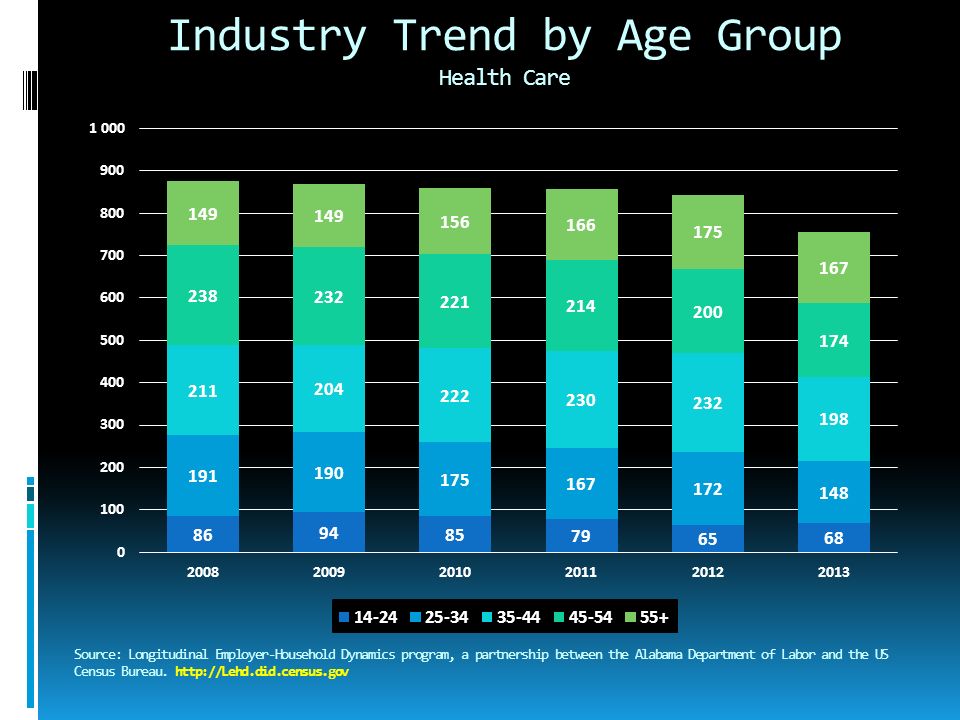
Industry Trend by Age Group Health Care Source: Longitudinal Employer-Household Dynamics program, a partnership between the Alabama Department of Labor and the US Census Bureau. http://Lehd.did.census.gov
16
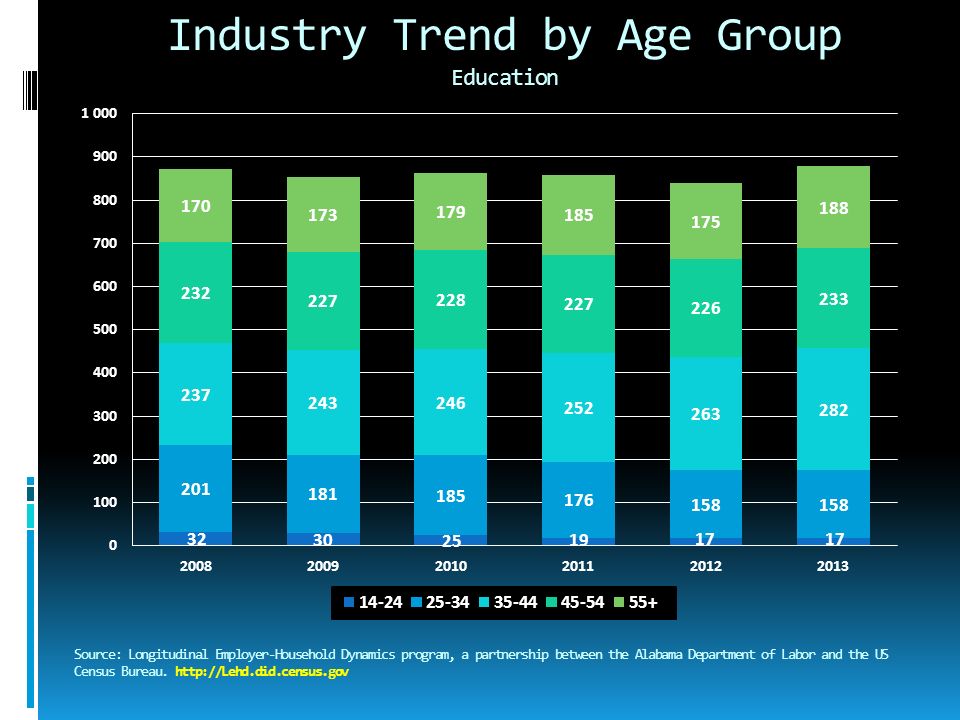
Industry Trend by Age Group Education Source: Longitudinal Employer-Household Dynamics program, a partnership between the Alabama Department of Labor and the US Census Bureau. http://Lehd.did.census.gov
17
2014 Occupational Wages Chilton County Average Hourly Wage All Occupations EntryMeanExperienced $8.46$16.40$20.37 Chilton County Average Hourly Wage Production Occupations EntryMeanExperienced $11.79$15.32$17.08 Source: Data provided by the Alabama Department of Labor, Labor Market Information Division in cooperation with the Bureau of Labor Statistics. The data is based on the 2013 release of the Occupational Employment Statistics report, employment and wage estimate file. Wage data has been aged using the latest quarterly Employment Cost Index (ECI) factors.
 factors..")
18
2014 Occupational Wages Annual Average Wage Comparison Montgomery County All $18,861$41,446$52,739 Production $19,734$32,649$39,107 Shelby County All $18,942$43,100$55,179 Production $19,354$35,572$43,681 Jefferson County Total $19,517$45,045$57,809 Production $21,227$35,121$42,067 Chilton County EntryMedianExperienced Total $17,610$34,128$42,388 Production $24,528$31,863$35,531 Source: Data provided by the Alabama Department of Labor, Labor Market Information Division in cooperation with the Bureau of Labor Statistics. The data is based on the 2013 release of the Occupational Employment Statistics report, employment and wage estimate file. Wage data has been aged using the latest quarterly Employment Cost Index (ECI) factors.
 factors..")
19
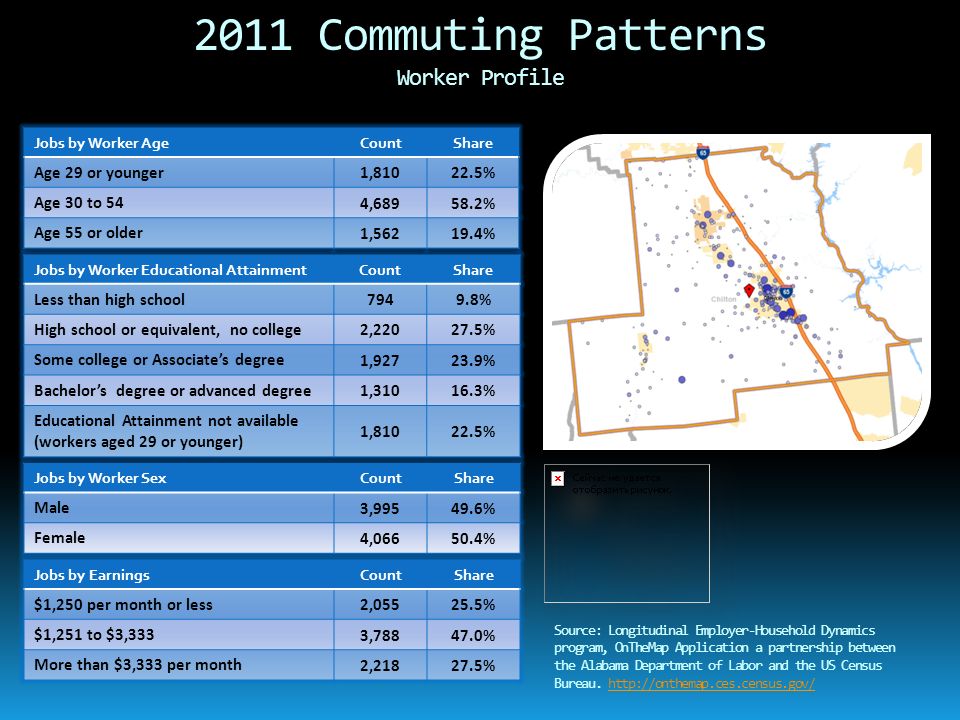
2011 Commuting Patterns Worker Profile Jobs by Worker Educational AttainmentCountShare Less than high school 7949.8% High school or equivalent, no college 2,22027.5% Some college or Associate’s degree 1,92723.9% Bachelor’s degree or advanced degree 1,31016.3% Educational Attainment not available (workers aged 29 or younger) 1,81022.5% Jobs by Worker AgeCountShare Age 29 or younger 1,81022.5% Age 30 to 54 4,68958.2% Age 55 or older 1,56219.4% Jobs by Worker SexCountShare Male 3,99549.6% Female 4,06650.4% Jobs by EarningsCountShare $1,250 per month or less 2,05525.5% $1,251 to $3,333 3,78847.0% More than $3,333 per month 2,21827.5% Source: Longitudinal Employer-Household Dynamics program, OnTheMap Application a partnership between the Alabama Department of Labor and the US Census Bureau. http://onthemap.ces.census.gov/http://onthemap.ces.census.gov/
20
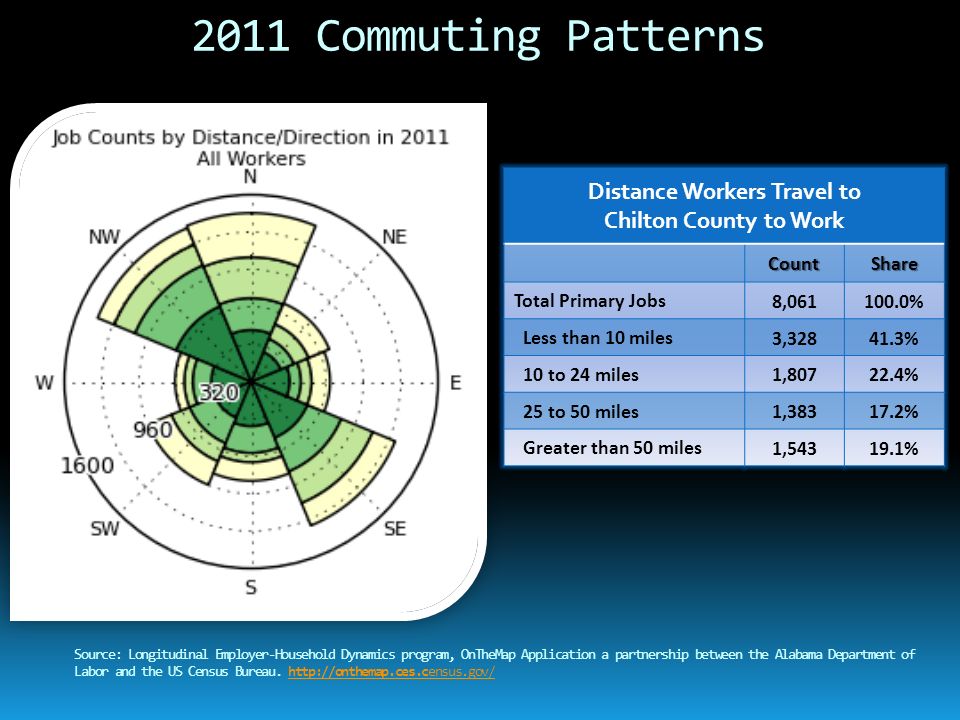
2011 Commuting Patterns Distance Workers Travel to Chilton County to WorkCountShare Total Primary Jobs 8,061100.0% Less than 10 miles 3,32841.3% 10 to 24 miles 1,80722.4% 25 to 50 miles 1,38317.2% Greater than 50 miles 1,54319.1% Source: Longitudinal Employer-Household Dynamics program, OnTheMap Application a partnership between the Alabama Department of Labor and the US Census Bureau. http://onthemap.ces.census.gov/http://onthemap.ces.census.gov/
21
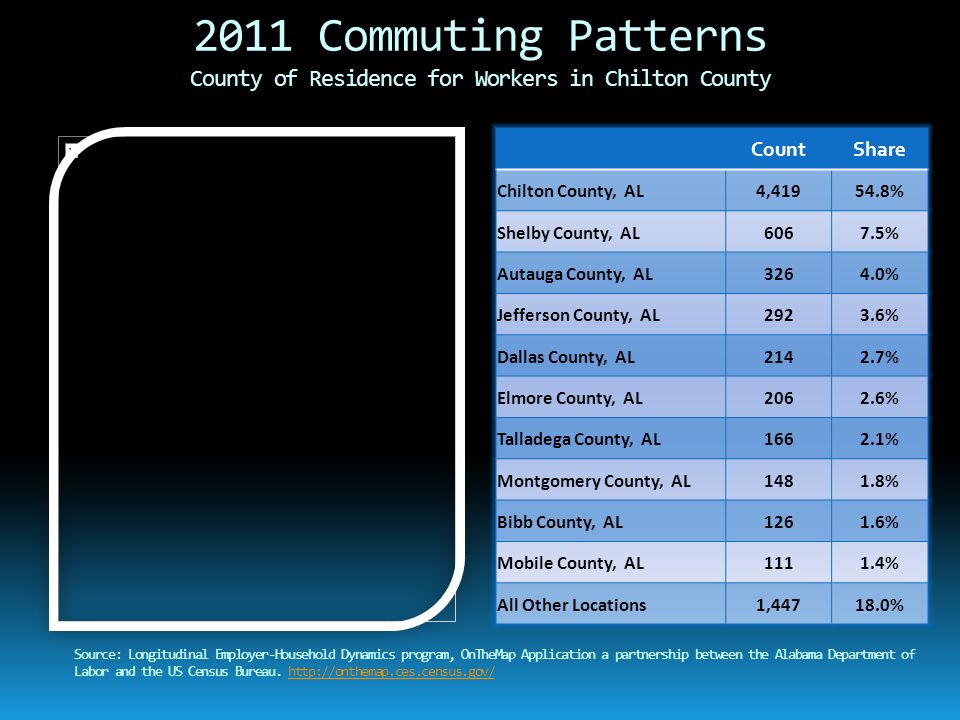
2011 Commuting Patterns County of Residence for Workers in Chilton County CountShare Chilton County, AL4,41954.8% Shelby County, AL6067.5% Autauga County, AL3264.0% Jefferson County, AL2923.6% Dallas County, AL2142.7% Elmore County, AL2062.6% Talladega County, AL1662.1% Montgomery County, AL1481.8% Bibb County, AL1261.6% Mobile County, AL1111.4% All Other Locations1,44718.0% Source: Longitudinal Employer-Household Dynamics program, OnTheMap Application a partnership between the Alabama Department of Labor and the US Census Bureau. http://onthemap.ces.census.gov/http://onthemap.ces.census.gov/
22
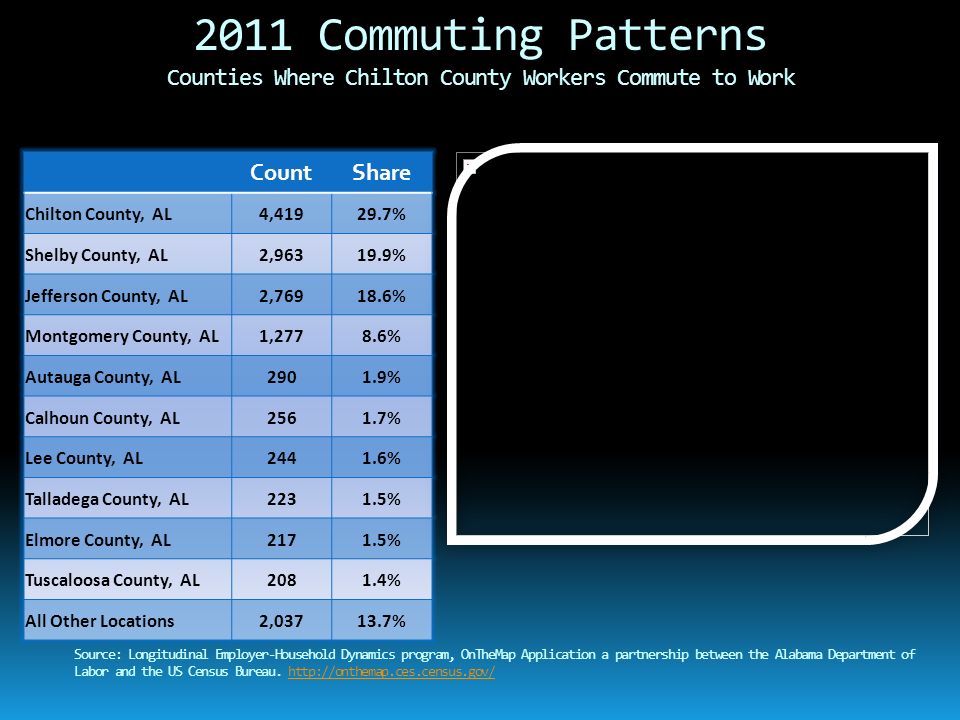
2011 Commuting Patterns Counties Where Chilton County Workers Commute to Work CountShare Chilton County, AL4,41929.7% Shelby County, AL2,96319.9% Jefferson County, AL2,76918.6% Montgomery County, AL1,2778.6% Autauga County, AL2901.9% Calhoun County, AL2561.7% Lee County, AL2441.6% Talladega County, AL2231.5% Elmore County, AL2171.5% Tuscaloosa County, AL2081.4% All Other Locations2,03713.7% Source: Longitudinal Employer-Household Dynamics program, OnTheMap Application a partnership between the Alabama Department of Labor and the US Census Bureau. http://onthemap.ces.census.gov/http://onthemap.ces.census.gov/
23
Will my kids be able to work here? Projections show that the population will grow faster than job growth through 2030. Chilton County is in a great location, right on the I-65 corridor in between two of the largest metropolitan areas in the state. Chilton County’s schools produce large number of students who graduate high school and then go to college. The question that arises is does everyone that lives in Chilton County wish to work in Chilton County, or do they choose to live there rather than in the metropolitan areas in which they work? Good news is that if employment increases in Chilton County over the next decade rather than decreases, the County has plenty of workers to fill those positions.

24
Tonya Lee Alabama Department of Labor Labor Market Information Division Phone(334) 242-8881 Tonya.Lee@labor.alabama.gov www.labor.alabama.gov/lmi
")
Similar presentations


$1,962,970,147.>")


 2010 7.5%9.5% 20097.8%9.6% Rochester MSA U.S.>")


 258-8870>")


$720,026,497 Median Salary Range$15,440-$129,100.>")


