Download presentation
Presentation is loading. Please wait.

1
Motion KINEMATICS

2
distance/displacement speed/velocity Acceleration/deceleration
Quantity in motion distance/displacement speed/velocity Acceleration/deceleration

3
Distance and displacement
Distance: the length of the path between two point. Displacement: The straight distance from the initial position to final position. The change in position. Displacement is the straight distance in a specified direction. scalar vector

4
r A B

5
Speed and velocity scalar vector

6
Instantaneous speed and average speed
Instantaneous Speed - speed at any given instant in time. Average Speed - average of all instantaneous speeds; found simply by a distance/time ratio.

7
The rate of change in velocity.
Acceleration deceleration The rate of change in velocity.

8
The definition of acceleration means that something is accelerating if its velocity changes,
Since velocity includes speed and direction, Then something is accelerating if its speed, its direction or both change.

9
Distance—time graph for object moving in a uniform speed
D-t graph for two objects moving in uniform speed, VA>VB D-t graph for a object moving in a uniform acceleration Velocity—time graph for a object moving in a uniform acceleration V-t graph for two objects moving in uniform acceleration, aA>aB

10
continued There are three parts to the journey shown on the left.
Moving at a steady speed, slowly Not moving for quite some time Moving again, but at higher speed .

11
VELOCITY

12
A Road test report gives the following data for a standing start acceleration test on a Car:
t/s 5 10 15 20 25 30 35 40 v/(m/s) 14 24 34 37 39 Draw a velocity-time graph for the test. What is the displacement of the car when it has reached a speed of (Ⅰ)25m/s (Ⅱ) 35m/s (c) Find (Ⅰ)the acceleration of the car when its speed is 30m/s (Ⅱ) the car’s maximum acceleration
 Draw a velocity-time graph for the test. What is the displacement of the car when it has reached a speed of (Ⅰ)25m/s (Ⅱ) 35m/s. (c) Find (Ⅰ)the acceleration of the car when its speed is 30m/s (Ⅱ) the car’s maximum acceleration.")
13
A B C D E A: acceleration B: faster constant speed C: deceleration D: stationary E: slower constant speed

14
continued Describe three parts to the journey shown on the left. Moving at a steady acceleration, slowly Moving at a constant velocity Accelerating, but at higher acceleration . VELOCITY

15
V-t Graphs for the sky-diver
With parachute Air resistance can’t be ignored. The horizontal velocity is negligible.

16
The forces on the sky-diver

17
Terminal Velocity The parachutist is now falling fast enough for the air resistance to equal her weight. This means that the forces on her are in balance, so her speed stops increasing and stays constant - she has reached her terminal velocity.

18
V-t Graphs for the sky-diver

19
As part of an aerobatic display, a skydriver jumps out of an aeroplane and falls towards the ground. She does not open her parachute until she reaches her terminal velocity. (i) Explain why she reaches a terminal velocity. (ii)Given that she can not change her height during the fall, explain how she could reach a higher terminal velocity.
 Explain why she reaches a terminal velocity. (ii)Given that she can not change her height during the fall, explain how she could reach a higher terminal velocity.")
20
Describe and explain what is happening between 40s and 60s.
She could make her shape more streamline in order to reduce her air resistance.

21
Terminal Velocity (Around 200km/h in this position - he can fall faster if he leans forward to go head first.)
")
22
Terminal Velocity---- dragonfly

23
Terminal Velocity

24
Terminal Velocity

25
How to measured instantaneous distance and speed?
Question 1.16 Ultrasonic displacement sensor Data-logger Light gate

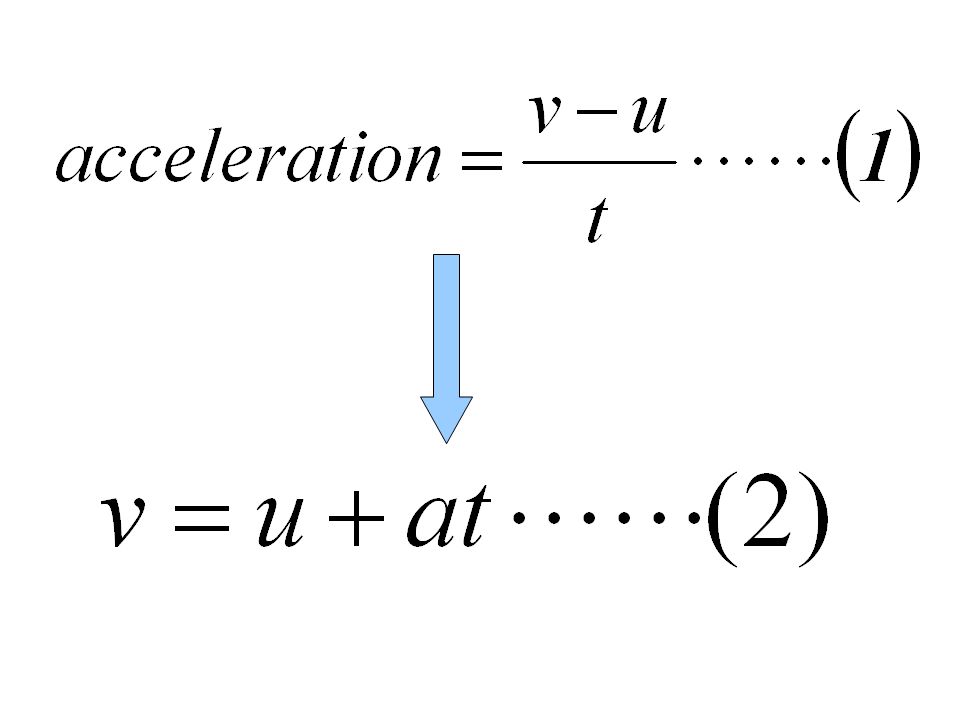
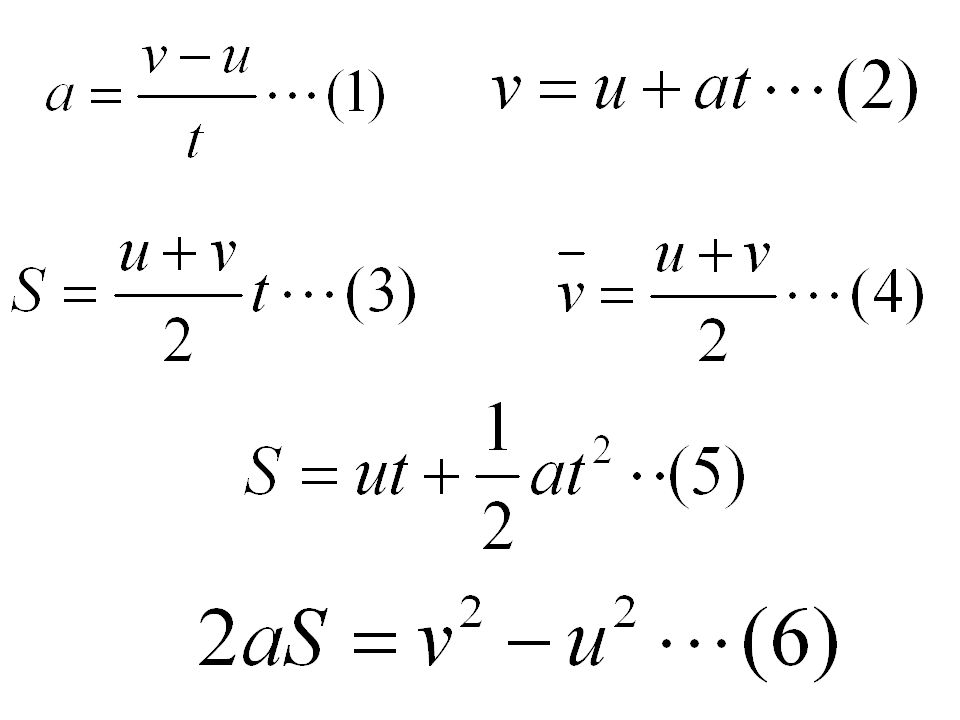
26
Motion Graph Formula

27
time Velocity u v t We can know the acceleration of the object by calculating the slope (gradient).
.")
29
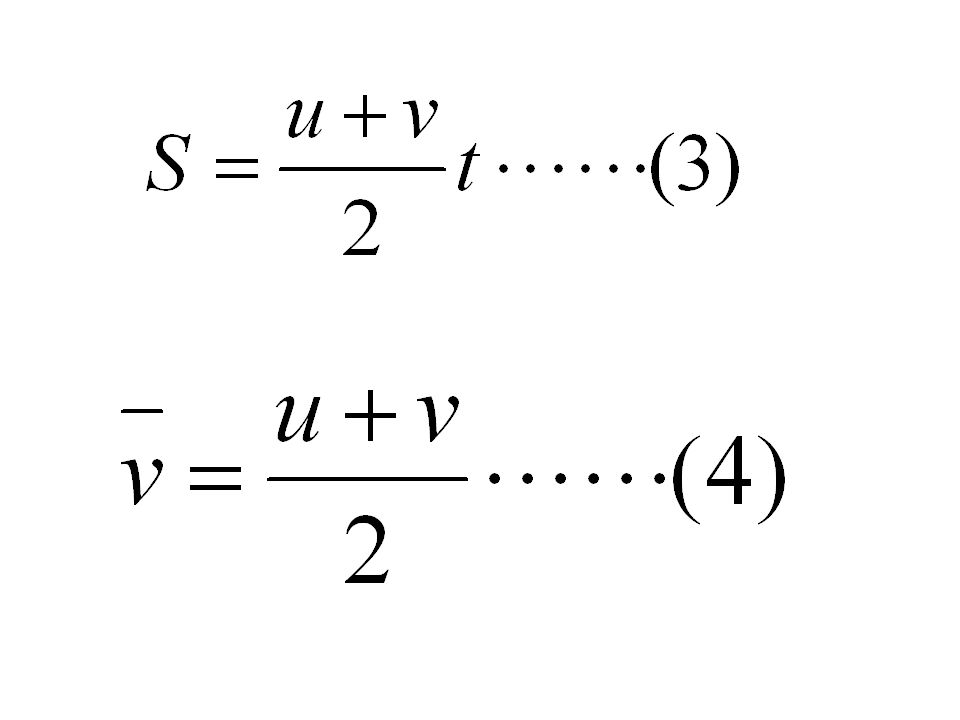
time Velocity u v t We can know the displacement of the object in time t by calculating the area under the graph.

31
time Velocity u v t

35
MOTION GRAPHS. If something is moving at a steady speed, it means we expect the same increase in distance in a given time. Time is increasing to the right, and distance is increasing steadily time. It moves at a steady speed.

36
CONSTANT SPEED. Both the lines below show that each object moved the same distance but the steeper yellow line got there before the other one. A steeper gradient indicates a larger distance moved in a given time. In other words, higher speed.

37
DISTANCE-TIME GRAPH SHOWING ACCELERATION.
The line below is curving upwards. This shows an increase in speed, since the gradient is getting steeper. In other words, in a given time, the distance the object moves is larger. It is accelerating..

38
V-t graph Velocity What’s motion for this object?

39
Describe these two motion .
VELOCITY

Similar presentations


 is defined as the rate of change of velocity. It has units of m/s 2 Acceleration can be positive, negative, or zero. An.>")


