Download presentation
Presentation is loading. Please wait.

1
Linear Kinematics

2
Kinematics Study of motion of objects without regard to the causes of this motion.

3
Linear Relationship between variables acted in the same plane.

4
Reference Point Zero location in a coordinate system or reference frame

5
Position Separation between object and a reference point.

6
Instantaneous Position Position of object at a specific time

7
Scalar Quantity that has only a magnitude or size. It is just a measurement.

8
Magnitude Size or measurement

9
Vector Quantity having both magnitude and direction.

10
Distance The separation between two points. A scalar quantity.

11
Displacement Change in position. A vector quantity.

12
Speed Ratio of distance to time

13
Velocity Ratio of change in position to time interval over which change takes place.

14
Instantaneous Velocity The velocity of an object at a specific point in time.

15
Initial Velocity Velocity of object at time: t=0 s or when recording starts.

16
Final Velocity The velocity of the object at the point of time in question or when recording stops.

17
Acceleration Change in velocity divided by time interval over which it occurred.

18
Instantaneous Acceleration The measurement of the acceleration of an object at a specific point in time.

19
Gravity The acceleration an object has towards the mass it is attracted.

20
Formulas

21
Position-time Graph Graph of object’s motion that shows how its position depends on time.

22
Velocity-time Graph Plot of velocity of object as a function of time.

24
moving with a constant, positive velocity is shown. A positive, constant velocity is represented by a line with constant slope (straight) and positive slope (upwards sloping).
 and positive slope (upwards sloping)..")
26
moving with a constant, negative velocity is shown. A negative, constant velocity is represented by a line with constant slope (straight)
.")
28
moving in the + dir'n and accelerating from a low velocity to a high velocity is shown. If the object is moving in the + dir'n, then the slope of a p-t graph would be +.

29
If the object is changing velocity from small to large values, then the slope must change from small slope to large slope.

31
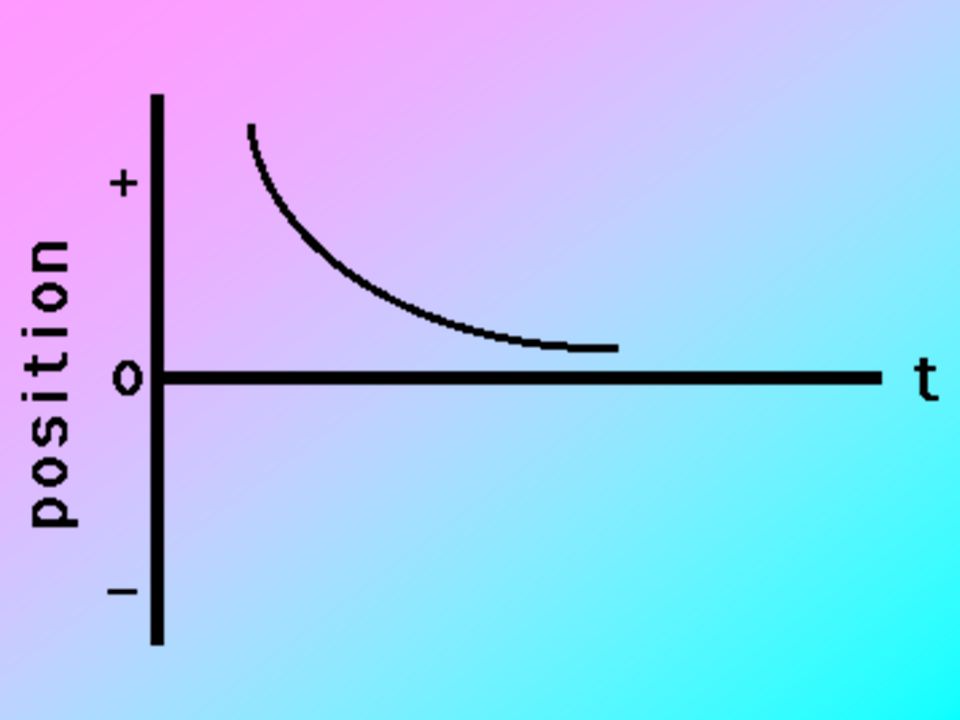
moving in the + dir'n and accelerating from a high velocity to a low velocity is shown. If the object is moving in the + dir'n, then the slope of a p-t graph would be +.

32
If the object is changing velocity from high to low values, then the slope must change from high slope to low slope.

34
moving in the - dir'n and accelerating from a high velocity to a low velocity is shown. If the object is moving in the - dir'n, then the slope of a p-t graph would be -.

35
If the object is changing velocity from high to low values, then the slope must change from high slope to low slope.

37
moving in the - dir'n and accelerating from a low velocity to a high velocity is shown. If the object is moving in the - dir'n, then the slope of a p-t graph would be -.

38
If the object is changing velocity from low to high values, then the slope must change from low slope to high slope.

40
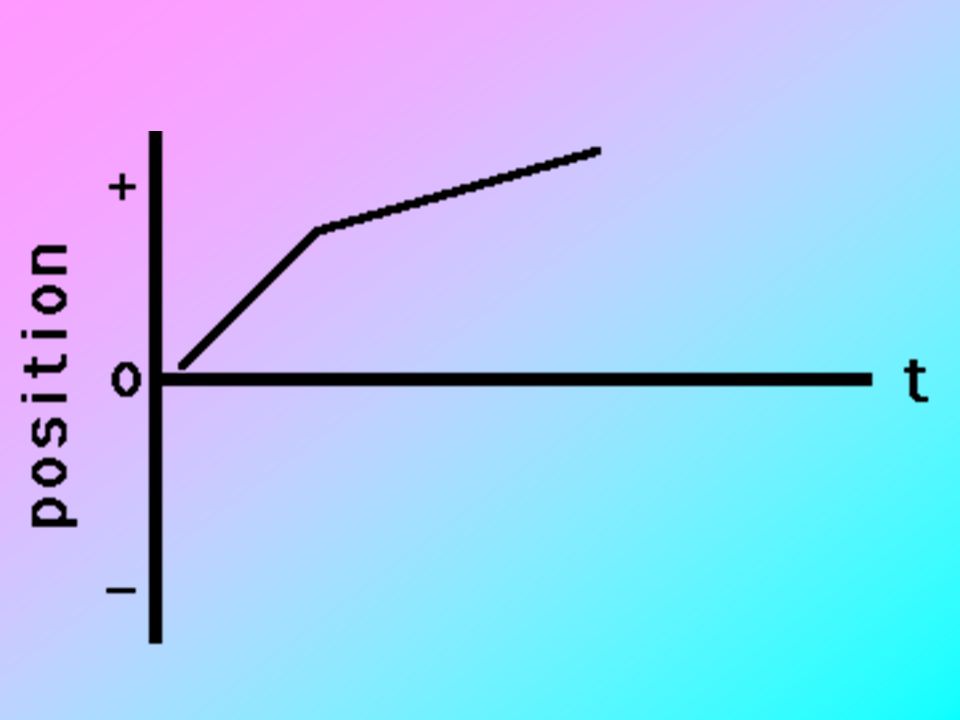
moving in the + dir'n with constant speed; first a slow constant speed and then a fast constant speed is shown. If an object is moving in the + dir'n, then the slope of the line on a p-t graph would be +.

41
At first, the line has a small slope (corresponding to a small velocity) and then the line has a large slope (corresponding to a large velocity).
 and then the line has a large slope (corresponding to a large velocity).")
43
moving in the + dir'n with constant speed; first a fast constant speed and then a slow constant speed is shown. If an object is moving in the + dir'n, then the slope of the line on a p-t graph would be +.

44
At first, the line has a large slope (corresponding to a large velocity) and then the line has a small slope (corresponding to a small velocity).
 and then the line has a small slope (corresponding to a small velocity).")
46
moving in the - dir'n with constant speed; first a slow constant speed and then a fast constant speed is shown. If an object is moving in the - dir'n, then the slope of the line on a p-t graph would be -.

47
At first, the line has a small slope (corresponding to a small velocity) and then the line has a large slope (corresponding to a large velocity).
 and then the line has a large slope (corresponding to a large velocity).")
49
moving in the - dir'n with constant speed; first a fast constant speed and then a slow constant speed is shown. If an object is moving in the - dir'n, then the slope of the line on a p-t graph would be -.

50
At first, the line has a large slope (corresponding to a large velocity) and then the line has a small slope (corresponding to a small velocity).
 and then the line has a small slope (corresponding to a small velocity).")
52
moves in the + direction at a slow constant speed and then in a - direction at a fast constant speed is shown. The object must first have a + slope

53
(corresponding to its + velocity) then it must have a - slope (corresponding to its - velocity). Initially, the slope is small (corresponding to a small velocity) and then the slope is large (corresponding to a large velocity).
 and then the slope is large (corresponding to a large velocity)..")
55
moves in the + direction at a fast constant speed and then in a - direction at a slow constant speed is shown. The object must first have a + slope (corresponding to its + velocity) then it must have a - slope
 then it must have a - slope.")
56
(corresponding to its - velocity). Initially, the slope is large (corresponding to a large velocity) and then the slope is small (corresponding to a small velocity).
 and then the slope is small (corresponding to a small velocity)..")
58
moves in the - direction at a slow constant speed and then in a + direction at a fast constant speed is shown. The object must first have a - slope (corresponding to its - velocity) then it must have a + slope
 then it must have a + slope.")
59
(corresponding to its + velocity). Initially, the slope is small (corresponding to a small velocity) and then the slope is large (corresponding to a large velocity).
 and then the slope is large (corresponding to a large velocity)..")
61
A velocity-time graph for an object moving with a constant speed in the positive direction is shown. To have "a constant speed in the positive direction" is to have a + velocity which is unchanging.

62
Thus, the line on the graph will be in the + region of the graph (above 0). Since the velocity is unchanging, the line is horizontal. Since the slope of a line on a v-t graph

63
is the object's acceleration, a horizontal line (zero slope) on a v-t graph is characteristic of a motion with zeo acceleration (constant velocity).
 on a v-t graph is characteristic of a motion with zeo acceleration (constant velocity).")
65
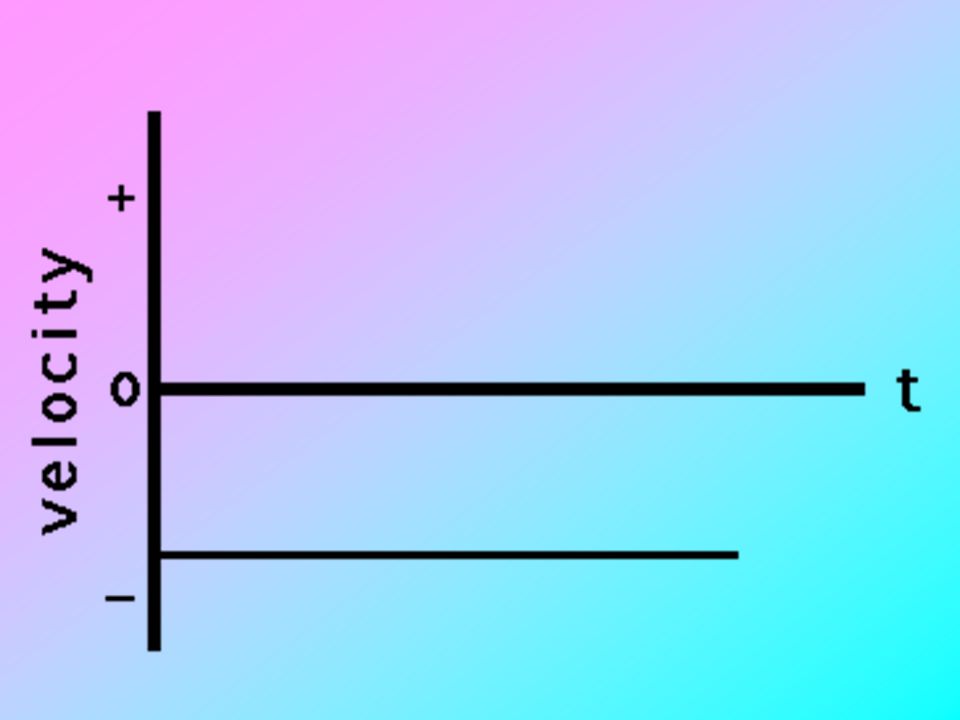
moving with a constant speed in the negative direction is shown. To have "a constant speed in the negative direction" is to have a - velocity which is unchanging.

66
Thus, the line on the graph will be in the - region of the graph (below 0). Since the velocity is unchanging, the line is horizontal. Since the slope of a line on a v-t graph

67
is the object's acceleration, a horizontal line (zero slope) on a v-t graph is characteristic of a motion with zeo acceleration (constant velocity).
 on a v-t graph is characteristic of a motion with zeo acceleration (constant velocity).")
69
an object which is at rest is shown. To be "at rest" is to have a zero velocity. Thus the line is drawn along the axis (v=0).
..")
71
moving in the + direction, accelerating from a slow speed to a fast speed is shown below. An object which is moving in the +

72
direction and speeding up (slow to fast) has a + acceleration. (If necessary, review the dir'n of the acceleration vector in the Physics Classroom.) Since
 Since.")
73
the slope of a line on a v-t graph is the object's acceleration, an object with + acceleration is represented by a line with + slope. Thus, the line is a straight diagonal line with upward (+) slope.
 slope..")
74
Since the velocity is +, the line is plotted in the + region of the v-t graph.

76
moving in the + direction, accelerating from a fast speed to a slow speed is shown. An object which is moving in the + direction and slowing down

77
(fast to slow) has a - acceleration. (If necessary, review the dir'n of the acceleration vector in the Physics Classroom.) Since the slope of a line on a v-t
 Since the slope of a line on a v-t.")
78
graph is the object's acceleration, an object with - acceleration is represented by a line with - slope. Thus, the line is a straight diagonal line with downward (-) slope. Since the velocity is +, the line is plotted in the + region of the v-t graph.
 slope. Since the velocity is +, the line is plotted in the + region of the v-t graph..")
80
moving in the - direction, accelerating from a slow speed to a fast speed is shown. An object which is moving in the - direction and speeding up (slow to fast) has a -
 has a -.")
81
acceleration. (If necessary, review the dir'n of the acceleration vector in the Physics Classroom.) Since the slope of a line on a v-t graph is the object's acceleration, an object with -
 Since the slope of a line on a v-t graph is the object s acceleration, an object with -.")
82
acceleration is represented by a line with - slope. Thus, the line is a straight diagonal line with downward (-) slope. Since the velocity is -, the line is plotted in the - region of the v-t graph.
 slope. Since the velocity is -, the line is plotted in the - region of the v-t graph..")
84
moving in the - direction, accelerating from a fast speed to a slow speed is shown. An object whgich is moving in the - direction and slowing down (fast to slow) has a +
 has a +.")
85
acceleration. (If necessary, review the dir'n of the acceleration vector in the Physics Classroom.) Since the slope of a line on a v-t graph is the object's acceleration, an object with + acceleration is represented by a line with + slope.
 Since the slope of a line on a v-t graph is the object s acceleration, an object with + acceleration is represented by a line with + slope..")
86
Thus, the line is a straight diagonal line with upward (+) slope. Since the velocity is -, the line is plotted in the - region of the v-t graph.

88
first moves with a slow, constant speed in the + direction, and then with a fast constant speed in the + direction is shown below. Since there are two parts of this object's motion, there will be two distinct parts on the

89
graph. Each part is in the + region of the v-t graph (above 0) since the velocity is +. Each part is horizontal since the velocity during each part is constant

90
(constant velocity means zero acceleration which means zero slope). The second part of the graph will be higher since the velocity is greater during the second part of the motion.

92
first moves with a fast, constant speed in the + direction, and then with a slow constant speed in the + direction is shown. Since there are two parts of this object's motion, there will

93
be two distinct parts on the graph. Each part is in the + region of the v-t graph (above 0) since the velocity is +. Each part is horizontal since the velocity during each part is constant
 since the velocity is +. Each part is horizontal since the velocity during each part is constant.")
94
(constant velocity means zero acceleration which means zero slope). The first part of the graph will be higher since the velocity is greater during the first part of the motion.

96
first moves with a constant speed in the + direction, and then moves with a positive acceleration is shown. Since there are two parts of this object's motion, there will be two distinct parts on the graph.

97
Each part is in the + region of the v-t graph (above 0) since the velocity is +. The slope of the first part is zero since constant velocity means zero acceleration and zero acceleration is represented

98
by a horizontal line on a v-t graph (slope = acceleration for v-t graphs). The second part of the graph is an upward sloping line since the object has + acceleration (again, the slope = acceleration for v-t graphs)
.")
100
first moves with a constant speed in the + direction, and then moves with a negative acceleration is shown. Since there are two parts of this object's motion, there will be two distinct parts on the graph.

101
Each part is in the + region of the v-t graph (above 0) since the velocity is +. The slope of the first part is zero since constant velocity means zero acceleration and zero acceleration is represented

102
by a horizontal line on a v-t graph (slope = acceleration for v-t graphs). The second part of the graph is an downward sloping line since the object has - acceleration (again, the slope = acceleration for v-t graphs)
.")
Similar presentations


 Displacement occurs during some.>")


 graph is equal to the: A. acceleration B. distance travelled C. time interval.>")


