Download presentation
Presentation is loading. Please wait.

1
“How To” Derive the Economic Impact of the Health Sector

2
“How to” Derive the Economic Impact of the Health Sector MAIN OBJECTIVE: Derive the direct economic impact and total economic impact of the five health sectors and the total health sector

3
Overview Create the Economic Impact of a Sample County Derive the data from the IMPLAN program Create a Shadow Industry (Hospitals) Modify IMPLAN data (Pharmacies) Derive the Local Retail Sales Capture Ratio The Total Economic Impact of the Health Sector Use of Health Sector Impact tool in Community Health Planning Mold the model for YOUR STATE
 Modify IMPLAN data (Pharmacies) Derive the Local Retail Sales Capture Ratio The Total Economic Impact of the Health Sector Use of Health Sector Impact tool in Community Health Planning Mold the model for YOUR STATE")
4
Create the Economic Impact of a Sample County What we are trying to accomplish: To complete the Health Sector Impact Table

5
Sample County Health Sector Impact on Employment and Income, Retail Sales and Sales Tax Employment IncomeRetail Sales IMPLANIMPLAN 1 Cent Type III Total Type III TotalRetail Sales Tax Health SectorsEmployed MultiplierImpactIncomeMultiplier Impact Sales Collection Hospitals (492) _____ __________ _____ _____ _____ _____ _____ Physicians, Dentists, and Other Professionals (490) _____ __________ _____ _____ _____ _____ _____ Nursing & Protective Care (491) _____ __________ _____ _____ _____ _____ _____ Other Medical & Health Services (493) _____ __________ _____ _____ _____ _____ _____ Pharmacies (455) _____ __________ _____ _____ _____ _____ _____ Total _____ _____ _____ _____ _____ _____
 _____ __________ _____ _____ _____ _____ _____ Physicians, Dentists, and Other Professionals (490) _____ __________ _____ _____ _____ _____ _____ Nursing & Protective Care (491) _____ __________ _____ _____ _____ _____ _____ Other Medical & Health Services (493) _____ __________ _____ _____ _____ _____ _____ Pharmacies (455) _____ __________ _____ _____ _____ _____ _____ Total _____ _____ _____ _____ _____ _____")
6
Data needed to complete the Health Sector Impact Table: For all five Health Sectors NEED:Type III Employment Multipliers Type III Income Multipliers Employment Personal Income (Includes employee compensation & proprietor income)
")
7
Data Needed For the Sample County Local Retail Sales Capture Ratio (Derived from total personal income and local retail sales collections)
")
8
‘HOW TO” derive the data from the IMPLAN program START IMPLAN Select Start Select Programs Select IMPLAN Professional 2.0 Select IMPLAN Professional 2.0

10
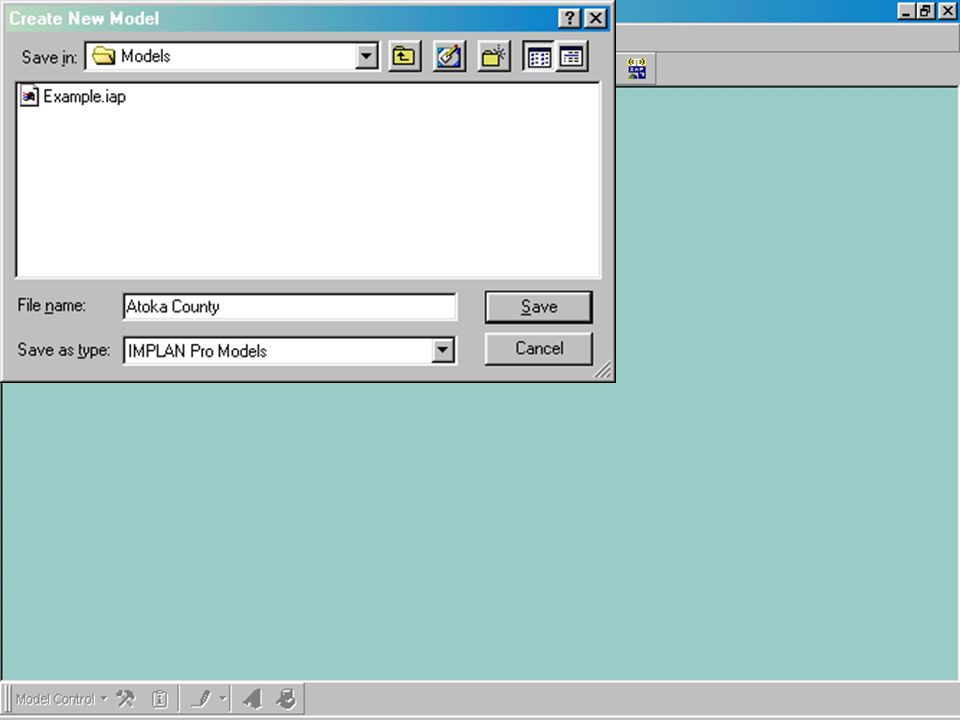
BUILD THE STUDY AREA Select “File” Select “New Model” Select “File Name” Type in the county name as the file name Select “Save”

12
Select the IMPLAN File Next Screen Pops Up - "Select Region" Select "Drives," Select (CD-ROM Drive) Select "Directory Info Box" Select "Available IMPLAN Data Files" Select "County File" Select "Continue"
 Select Directory Info Box Select Available IMPLAN Data Files Select County File Select Continue ")
14
STUDY AREA IS BUILT WAIT until County Study Area is built Study Area is built! OK

16
CONSTRUCT THE MODEL Select "Construct Model" Select from "Model Construction" Options “Advanced” “Production Functions” “ByProducts” “Trade Flows” “Institutional Transfers” “Multipliers” Select ”Type III (CPPM)"
 ")
20
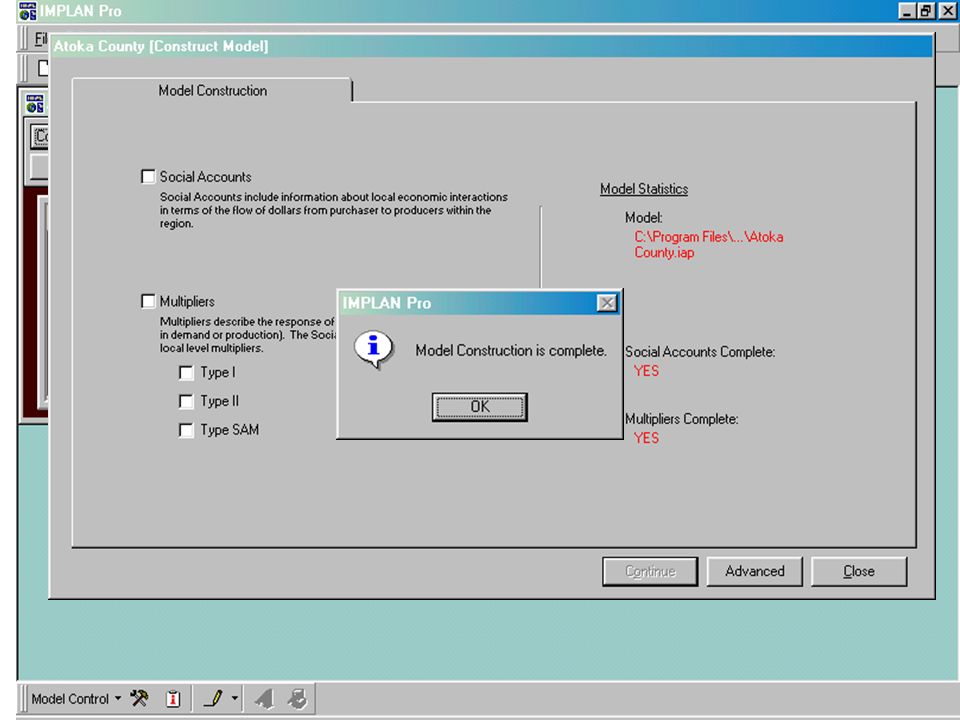
COMPLETE CONSTRUCTION MODEL WAIT until Model is constructed “Model Construction is Complete.” Select "OK" Select "Close"

22
REPORT RESULTS (Download Reports) Select “Reports…” Select “1: Study Area” “Output, VA, Employment” To Download, Select "To File" Select “Tab Delimited” Select "Continue" "Enter Location to Save Report File" will pop up. Select "File Name" Type a file name Select "Save"

25
REPORTS For next report, download “6. Multipliers” “Labor Income” For next report, download “6: Multipliers” “Employment” When finished downloading, Select "Close"

28
Run State IMPLAN Model 1.Build a Study Area of the STATE (Follow Instructions to “Build a Study Area”) 2.Construct the STATE Model 3.Report the STATE results a. Need "Output, VA, Employment” Report ONLY b. Download results. Name file

29
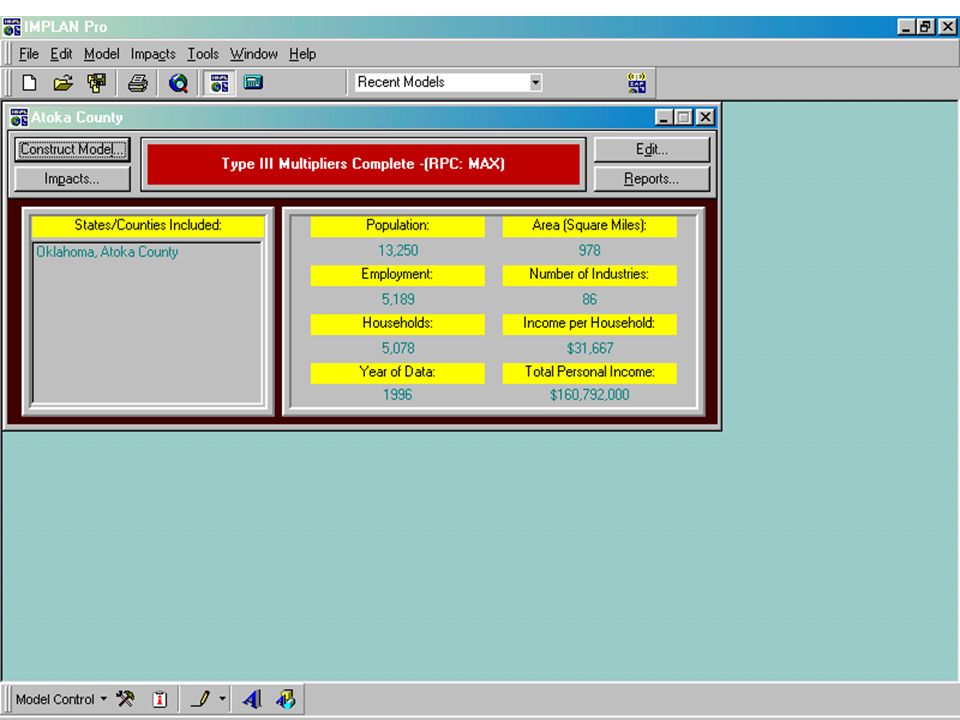
Summary of data completed from above steps: Atoka County – Employment – Type III Multipliers - Report Atoka County – Labor Income – Type III Multipliers - Report Atoka County – Output, VA, Employment - Report Oklahoma – Output, VA, Employment - Report

30
EXCERPTS from the IMPLAN Data Reports: Atoka County - Type III EMPLOYMENT MULTIPLIERS for Five Health Sectors DirectIndirectInduced Total Type I Type III Sector Effects Effects Effects Effects MultiplierMultiplier Miscellaneous Retail 455 42.440136 0.975899 20.029514 63.445549 1.022995 1.494942 Doctors, Dentists and Other Medical Professionals 490 13.558041 3.059330 7.666243 24.283614 1.225647 1.791086 Nursing and Protective Care 491 41.137875 2.270790 20.026114 63.434778 1.055200 1.542004 Hospitals 492 0.0000000.000000 0.000000 0.000000 0.000000 0.000000 Other Medical and Health Services 493 22.775555 2.469120 11.646356 36.891030 1.108411 1.619764

31
EXCERPTS from the IMPLAN Data Reports: Atoka County - Type III LABOR INCOME MULTIPLIERS for Five Health Sectors DirectIndirectInduced Total Type I Type III Sector Effects Effects Effects Effects MultiplierMultiplier Miscellaneous Retail 455 0.550883 0.0217400.3126510.8852741.039464 1.607009 Doctors, Dentists and Other Medical Professionals 490 0.53110310.0612000.1196660.7119691.115231 1.340548 Nursing and Protective Care 491 0.5422670.0427610.3125980.8976271.078857 1.655321 Hospitals 492 0.0000000.000000 0.000000 0.000000 0.000000 0.000000 Other Medical and Health Services 493 0.3772850.0506050.1817940.6096841.134131 1.615979

32
EXCERPTS from the IMPLAN Data Reports: Atoka County - Output, VA, Employment for Five Health Sectors OtherIndirect Industry EmployeeProprietorPropertyBusiness Total IndustryOutput*EmploymentCompensation* Income*Income* Tax*Value Added* Miscellaneous Retail 455 4.408 187 1.759 0.670 0.554 0.710 3.692 Doctors, Dentists and Other Medical Professionals 4904.924 67 2.114 0.501 0.228 0.031 2.874 Nursing and Protective Care 4914.659 192 2.121 0.405 0.079 0.053 2.657 Hospitals 4920.000 00 0.000 0.000 0.000 0.000 0.000 Other Medical and Health Services 493 6.312 144 1.826 0.556 0.357 0.049 2.788 * Millions of Dollars

33
EXCERPTS from the IMPLAN Data Reports: State of Oklahoma - Output, VA, Employment for Five Health Sectors OtherIndirect Industry EmployeeProprietorPropertyBusiness Total IndustryOutput*EmploymentCompensation* Income*Income* Tax*Value Added* Miscellaneous Retail 455 1,431.035 63,250 561.822 226.544 179.903 230.450 1,198.719 Doctors, Dentists and Other Medical Professionals 490 2,870.086 31,765 1,464.537 198.668 145.128 19.546 1,827.879 Nursing and Protective Care 491 806.178 30,662 399.372 56.848 14.184 9.504 479.908 Hospitals 492 2,364.065 42,947 1,255.026 170.338 81.166 4.328 1,510.859 Other Medical and Health Services 493 1,415.471 27,371 517.849 90.668 91.325 12.627 712.469 * Millions of Dollars

34
Apply Data to Health Sector Impact Table Insert the IMPLAN data in the Health Sector Impact Table, as follows:

35
Sample County: Atoka County Health Sector Impact on Employment and Income, Retail Sales and Sales Tax Employment Income Retail Sales IMPLANIMPLAN 1 Cent Type III Total Type III TotalRetail Sales Tax Health SectorsEmployed Multiplier ImpactIncomeMultiplier Impact SalesCollections Hospitals (492) _____ ____ _____ _____ ____ _____ _____ _____ Physicians, Dentists, and Other Professionals (490) 67 1.79 _____ $2,615,000 1.34 _____ _____ _____ Nursing & Protective Care (491) 192 1.54 _____ $2,526,000 1.66 _____ _____ _____ Other Medical & Health Services (493) 144 1.62 _____ $2,382,000 1.62 _____ _____ _____ Pharmacies (455) _____ 1.49 _____ _____ 1.61 _____ _____ _____ Total _____ _____ _____ _____ _____ _____
 _____ ____ _____ _____ ____ _____ _____ _____ Physicians, Dentists, and Other Professionals (490) _____ $2,615, _____ _____ _____ Nursing & Protective Care (491) _____ $2,526, _____ _____ _____ Other Medical & Health Services (493) _____ $2,382, _____ _____ _____ Pharmacies (455) _____ 1.49 _____ _____ 1.61 _____ _____ _____ Total _____ _____ _____ _____ _____ _____")
36
Missing Data Hospital Sector employment and income Hospital Sector Type III Multipliers for both employment and income Pharmacies (Derived from Sector 455) employment and income
 employment and income")
37
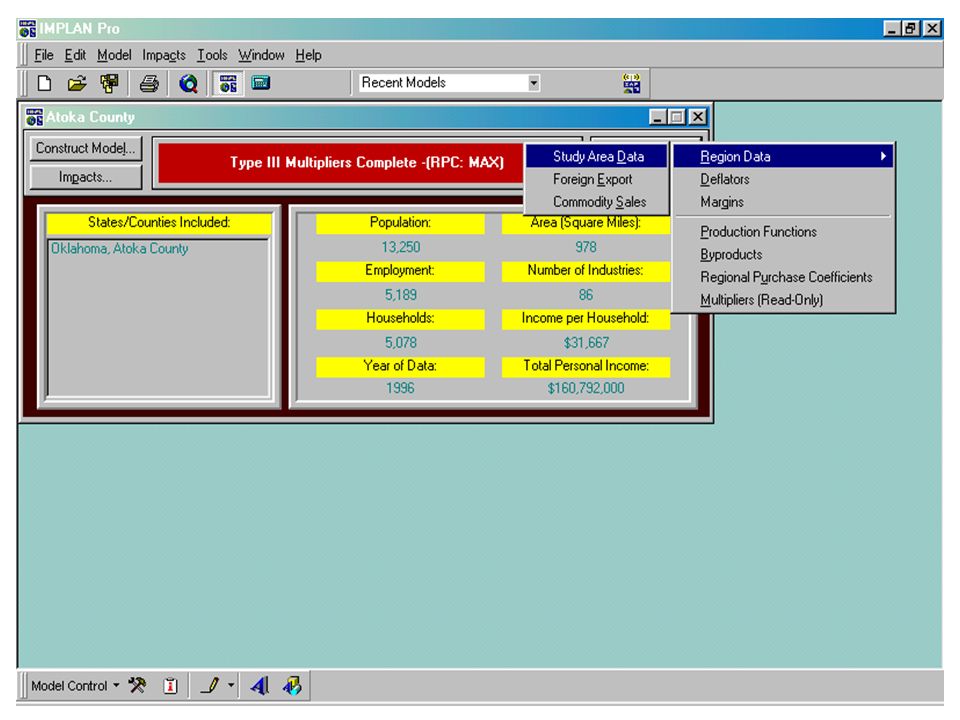
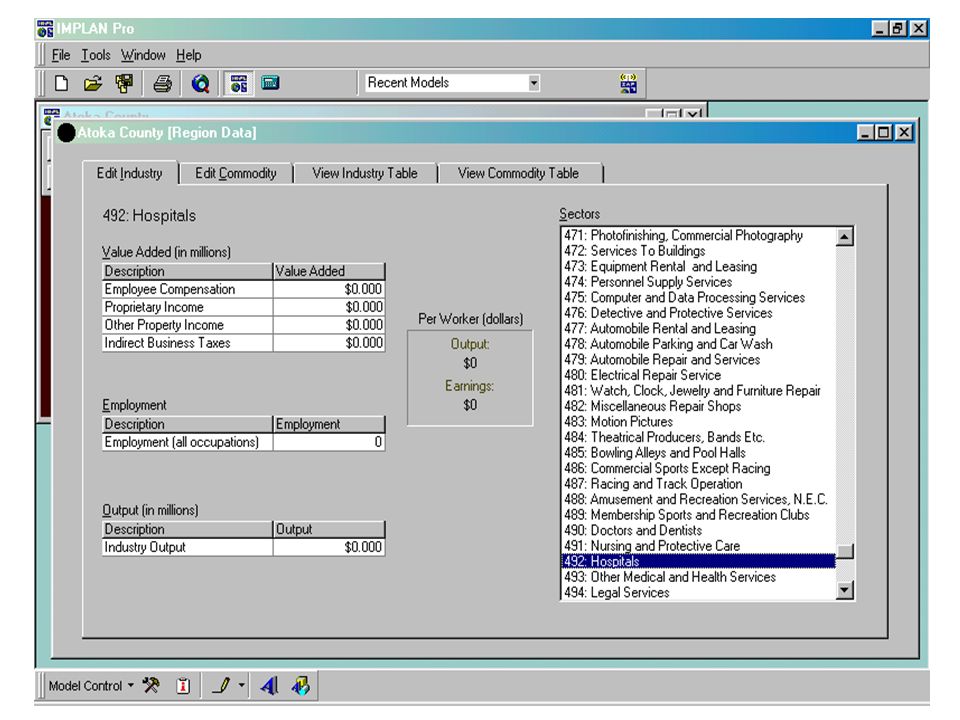
Create a Shadow Industry (Hospitals - Sector 492) In other words, develop a hospital sector industry to derive the Type III multipliers specifically for the missing hospital industry. From the existing Atoka County Model, create the shadow industry Start IMPLAN, Select “Open Existing Model,” Select “Atoka County” In the IMPLAN model ”Atoka County Type III Multipliers…" screen Select "Edit" "Region Data" “Study Area Data" Select "Sectors" - Arrow down to "492: Hospitals" All values are currently at -0-.

41
From Oklahoma Hospital Utilization Data Reports, actual data shows: Atoka County Hospital employment = 120 Type under "Employment" Atoka County Hospital payroll = $2,406,564 Type in "Employee Compensation" (converted to millions)
 ")
42
(Continued) To determine the Industry output for the Atoka County Hospital Sector (Sector 492), use the following formula: [State of OK Industry Output (Sector 492)/State of OK Employment (Sector 492)] x Atoka County Employment = Industry Output for Atoka County Hospital Sector
![(Continued) To determine the Industry output for the Atoka County Hospital Sector (Sector 492), use the following formula: [State of OK Industry Output (Sector 492)/State of OK Employment (Sector 492)] x Atoka County Employment = Industry Output for Atoka County Hospital Sector](http://images.slideplayer.com/22/6356878/slides/slide_42.jpg "(Continued) To determine the Industry output for the Atoka County Hospital Sector (Sector 492), use the following formula: [State of OK Industry Output (Sector 492)/State of OK Employment (Sector 492)] x Atoka County Employment = Industry Output for Atoka County Hospital Sector")
43
For Atoka County, calculate as follows: [2,364,065,000/42,947] x 120 = $6,605,532= $6.606 (Converted to millions) Type under "Industry Output" Select in upper right hand corner of Region Data Screen (Data from “Oklahoma – Output, VA, Employment” Report)
![For Atoka County, calculate as follows: [2,364,065,000/42,947] x 120 = $6,605,532= $6.606 (Converted to millions) Type under Industry Output Select in upper right hand corner of Region Data Screen (Data from Oklahoma – Output, VA, Employment Report)](http://images.slideplayer.com/22/6356878/slides/slide_43.jpg "For Atoka County, calculate as follows: [2,364,065,000/42,947] x 120 = $6,605,532= $6.606 (Converted to millions) Type under Industry Output Select in upper right hand corner of Region Data Screen (Data from Oklahoma – Output, VA, Employment Report)")
45
Screen will pop up "Data has been changed. The model is invalid until it is rerun!" Select

46
After inputting the shadow hospital industry (Sector 492), the model must be re-constructed. Select "Construct Model…" Select from "Model Construction" Options “Advanced” “Production Functions” “ByProducts” “Trade Flows” “Institutional Transfers” “Multipliers” Select ”Type III (CPPM)"
 .")
47
WAIT until Model is constructed Pop up Box, “Model Construction is Complete.” Select "OK" Select "Close"

48
Report Results Download Reports for Re-Constructed Atoka County Model for: Type III Employment Multipliers Type III Income Multipliers

49
Information from the Atoka County Revised Reports. Sector 492 Hospitals - Type III Employment Multiplier = 1.70 Sector 492 Hospitals - Type III Income Multiplier = 1.47 Also, use the hospital employment and income to complete the hospital sector information in the Health Sector Impact Table.

50
Sample County: Atoka County Health Sector Impact on Employment and Income, Retail Sales and Sales Tax Employment Income Retail Sales IMPLANIMPLAN 1 Cent Type III Total Type III TotalRetail Sales Tax Health SectorsEmployed Multiplier ImpactIncomeMultiplier Impact SalesCollections Hospitals (492) 120 1.70 $2,406,564 1.47 _____ _____ Physicians, Dentists, and Other Professionals (490) 67 1.79 _____ $2,615,000 1.34 _____ _____ _____ Nursing & Protective Care (491) 192 1.54 _____ $2,121,000 1.66 _____ _____ _____ Other Medical & Health Services (493) 144 1.62 _____ $1,826,000 1.62 _____ _____ _____ Pharmacies (455) _____ 1.49 _____ _____ 1.61 _____ _____ _____ Total _____ _____ _____ _____ _____ _____
 $2,406, _____ _____ Physicians, Dentists, and Other Professionals (490) _____ $2,615, _____ _____ _____ Nursing & Protective Care (491) _____ $2,121, _____ _____ _____ Other Medical & Health Services (493) _____ $1,826, _____ _____ _____ Pharmacies (455) _____ 1.49 _____ _____ 1.61 _____ _____ _____ Total _____ _____ _____ _____ _____ _____")
51
Modify the IMPLAN data (Pharmacies) A. Need Employment and Income for Pharmacies (or Drug stores and proprietary stores) B. Review Options for finding this data
 B. Review Options for finding this data.")
52
Data from County Business Patterns 1999 Oklahoma, U.S. Dept. of Commerce, Economics and Statistics Administration, Bureau of the Census Website: NOT ENOUGH DETAIL Need to find a Federal Depository Library Complete CD-ROM – 1999 County Business Patterns

53
OPEN CD-ROM SELECT LAUNCH BROWSER The Key to using the Launch Browser is in the Dimension Menu Zoom IN or Zoom OUT

54
To analyze the Pharmacies and Drug Stores Data: NAICS CODE Category 44-45 Retail trade 446 Health & personal care stores 4461 Health & personal care stores 44611 Pharmacies & drug stores 446110 Pharmacies & drug stores

55
Download from County Business Patterns 446110 NAICS Pharmacies and Drug Stores GIVEN: No. of Pharmacy Establishments by County Total No. of Establishments in the State Total Employment for the State Total Employee Compensation (Payroll) for the State All data for selected Counties (larger, more urban) NEED: Pharmacy Employment by County for ALL Counties Pharmacy Employee Compensation + Proprietor’s Income by County for ALL Counties
 for the State All data for selected Counties (larger, more urban) NEED: Pharmacy Employment by County for ALL Counties Pharmacy Employee Compensation + Proprietor’s Income by County for ALL Counties.")
56
NAICS CODE: 446110 Pharmacies and Drug Stores ATOKA COUNTY EXAMPLE 1999 1999 1999 Counties Counties Pharmacies & Drug StoresState WITH Data WITHOUT Data Totals Totals Totals No. of Establishments 606 460 146 Employment 7,645 6,516 1,129 Compensation $126,753,000 $108,083,000 $18,760,000

57
USE RATIOS TO ESTIMATE COUNTY DATA FOR MISSING EMPLOYMENT & EMPLOYEE COMPENSATION Average Employment = Per Pharmacy Total Employment WITHOUT Data Total # Pharmacies WITHOUT Data = 1,129 146 = 7.73 Average Number of Employees Per Pharmacy EMPLOYMENT

58
USE RATIOS TO ESTIMATE COUNTY DATA FOR MISSING EMPLOYMENT & EMPLOYEE COMPENSATION Average Payroll = Per Pharmacy Total Payroll WITHOUT Data Total # of Pharmacies WITHOUT Data = $18,670,000 146 = $127,877 Average Payroll Per Pharmacy EMPLOYEE COMPENSATION OR PAYROLL

59
APPLY RATIOS TO ATOKA COUNTY – Estimated Number of Pharmacy Employees GIVEN: No. of Pharmacies for Atoka County= 2 To estimate Number of Pharmacy Employees: Number of Atoka County Pharmacies x Average Number of Employees Per Pharmacy = 2 x 7.73= 15 ESTIMATED Number of Pharmacy Employees for Atoka County

60
APPLY RATIOS TO ATOKA COUNTY – Estimated Payroll or Employee Compensation GIVEN: No. of Pharmacies for Atoka County= 2 To estimate Payroll: Number of Atoka County Pharmacies x Average Payroll Per Pharmacy = 2 x $127,877= $255,754 ESTIMATED Payroll for Atoka County

61
APPLY RATIOS TO ATOKA COUNTY – Estimated Proprietor’s Income GIVEN: No. of Pharmacies for Atoka County= 2 To estimate Proprietor’s Income: Number of Atoka County Pharmacies x Average Proprietor’s Income Per Pharmacy = 2 x $85,000= $170,000 ESTIMATED Proprietor’s Income for Atoka County

62
APPLY RATIOS TO ATOKA COUNTY – Estimated Total Pharmacy Income To estimate Total Pharmacy Income: Atoka County ESTIMATED Payroll + Atoka County ESTIMATED Proprietor’s Income = $255,754$170,000= $425,754 ESTIMATED Total Pharmacy Income for Atoka County +

63
Insert the employment and income to the Pharmacy Sector and calculate the total impacts of the Health Sectors on the Health Sector Impact Table. Total Impact = Sector data x Type III multiplier

64
Sample County: Atoka County Health Sector Impact on Employment and Income, Retail Sales and Sales Tax Employment Income Retail Sales IMPLANIMPLAN 1 Cent Type III Total Type III TotalRetail Sales Tax Health SectorsEmployed MultiplierImpactIncomeMultiplier Impact SalesCollections Hospitals (492) 120 1.70 204 $2,406,564 1.47 $3,537,649 _____ Physicians, Dentists, and Other Professionals (490) 67 1.79 120 $2,615,000 1.34 $3,504,100 _____ _____ Nursing & Protective Care (491) 192 1.54 296 $2,526,000 1.66 $4,193,160 _____ _____ Other Medical & Health Services (493) 144 1.62233 $2,382,000 1.62 $3,858,840 _____ _____ Pharmacies (455) __16 1.49 24 $425,753 1.61 $685,463 _____ _____ Total 539877 $10,355,317 $15,779,212
 $2,406, $3,537,649 _____ Physicians, Dentists, and Other Professionals (490) $2,615, $3,504,100 _____ _____ Nursing & Protective Care (491) $2,526, $4,193,160 _____ _____ Other Medical & Health Services (493) $2,382, $3,858,840 _____ _____ Pharmacies (455) __ $425, $685,463 _____ _____ Total $10,355,317 $15,779,212")
65
Derive the Local Retail Sales Capture Ratio To calculate the amount of retail sales that is produced by the Health Sector, need to calculate the local retail sales capture ratio. Total Retail Sales (Sales Subject to Sales Tax)/Total Personal Income = Local Retail Sales Capture Ratio Atoka County Local Retail Sales Capture Ratio For Atoka County, the Local Retail Sales Capture Ratio = 40.37% (Retail Sales from OK State Tax Commission, "State Payments to Local Governments” and Total Personal Income from BEA data.)
/Total Personal Income = Local Retail Sales Capture Ratio Atoka County Local Retail Sales Capture Ratio For Atoka County, the Local Retail Sales Capture Ratio = 40.37% (Retail Sales from OK State Tax Commission, State Payments to Local Governments and Total Personal Income from BEA data.).")
66
Apply Local Retail Sales Capture Ratio to the Health Sector Impact Table. Multiply the Local Retail Sales Capture Ratio x the Total Income Impact for each Sector and sum the total From the Retail Sales, calculate a 1-cent sales tax, by multiplying.01 x Retail Sales for each Health Sector, and sum the total Insert the retail sales and sales tax in the Health Sector Impact Table. The Health Sector Impact Table is complete!!

67
Sample County: Atoka County Health Sector Impact on Employment and Income, Retail Sales and Sales Tax Employment Income Retail Sales IMPLANIMPLAN 1 Cent Type III Total Type III TotalRetail Sales Tax Health SectorsEmployed MultiplierImpactIncomeMultiplier Impact SalesCollections Hospitals (492) 120 1.70 204 $2,406,564 1.47 $3,537,649 $1,428,149 $14,281 Physicians, Dentists, and Other Professionals (490) 67 1.79 120 $2,615,000 1.34 $3,504,100 $1,414,605 $14,146 Nursing & Protective Care (491) 192 1.54 296 $2,526,000 1.66 $4,193,160 $1,692,779 $16,928 Other Medical & Health Services (493) 144 1.62 233 $2,382,000 1.62 $3,858,840 $1,557,814 $15,578 Pharmacies (455) __16 1.49 24 $425,753 1.61 $685,463 $276,721 $2,767 Total 539877 $10,355,317 $15,779,212 $6,370,068 $63,700
 $2,406, $3,537,649 $1,428,149 $14,281 Physicians, Dentists, and Other Professionals (490) $2,615, $3,504,100 $1,414,605 $14,146 Nursing & Protective Care (491) $2,526, $4,193,160 $1,692,779 $16,928 Other Medical & Health Services (493) $2,382, $3,858,840 $1,557,814 $15,578 Pharmacies (455) __ $425, $685,463 $276,721 $2,767 Total $10,355,317 $15,779,212 $6,370,068 $63,700")
68
The Total Economic Impact of the Health Sector Use of Health Sector Impact Tool in Community Health Planning 1.When working with a specific community, primary data are used. 2.The following table is given to the local steering committee to collect current local data. 3.The Health Sector Impact Table is then completed for presentation to the community.

69
Table 3 Direct Economic Activities of Health Sector in ___________ Community ComponentEstimated EmployeesEstimated Payroll Hospital (#)__________ Doctors and Dentists_________ _ Physicians (#) Dentists (#) Other Nursing & Protective Care (#)_________ _ Other Medical & Health Services_________ _ Home Health Care (#) County Health Department Pharmacies (#)_________ _ TOTALS_________ _ SOURCE: Local survey and estimated from research
__________ Doctors and Dentists_________ _ Physicians (#) Dentists (#) Other Nursing & Protective Care (#)_________ _ Other Medical & Health Services_________ _ Home Health Care (#) County Health Department Pharmacies (#)_________ _ TOTALS_________ _ SOURCE: Local survey and estimated from research")
70
Mold the model to fit for YOUR STATE Process must be modified, depending on available data in each State.

Similar presentations


 Estimates George K. Downey Understanding Regional Economic Data for Policy and Planning—Dallas, Texas September 8,>")