Download presentation
Presentation is loading. Please wait.

2
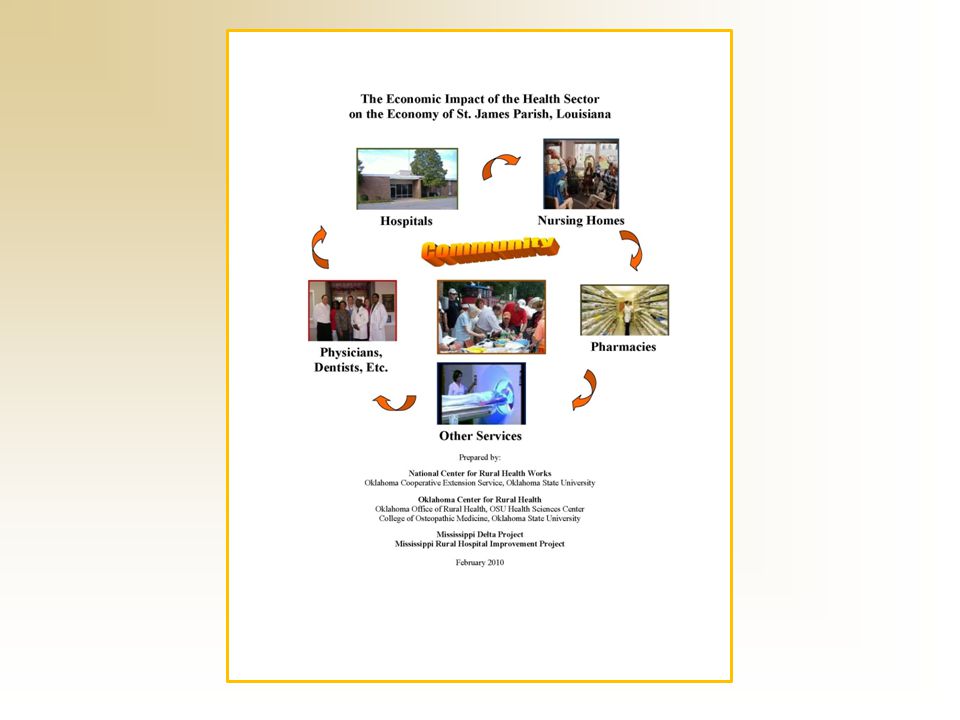
by: Gerald A. Doeksen, Regents Professor and Extension Economist Pamela S. Hartman, Extension Associate Cheryl F. St. Clair, Associate State Extension Specialist National Center for Rural Health Works Oklahoma Cooperative Extension Service Oklahoma State University (405) 744-6083 Mississippi Delta Project Mississippi Rural Hospital Improvement Project February 2010 The Economic Impact of the Health Sector on the Economy of St. James Parish, Louisiana
 Mississippi Delta Project Mississippi Rural Hospital Improvement Project February 2010 The Economic Impact of the Health Sector on the Economy of St. James Parish, Louisiana.")
4
What's the Economic Potential for Health Care in Your Community

5
Health Services Promote Job Growth

6
To attract business and industry, research indicates the area needs quality: Health services and Education services

7
To attract retirees, research indicates the area needs quality: Health services and Safety services

8
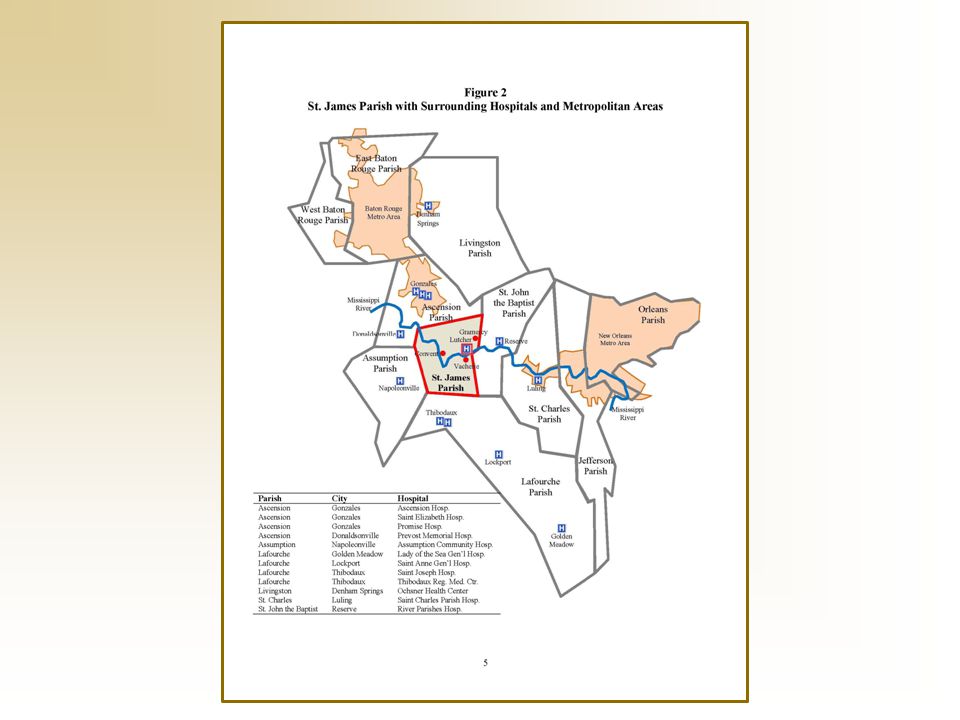
Overall objective: To measure the economic impact of the health sector on the economy of St. James Parish Specific objectives: 1.Review national health trend data; 2.Review demographic and economic data for St. James Parish and the State of Louisiana; 3.Summarize the direct economic activities of the health sector in St. James Parish; 4.Present concepts of community economics and multipliers; and 5.Estimate the economic impact of the health sector on St. James Parish.

9
Table 1 United States Health Expenditures and Employment Data 1990-2008; Projected for 2015 & 2018 United States Data TotalPer CapitaHealth Ave. Yrly. YearHealth as %SectorIncrease in Expenditures of GDPEmployment ($Billions)($)(%) (000) (%) 1990714.12,81412.3%7,8144.8% 20001,352.94,78913.6%10,8583.9% 20021,602.45,56415.1%11,5363.1% 20051,982.56,70115.7%12,3142.1% 20082,338.77,68116.2%13,4694.0% Projections 20153,541.310,92918.9% 20184,353.213,10020.3%
($)(%) (000) (%) , %7,8144.8% 20001,352.94, %10,8583.9% 20021,602.45, %11,5363.1% 20051,982.56, %12,3142.1% 20082,338.77, %13,4694.0% Projections 20153, , % 20184, , %.")
10
National Gross Domestic Product National Health Care Expenditures Type of Health Service Health Services 16.2% All Other Services 83.8% $2.3 trillion Nursing Home Prescription Drugs Other Hospital Care Figure 1. National Health Expenditures as a Percent of Gross Domestic Product and by Health Service Type, 2008 Physician Services 31% 21% 6% 10% 32%

11
Table 2 Census Population, Population Estimates, and Percent Changes for St. James Parish Cities and Towns, St. James Parish, and the State of Louisiana CensusEstimates10 Years 8 Years 199020002008'90-'00'00-'08 Gramercy town2,4123,0663,25427.1%6.1% Lutcher town3,9073,7353,464-4.4%-7.3% Balance of Parish14,56014,41514,513-1.0%0.7% St. James Parish20,87921,21621,2311.6%0.1% State of Louisiana4,219,9734,468,9764,410,7965.9%-1.3%

13
Table 3 Population, Projected Population and Projected Percent Changes for St. James Parish and the State of Louisiana CensusProjected Population 2000201020152020 St. James Parish21,21622,31023,02023,770 State of Louisiana4,468,9764,683,0304,840,1404,991,410 Percent Change 10 Years15 Years20 Years '00-'10'00-'15'00-'20 St. James Parish21,2165.2%8.5%12.0% State of Louisiana4,468,9764.8%8.3%11.7%

14
Table 4a Employment and Payroll for Health Services and Total Parish Services for St. James Parish and the State of Louisiana Employment BasedHealthTotalHealth Services onServicesParishas a % of Total NAICS * Employment Parish EmploymentState Employment 19993845,9666.4%14.6% 20003845,7076.7%14.6% 20013645,5606.5%14.7% 20023395,3956.3%15.5% 20033644,9777.3%15.8% 20043795,4017.0%16.0% 20054666,0137.7%16.4% 20064065,6347.2%15.9% 20074495,9037.6%15.7% % Change '99 - '07 16.9%-1.1%

15
Table 4b (Continued) Employment and Payroll for Health Services and Total Parish Services for St. James Parish and the State of Louisiana Payroll BasedHealth ServicesTotal ParishHealth Services onPayroll as a % of Total NAICS * ($1,000s) Parish PayrollState Payroll 19997,741210,5483.7%14.5% 20007,649212,5593.6%14.5% 20017,782216,8513.6%14.6% 20028,973220,0294.1%15.7% 20039,353193,7694.8%15.6% 200410,088227,8744.4%16.0% 200512,969295,9164.4%15.7% 200612,427301,2734.1%15.0% 200714,001338,9014.1%15.0% % Change '99 - '07 80.9%61.0%
 Parish PayrollState Payroll 19997,741210,5483.7%14.5% 20007,649212,5593.6%14.5% 20017,782216,8513.6%14.6% 20028,973220,0294.1%15.7% 20039,353193,7694.8%15.6% ,088227,8744.4%16.0% ,969295,9164.4%15.7% ,427301,2734.1%15.0% ,001338,9014.1%15.0% % Change %61.0%.")
16
Table 5 Direct Economic Activities of the Health Sector in St. James Parish, Louisiana Total Full- and Part-Total Payroll Time Employmentwith Benefits Hospital156$8,095,000 Physicians, Dentists & Other Medical Professionals82$5,037,687 Pharmacies/Durable Medical Equipment25$930,483 Other Health and Medical Services145$5,146,744 TOTALS408$19,209,914

17
Figure 2. Overview of County Economic System Households Industry Basic Goods & Services $ Labor Inputs Products Inputs $$ $ $ Services $$

18
Table 6 Impact of Health Sector Employment in St. James Parish, Louisiana Health SectorDirectSecondaryTotal ComponentImpactMultiplierImpact Hospitals1561.3148204 Physicians, Dentists & Other Medical Professionals821.2823105 Pharmacies/DME251.27732 Other Health & Medical Services1451.2739184 TOTALS408117525

19
Table 7a Economic Impact of the Health Sector Income in St. James Parish, Louisiana Health SectorDirect SecondaryTotal ComponentImpactMultiplierImpact Hospitals$8,095,000 1.23$1,861,850 $9,956,850 Physicians, Dentists & Other Medical Professionals$5,037,687 1.16$806,030 $5,843,717 Pharmacies/DME$930,483 1.20$186,097 $1,116,580 Other Health & Medical Services$5,146,744 1.25$1,286,686 $6,433,430 TOTALS$19,209,914$4,140,663$23,350,577

20
Table 7b (Continued) Economic Impact of the Health Sector Income in St. James Parish, Louisiana Health Sector Component Retail Sales One Cent Sales Tax Hospitals$1,045,469$10,455 Physicians, Dentists & Other Medical Professionals$613,590$6,136 Pharmacies/DME$117,241$1,172 Other Health & Medical Services$675,510$6,755 TOTALS$2,451,810$24,518

21
NEXT STEPS I. Community Health Engagement Process A. Where is the community now? B. Where does the community want to go? C. How will the community get there?

22
Community Health Engagement Process Process takes 90-120 days Involves community input Objective: Get community involved to plan community health services. Goal: Local people use local services Local people identify new services Local people strongly supporting local medical services

23
Getting Started Initiating Group Community Health Engagement

24
Getting Started Community Facilitator Resource Team Steering Committee Initiating Group Community Health Engagement

26
Getting Started Publicity Task Force Community Facilitator Resource Team Steering Committee Initiating Group Community Health Engagement

27
Getting Started Inventory Task Force Community Health Engagement Publicity Task Force Community Facilitator Resource Team Steering Committee Initiating Group

29
Getting Started Community Health Engagement Inventory Task Force Survey Task Force Publicity Task Force Community Facilitator Resource Team Steering Committee Initiating Group

31
Getting Started Community Health Engagement Inventory Task Force Survey Task Force Publicity Task Force Community Facilitator Resource Team Steering Committee Initiating Group Data & Info Task Force

33
Community Health Engagement Process Getting Started Implement Action Plan Develop Plan Follow-Up & Continuation Inventory Task Force Survey Task Force Publicity Task Force Community Facilitator Resource Team Steering Committee Initiating Group Data & Info Task Force

35
Community Feasibility Studies – BUDGETS Objective: Identify any that may aid the community in expanding health services Goal: If feasible, community decision if service will be implemented

36
Basic Methodology for Analyzing an Issue I. Estimate Needs II. Project Costs A.Capital or Start-Up Costs B.Annual Operating Costs III. Estimate Revenue IV. If Doesn't Break-Even, Other Source of Funds

37
Available Budget Studies Primary Care Physician OB/GYN Pediatrician EMS (Basic, Int., and Advanced) Emergency Medical Responder (EMR) Systems Outpatient Rehabilitation Adult Day Services Kidney Dialysis Assisted Living Facilities Community Health Centers Rural Health Clinics Specialty Physicians Others, as requested
 Emergency Medical Responder (EMR) Systems Outpatient Rehabilitation Adult Day Services Kidney Dialysis Assisted Living Facilities Community Health Centers Rural Health Clinics Specialty Physicians Others, as requested")
38
Web Site: www.ruralhealthworks.org H W Rural Health Works R National Center for

Similar presentations