Download presentation
Presentation is loading. Please wait.

1
Chapter 3 Economic Growth: Concepts and Patterns

2
Divergent Patterns of Economic growth
GDP per capita (1996 PPP) Y2003 Y1960 Average Annual growth rate Income as a share of US Income 1960 2003 Senegal 1818 1557 0.86 =86% -0.22 0.15 0.04 Botswana 958 8232 8.59 =859% 5.33 0.08 0.22
 Y2003. Y1960. Average Annual growth rate. Income as a share of US Income Senegal =86% Botswana =859%")
3
Factor Accumulation, Productivity Growth, and Economic Growth
Availability Productive Use Productivity Growth Efficiency Technological change Leads to major shifts in the composition of output

4
Factor accumulation

5
Productivity Growth

6
Saving, Investment, and Capital Accumulation
New Investment increases the capital stock The value of new investment must be larger than the amount of depreciation of existing capital. “Capital” can be physical capital, human capital, etc., that is, it can be machines, education, hospitals, etc.

7
Saving, Investment, and Capital Accumulation
Investment is financed by saving To produce goods that will produce other goods, we have to give up consumption (i.e., save) today. E.g., education involves staying out of the labor market for a while.
 today. E.g., education involves staying out of the labor market for a while.")
8
Saving, Investment, and Capital Accumulation
Saving comes from current income Household saving Corporate retained earnings Government surplus

9
Saving, Investment, and Capital Accumulation
Investment is uncertain: Investments in education only pay off if Complementary inputs exist You are allowed by the government to practice Your income is not taken by thugs Your skills remain useful throughout your life.

10
Saving, Investment, and Capital Accumulation
Sustaining economic growth requires both generating new investment and ensuring the investment is productive.

11
Growth Accounting 80-90 90-95 95-00 00-04 gY 3.3% 2.5% 4.2% 2.4% gL
United States Basic data for growth accounting 80-90 90-95 95-00 00-04 gY 3.3% 2.5% 4.2% 2.4% gL 1.7% 1.3% 1.9% -0.4% gK 4.9% 3.5% 5.8% 3.2% WK 0.29 0.30 a 0.6% 0.5% 1.1%

12
Growth Accounting a is the measure of Total Factor Productivity … and of our ignorance TFP plays less of a role than factor accumulation in developing countries (compared to industrial countries)
")
13
Characteristics of rapidly developing countries
Based on cross-country regressions: what are the determinants that makes countries growth differently? We don’t know exactly how these factors contribute to growth We don’t know which causes which.

15
Macroeconomic and political stability
Make investment more predictable Protect the poor

17
Better health and education make workers more productive:
They make businesses more likely to invest They make people more likely to save for the future

18
Better governance and rule of law, better bureaucracies and property rights, more effective and less burdensome regulation, less corruption: They make businesses more likely to invest They make people more likely to save for the future

23
Diminishing returns and the production function
Diminishing marginal product of capital Productivity gains typically do not have diminishing returns

25
Diminishing returns and the production function
Diminishing returns means that, ceteris paribus, new investment in a poor country will have a much larger impact on output than the same investment in a rich country. This means:

26
Diminishing returns and the production function
Ceteris paribus, poor countries have much larger growth potential. Ceteris paribus, growth will slow as a country gets richer Ceteris paribus, poor and rich countries will converge.

27
Diminishing returns and the production function
What is the ceteris that we are assuming to be paribus? Same production function Same technology Same saving rate If so, then growth is derived primarily from factor accumulation and not productivity growth

28
Ceteris paribus

29
Ceteris not paribus

30
Divergence?

31
Convergence in the OECD?

32
Convergence in countries with similar policies?

33
Structural Change How does the composition of output change?
Engel’s Law Share of Y produced by agriculture declines, industry and services get a bigger share. Share of Population in agriculture declines (but not as rapidly as the share of Ag in Y), industry and services get a bigger share.
, industry and services get a bigger share.")
34
Patterns of Development, 1950-1970, with Moises. Syrquin, 1975.

37
Structural Change How does the composition of output change?
Population becomes urbanized Why? Economies of scale; common resources for industrial production. Larger share is sold through markets rather than produced for own consumption

39
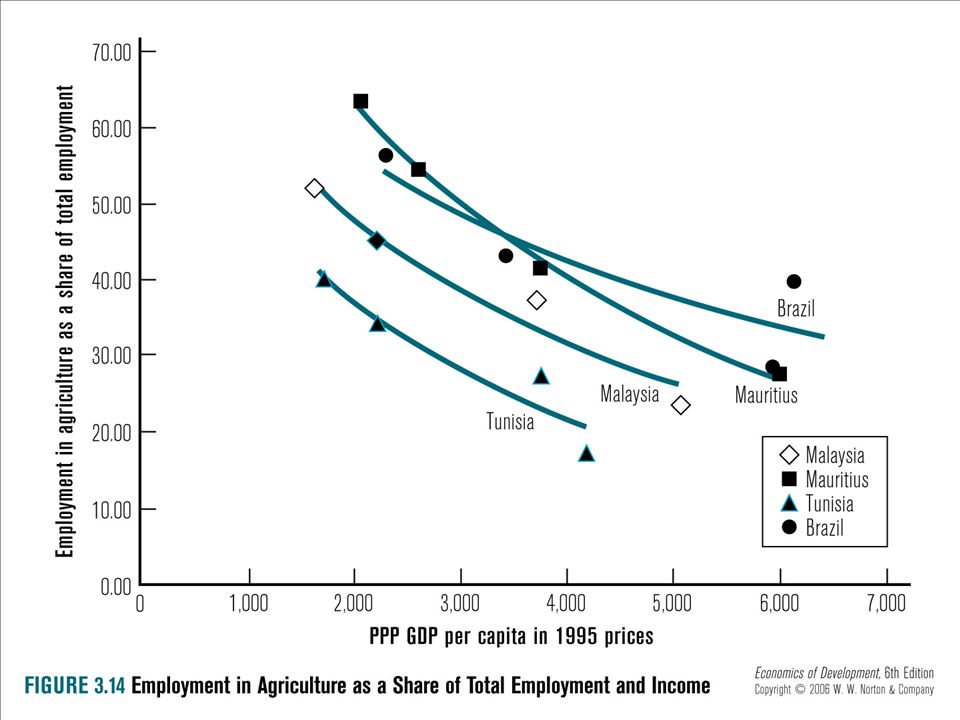
Structural Change Expansion of agricultural productivity is key to reducing the share of workers in agriculture.

Similar presentations


 The SGM doesn’t fit facts too well Saving and Investment Don’t.>")


 2.>")


