Download presentation
Presentation is loading. Please wait.

1
Unit III: Geography and Global Issues Population: Canada and the World

2
Introduction Geography is….? The study of the earth and its features and of the distribution of life on the earth, including human life and the effects of human activity. Two main areas of Geography: 1) Physical Geography Deals with natural features of the earth 2) Human Geography Focuses on Human interaction with the environment, and the effects of human activity on the environment We will focus, for now, on Human Geography
 Physical Geography Deals with natural features of the earth 2) Human Geography Focuses on Human interaction with the environment, and the effects of human activity on the environment We will focus, for now, on Human Geography.")
3
Vocabulary Towards the end of the Chapter we will have a vocabulary quiz using the following list of words: ALL bold words found in Chapter 13 There are a total of 25 words, don’t miss any!

4
Today’s Objectives explain the significance of changes in world population with reference to − population pyramids − distribution − density − demographic transition models interpret population pyramids and the demographic transition model

5
Human Population Population studies are one of the primary aspects of Human Geography How does the earths changing human population effect the environment ? Is human population increasing or decreasing? What parts of the world is human population increasing at the highest rate ? What is China’s population? What is Canada’s population? Which country has the world’s largest population? Which country will pass it by the year 2025?

6
Understanding Population Change Two useful tools we have that can help us understand causes/reasons for population change are: 1) Population Pyramids 2) Demographic Transition Model
 Population Pyramids 2) Demographic Transition Model")
7
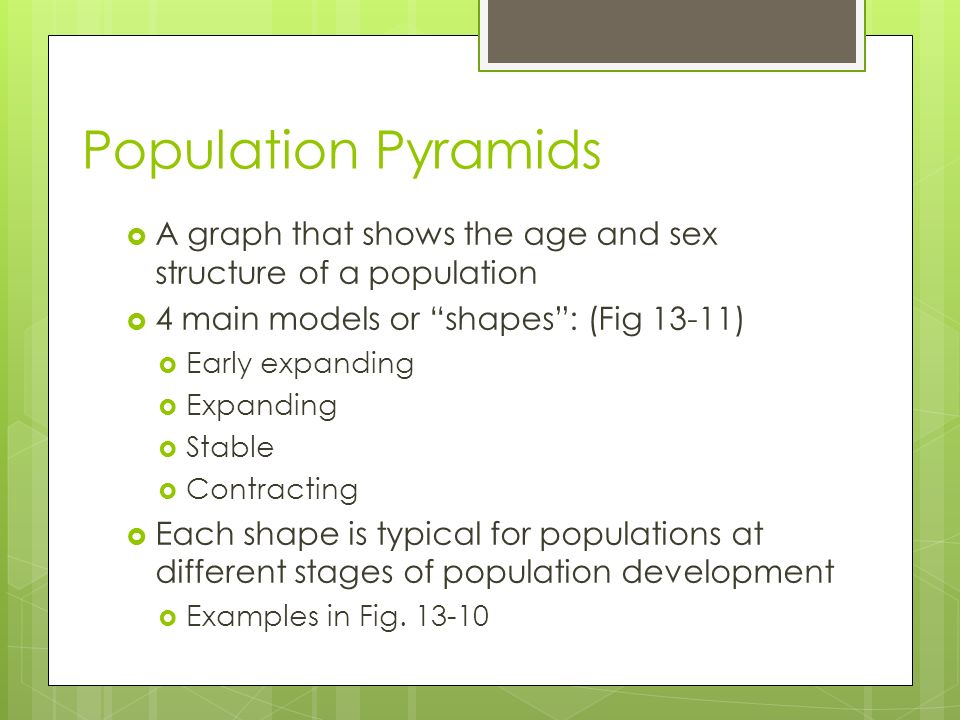
Population Pyramids A graph that shows the age and sex structure of a population 4 main models or “shapes”: (Fig 13-11) Early expanding Expanding Stable Contracting Each shape is typical for populations at different stages of population development Examples in Fig. 13-10
8
Population Pyramids

9
China Population Pyramid What pyramid model does China have? What do you notice about the male/female populations?

10
Canada Population Pyramid What pyramid model does Canada have? What difference do you notice between Canada and China?

11
Homework Make a list of the vocabulary words for chapter 13 and write the definitions Complete the handout and population pyramid from the package I give you

12
Birth rates/death rates crude birth rate : Calculated by dividing the number of births in 1 year by the population, then x1000 Ex. ) If Canada had 100,000 births in one year, birth rate would be approx. (100,000/35,000,000) x 1000 = 2.85 birth rate crude death rate : Calculated by dividing the number of deaths in 1 year by the population, then x1000 Subtracting deaths from births gives the rate of natural population increase
 If Canada had 100,000 births in one year, birth rate would be approx. (100,000/35,000,000) x 1000 = 2.85 birth rate crude death rate : Calculated by dividing the number of deaths in 1 year by the population, then x1000 Subtracting deaths from births gives the rate of natural population increase.")
13
Demographic Transition Model The demographic transition model shows changes over a period of time in three elements: Birth rates Death rates Trends in overall population numbers (natural population change)…does not include immigration/emigration Assumes countries will pass through periods of industrialization on the way to reduced birth and death rates Figure 13-8
…does not include immigration/emigration Assumes countries will pass through periods of industrialization on the way to reduced birth and death rates Figure 13-8")
14
Demographic Transition Model

15
Figure 13-8 and 13-9 Refer to your handout, and with a partner, try to answer the questions on Figure 13-9 We will look at this after 15 minutes Homework: Answer questions 1-4, Figure 13-13, page 327, and activity questions 1- 4, page 328.

16
Analyzing Population Data Distribution, Density, and Dependency Ratios

17
Today’s Objectives collect and analyse population data related to distribution density dependency ratio Describe possible responses to population growth

18
Age Structure of Population The age structure of a population helps us understand the reasons for population change Populations divided into: Children up to age of 15 Working adults from age 16-64 Adults age 65 and older This gives the dependency ratio, or proportion of the population being supported by the working age group

19
Age structure of Canada Children and older people put pressure on society for: Medical, education, housing, etc 1996: Canada population included: 21% children, 12% older adults, so… Dependency ratio of 33% This means one in every three people in Canada isn’t earning their own money

20
Age structure of other countries Consider a country with a much higher birth rate than Canada. What would happen to the dependency ratio? Much higher! Bangladesh = 53% (47% children, 6% 65+) What problems might arise in the future?
 What problems might arise in the future .")
21
China’s Solution How many of you have no brothers or sisters? As you probably know, in the late 1970’s, the Chinese government instituted the family planning, or one-child policy The hope was to eventually reduce the world’s largest population (Fig. 13-17, pg. 330) Advantages? More spending money, reduced pressure on environment, agriculture Disadvantages? Aging population, personal freedom compromised, female infanticide
 Advantages. More spending money, reduced pressure on environment, agriculture Disadvantages. Aging population, personal freedom compromised, female infanticide.")
22
China’s Aging Population

23
Where do 6 billion people live? Population distribution refers to the way people are spaced over the Earth’s Surface Ecumene is the part of the world that is permanently inhabited Approx. 35% of the world’s land area is not suitable for inhabitation About 50% of the world’s population lives on 5% of the land! About 90% of the world’s population lives on 20% of the land! 67% live within 500 km of the ocean (Figure 13-20, pg. 332)
.")
24
Population Distribution

25
Where are we all from? Figure 13-21, pg. 333 If all the people on Earth could be shrunk to 100 people, there would be: 57 Asians 21 Europeans 14 North/South Americans 8 Africans So where do you think most people on earth live?

26
Population Density Population density describes the number of people in a given area (Fig. 13-22, pg. 333) Crude densities are calculated by: Population ÷ Area Not necessarily useful, for example: Canada has a much lower population density than China, but a far greater percentage of Canadians live in large cities where population density is much higher Rural and Urban differ dramatically in most countries Many reasons for different countries pop. densities
 Crude densities are calculated by: Population ÷ Area Not necessarily useful, for example: Canada has a much lower population density than China, but a far greater percentage of Canadians live in large cities where population density is much higher Rural and Urban differ dramatically in most countries Many reasons for different countries pop. densities.")
27
Population Density

28
Factors affecting population density Physical factors and Human factors play a role in determining the density of world populations Take a look at Figure 13-23 on page 334.

29
Some more vocabulary Arable : land that can be used for farming Carrying capacity : the number of people that can be sustained by an area of land Nutritional density : measure of how much nutrition can be produced from an area of land (area of good growing conditions have higher nutritional density than areas with poor growing conditions)
")
30
Assignment Interpreting a diagram pg. 334, 1-2 Looking back, pg. 338, 5

Similar presentations


