Download presentation
Presentation is loading. Please wait.

1
Graph each inequality on a number line. 1. x > –5 2. y ≤ 0 3. Write –6x + 2y = –4 in slope-intercept form, and graph. y = 3x – 2 Warm-Up

2
Inequalities

3
Learning Targets Review Inequalities Review Inequalities Graphing Inequalities Graphing Inequalities Knowing where Possible Solutions Exist Knowing where Possible Solutions Exist Testing for Possible Solutions Testing for Possible Solutions

4
What is an Inequality? Definition: two expressions are not equal to one another. Definition: two expressions are not equal to one another.

5
Equality vs. Inequality

6
Number Lines Equalities on a number line: Equalities on a number line: Inequalities on a number line: -1 0 1

7
Graphically Equalities on a coordinate plane: Equalities on a coordinate plane: Inequalities on a coordinate plane:

8
Different Symbols… Different Lines/Points Solid Line, Filled Point Dashed Line, Hollow Point

9
Objective - To graph linear inequalities in the coordinate plane. Number LineCoordinate Plane -4 -3 -2 -1 0 1 2 3 4 y x x = 3

10
Number LineCoordinate Plane -4 -3 -2 -1 0 1 2 3 4 y x y = -2

11
Boundary Line Test a Point False! y x

12
y x Solid line If y = mx + b,

13
Why do we flip the sign? Pause and Ponder…

14
y x Dashed line If y = mx + b,

15
y x Solid line If y = mx + b,

16
y x Dashed line If y = mx + b, Write the inequality described by the graph below. -4 +3+3

17
Determine whether the given point is a solution to the inequality -2x + 3y < 9. 1) (2, -3) Yes, (2,-3) is a solution. 2) (3, 5) No, (3,5) is not a solution.
 (2, -3) Yes, (2,-3) is a solution. 2) (3, 5) No, (3,5) is not a solution..")
18
Problem If you have less than $5.00 in nickels and dimes, find an inequality and sketch a graph to describe how many of each coin you have. Let n = # of nickels Let d = # of dimes 0.05 n + 0.10 d < 5.00 or 5 n + 10 d < 500

19
nd 0 50 1000 0 10 20 30 40 50 60 70 80 90 100 n d 60 50 40 30 20 10 0

21
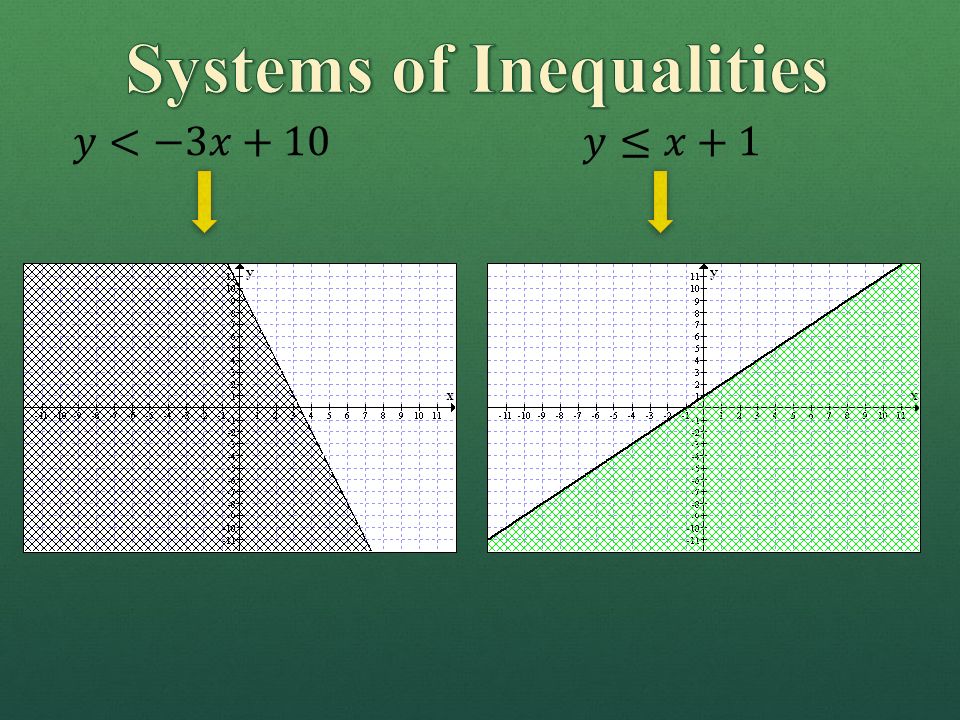
Graph both inequalities over each other: Therefore our answer lies in the combined shaded region:

22
Non linear Inequalities

23
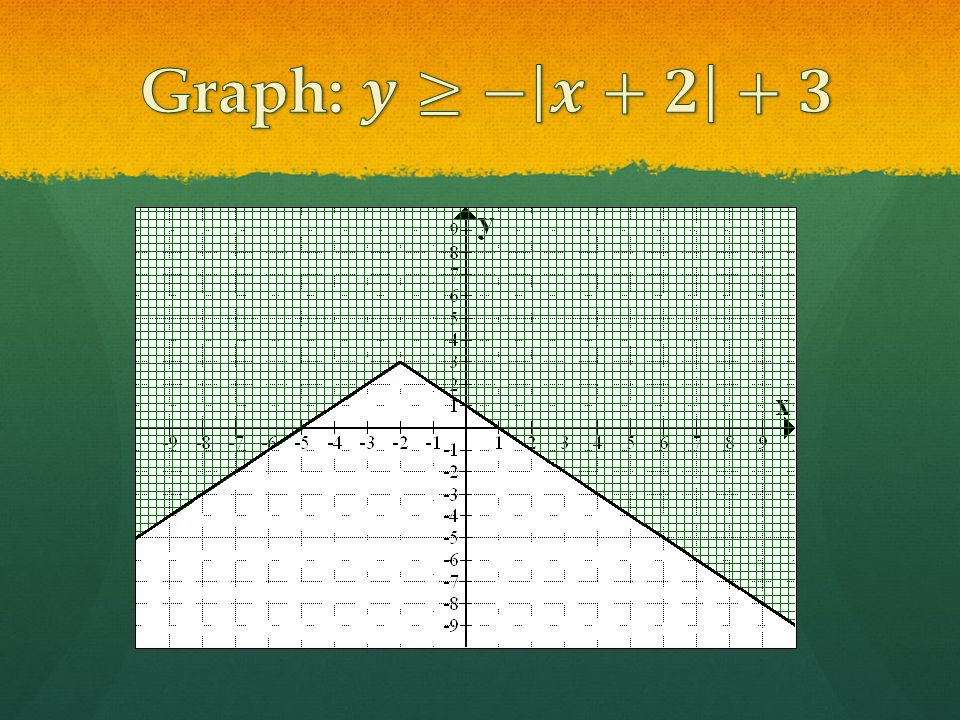
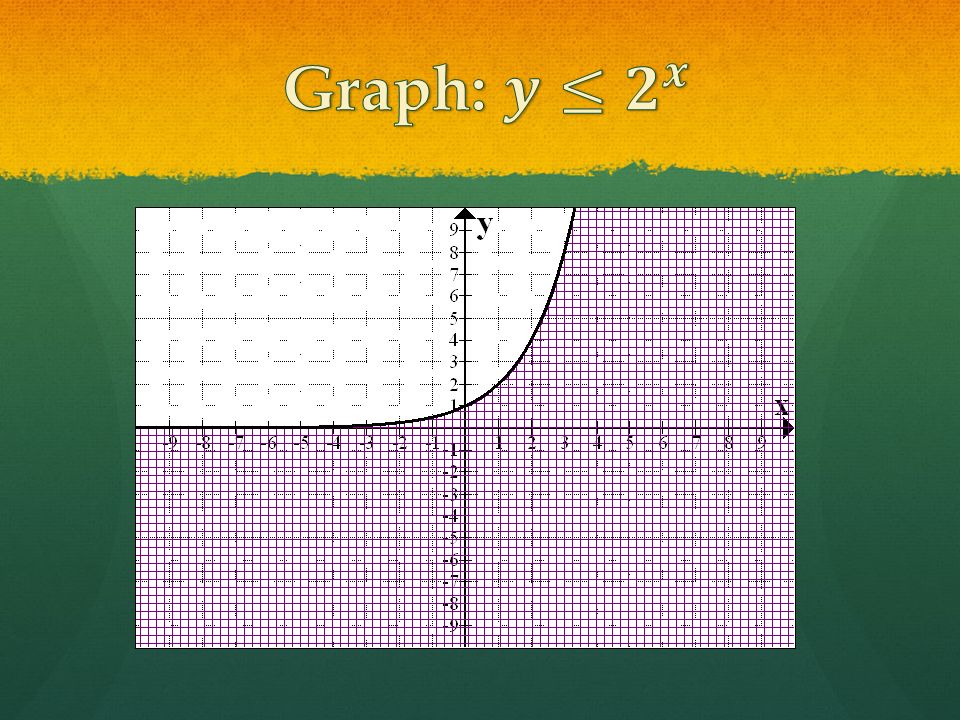
Non Linear Inequalities In chapter 4 we studied parent graphs and their transformation. In chapter 4 we studied parent graphs and their transformation. In the next few slides you will be given non linear graphs. Use your knowledge of parent graphs to display a graph for each function. In the next few slides you will be given non linear graphs. Use your knowledge of parent graphs to display a graph for each function. Then use a test point to graph the inequalities that follow. Then use a test point to graph the inequalities that follow.

36
On your own: Review your notes. Rewrite and fortify them if needed. Review your notes. Rewrite and fortify them if needed. Update your vocab list, if needed. Update your vocab list, if needed.

Similar presentations


 Warm-up 2.) Lesson: Graphing Linear Inequalities in Two Variables 3.) Class/Homework WS Graph Linear Inequalities 4.) STAY ON TASK!!!>")


 y < – 3 and ( b ) x < 2 in a coordinate plane. Test the point (0,0). Because (0,0) is.>")
 y < –3 and ( b ) x < 2 in a coordinate plane. Test the point (0,0). Because (0,0) is.>")


