Download presentation
Presentation is loading. Please wait.

1
ECHA steering meeting Rende 17 January 2004 Explorative statististical analysis on the data collected in Calabria in the frame of the ECHA project. Giuseppe Passarino

2
Data Analysed: Generation 1: 110 (age range 97-108years), 63 F, 47 M. Generation 2: 147 (age range: 45-83 years), 81 F, 66 M. Carolei: 82 (age range: 70-100 years), 52 F, 32M
, 81 F, 66 M. Carolei: 82 (age range: years), 52 F, 32M.")
5
p=0.000 p=0.011 p=0.001

6
p=0.072 p=0.011 p=0.039

7
A synthesis of the main frailty predictors: cluster analysis of the data by using Hand Grip, MMSE, GDS and BMI. The cluster analysis is meant to detect groupings in a set of data. In this case we want to identify groups of cases (subjects) which are homogeneous for some variables.
 which are homogeneous for some variables..")
8
Cluster analysis: the method Clustering begins by finding a synthetic function that takes into account the given variables.Then the objects are clustered by putting close to each other those that are the more similar on the basis of the synthetic function.

9
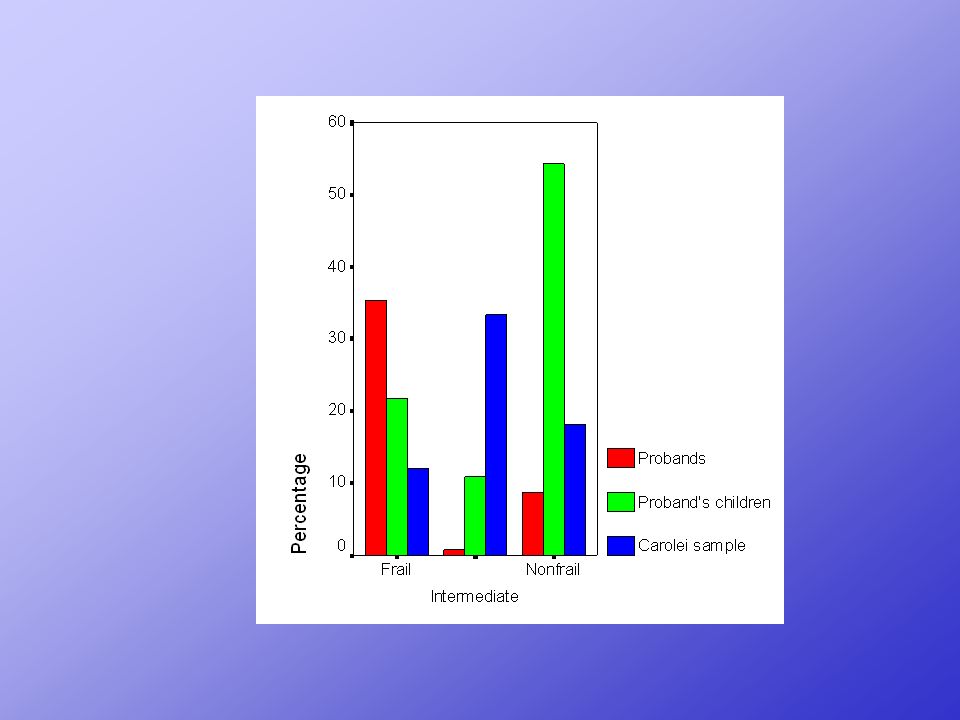
Cluster analysis: the method Frail Intermediate Non Frail

10
1.0503 244,42404 26.0636 244 5.02278 5.0041 244 3.75209 21.15 244 6.320 Total Average N Std Deviation 1.2621 112.38238 26.5709 112 4.46495 2.1696 112 1.78527 24.85 112 4.198 Nonfrail Average N Std Deviation 1.1481 46.29446 30.0381 46 4.04902 8.2174 46 2.62393 23.48 46 3.039 Intermediate Average N Std Deviation.7221 86,32236 23.1769 86 4.54586 6.9767 86 3.51125 15.08 86 5.296 Frail Average N Std Deviation Hand GripBMIGDSMMSE Features of the synthetic groups determined by the cluster analysis

11
The Frailty by age The Non-Frailty by age

13
p-value Activities_of_daily_living,000 Instrumental_activities_of_daily_living,000 How_many_drinks_per_week_on_average,000 Mini Nutri Assessment,000 Waist,000 HIP,000 Pulse_rate,092 Respiratory rate,000 Glucose,007 Glycosilate haemoglobine,084 Urea,121 Creatinine,133 Sodium,018 Calcium,026 Phosphor,068 AST GOT,047 ALT GPT,044 Fosfatasi Alc,001 Total bilirubine,000 Correlation of items included in the ECHA Questionnaire with the probability of frailty calculated by Cluster analysis

14
p-value Total cholesterol, 003 Tryglicerid,108 HDL cholesterol,099 LDL cholesterol,023 Iron,000 Ferritinemy,146 Total protein,001 Albumin,000 CRP,007 a1 (g/dl),000 b (g/dl),151 HGB,000 MCV,137 MCHC,004 RDW (%),008 PLT,151 NEl,113 LY (%),005 Phibrinogen,001 Età,000 Pressione arteriosa diastolica,000 Scholarity,000 MCH,105 Correlation of items included in the ECHA Questionnaire with the probability of frailty calculated by Cluster analysis
,000 b (g/dl),151 HGB,000 MCV,137 MCHC,004 RDW (%),008 PLT,151 NEl,113 LY (%),005 Phibrinogen,001 Età,000 Pressione arteriosa diastolica,000 Scholarity,000 MCH,105 Correlation of items included in the ECHA Questionnaire with the probability of frailty calculated by Cluster analysis")
17
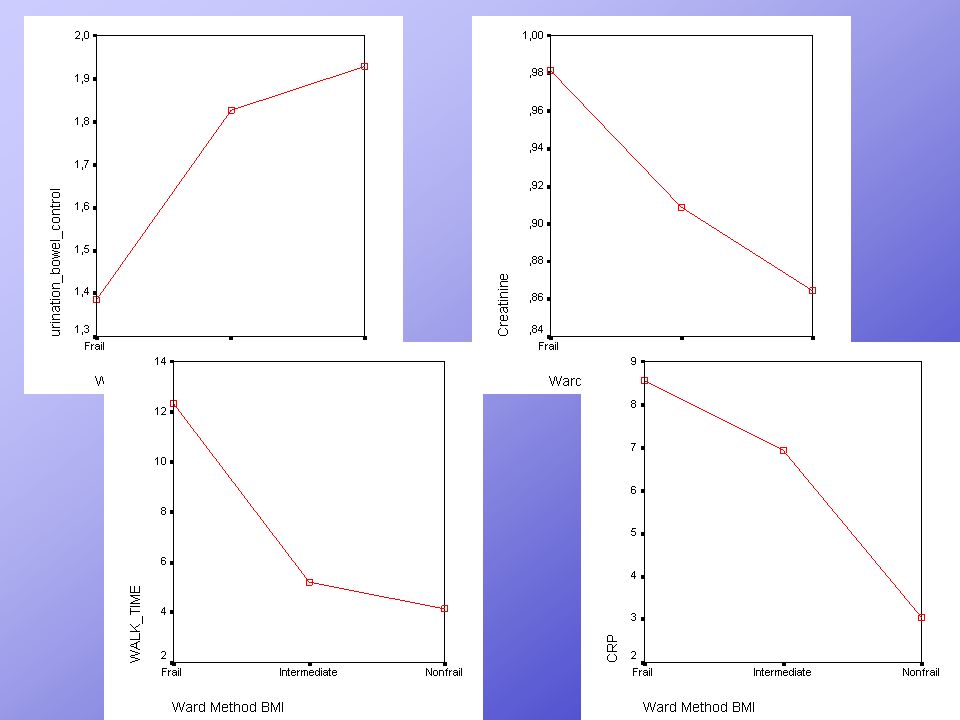
Summary To make a synthetic function of many variables, allows to describe the frailty in a more complete way. The metabolisms of glucose and proteins seem to be very related to frailty in oldest olds. Many items seem to be related to frailty not in a continous way. These items seem as markers of either extreme frailty or extreme non frailty.

18
Acknowledgements. Valentina Greco Maurizio Berardelli Adriana Vallone Emanuela Puntillo Cinzia Martino Sabrina Garasto Giovanna De Benedictis Emidio Feraco Vincenzo Mari Claudio Franceschi Alberto Montesanto Filippo Domma Francesco De Rango Andrea Novelletto

Similar presentations


 Results Implications Discussion Acknowledgment BIOPSYCHOSOCIAL PREDICTORS OF OBESITY IN BIOPSYCHOSOCIAL.>")


 a) H = 2.06%, S = 32.69%, O = 65.25% b) Ca = 54.09%, O = 43.18%, H = 2.73% 2) 24 x.787 + 25 x.101 + 26 x.112 = 24.3 3) a) 98.08 g/mol, b) 759.70 g/mol.>")


