Download presentation
Presentation is loading. Please wait.

1
Grid Monitoring By Zoran Obradovic CSE-510 October 2007

2
Grid Monitoring Reasons for monitoring Authorization, scheduling, sense of control Monitoring systems Globus (Monitoring and Discovery System MDS), Ganglia, Nagios, Inca, MonaLisa Standards GIPS compliance verification
, Ganglia, Nagios, Inca, MonaLisa Standards GIPS compliance verification")
3
Monitoring the state of grid resources, services and job activity is an important part of managing a grid environment Administrators need a sense of control over The resources provided in such distributed computing. It is important for grid administrators to know the current state of the grid to provide operations and support *It is also an important tool for grid users The desire is to develop a system that will give administrators The ability to look at the grid system, and be able to administer it As if it were a single workstation. Reasons

4
Monitoring can provide grid administrators, as well as users, with significant information about what resources are available in the grid and what state they are in. Job monitors gather vital information about job submissions on specific resources by harvesting data from local cluster job Managers. Resource allocation

5
Monitoring allows for various resources to be dynamically instantiated and adjusted using constantly running background Processes. Security: Keeps track of who is using the grid, permissions, Data integrity, minimizes possibility of malicious activity, threats, and accidents,

6
Monitoring Systems

7
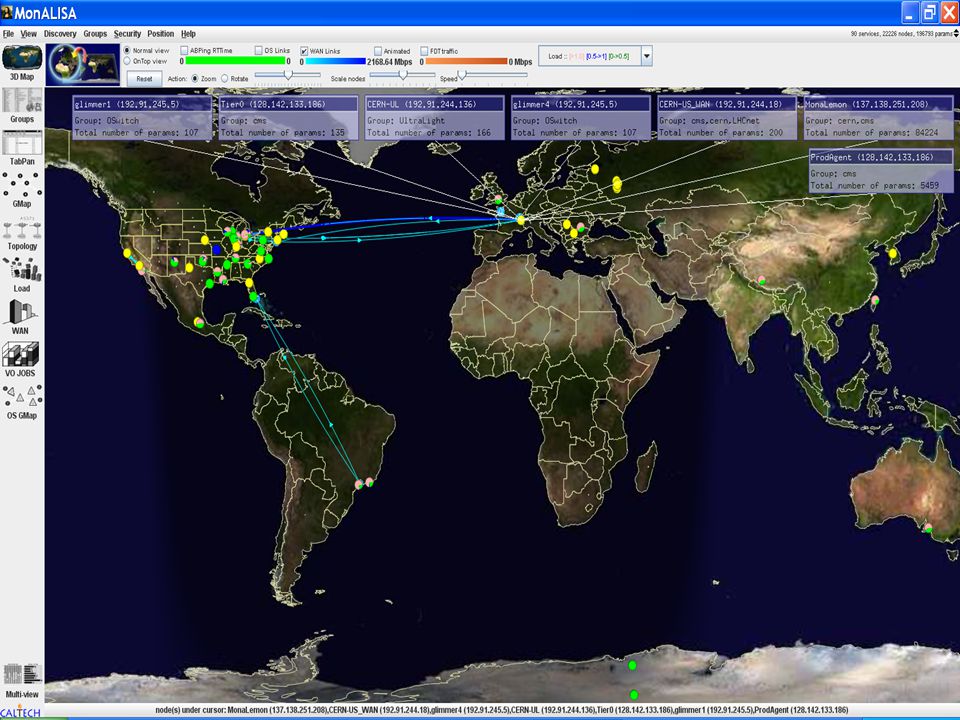
MonAlisa Monitoring Agents using a Large Integrated Services Architecture Built by Caltech and its partners with the support of the U.S. CMS software and computing program. The design is built on Dynamic Distributed Service Architecture Able to provide complete monitoring, control and global optimization services for complex systems.

8
It is an group of independent multi-threaded, self-describing agent-based subsystems which are registered as dynamic services, and are able to communicate and work together in performing a range of information gathering and processing tasks

10
If a monitoring task fails or hangs due to I/O errors, the other tasks are not delayed or disrupted, since they are executing in other, independent threads Pool of threads is created once, and the threads are then reused when a task assigned to a thread is completed.

12
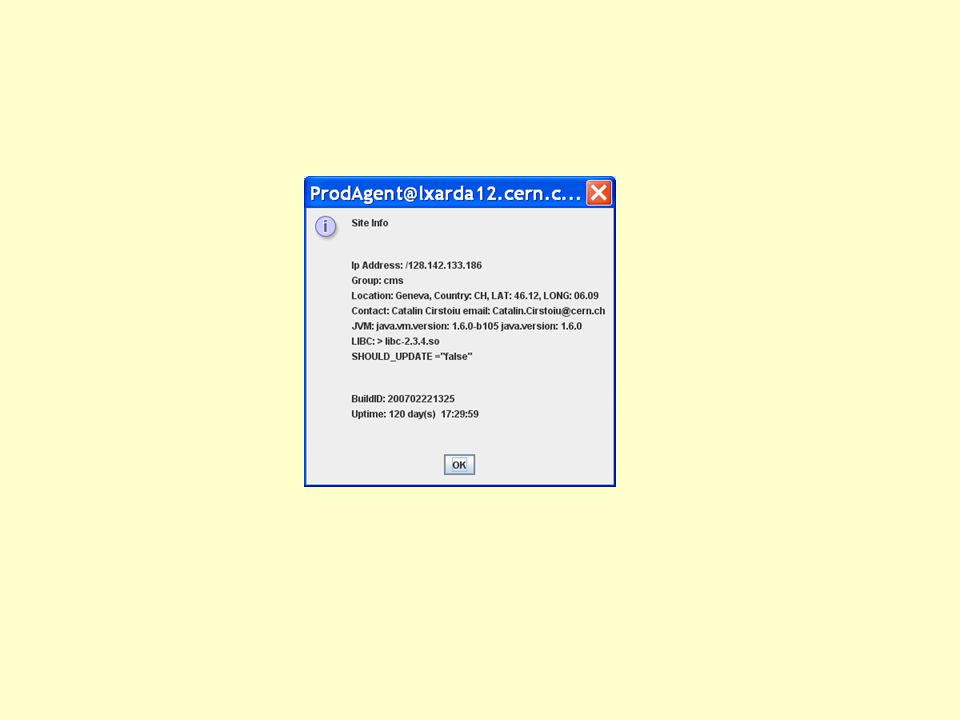
Each MonALISA service registers itself with a set of Lookup Services (LUSs) as part of one or more groups and it publishes some attributes that describe itself. Lookup services have replicated information. MonALISA LUSs restrict the services' registration based on an authorized X.509 certificate.

20
The combination of the service architecture and code mobility makes it possible to build an extensible hierarchy of services that is capable of managing very large systems.

21
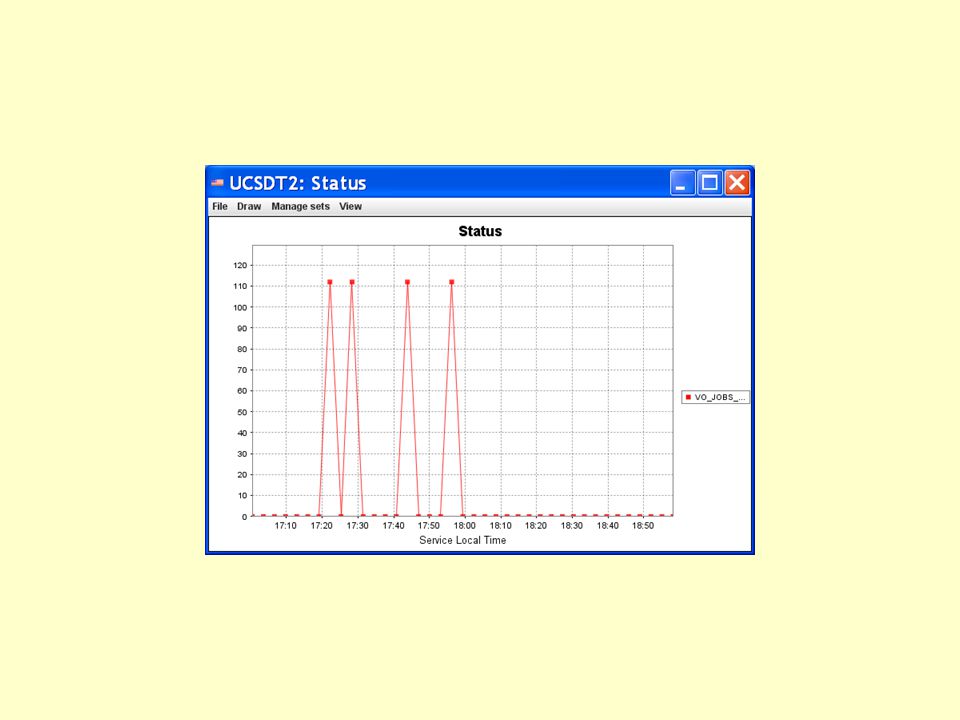
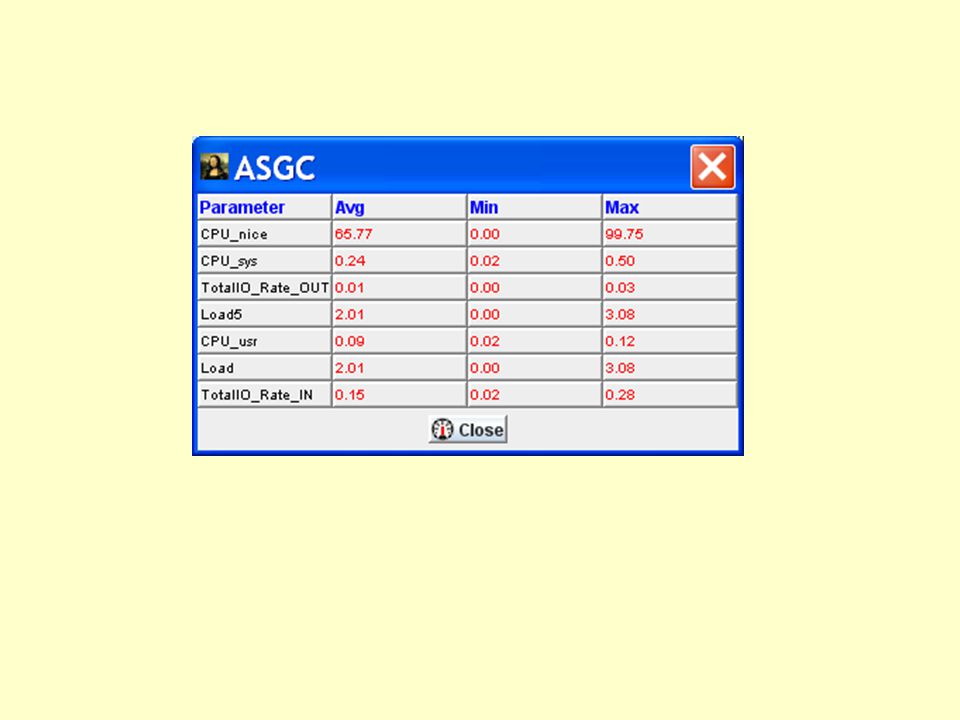
Monitoring all aspects of complex systems : System information for computer nodes and clusters. Network information (traffic, flows, connectivity, topology) for WAN and LAN. Monitoring the performance of Applications, Jobs or services. End User Systems, and End To End performance measurements.
 for WAN and LAN. Monitoring the performance of Applications, Jobs or services. End User Systems, and End To End performance measurements..")
22
The Monitoring and Discovery System (MDS) is a suite of web services to monitor and determine resources and services on Grids Globus Allows users to discover what resources are considered part of a Virtual Organization It offers trigger and indexing services
 is a suite of web services to monitor and determine resources and services on Grids Globus Allows users to discover what resources are considered part of a Virtual Organization It offers trigger and indexing services")
23
Trigger Service: gathers information and evaluates that data against a set of conditions defined in a configuration file. When a condition is met, an action takes place, such as emailing a system administrator when the disk space on a server reaches a threshold. Indexing Service: Gathers information and publish that information as resource properties. Clients use the resource property query and subscription/notification interfaces to retrieve information from an Index.

24
Information Providers For Globus Monitoring Toolkit Hawkeye Information Provider Ganglia Information Provider WS GRAM Reliable File Transfer Service (RFT)
")
25
What do they provide? -basic host data (name, ID) -processor information -memory size -OS name and version -file system data -processor load data -queue information -number of CPUs available and free -job count information -some memory statistics -status data of the server -transfer status for a file or set of files -number of active transfers
 -processor information -memory size -OS name and version -file system data -processor load data -queue information -number of CPUs available and free -job count information -some memory statistics -status data of the server -transfer status for a file or set of files -number of active transfers.")
26
Ganglia Scalable distributed monitoring system for high-performance computing systems It uses XML for data representation, XDR (external data representation) portable data transport and RRDtool for data storage and visualization Uses data structures and algorithms to achieve very low per-node overheads and high concurrency
 portable data transport and RRDtool for data storage and visualization Uses data structures and algorithms to achieve very low per-node overheads and high concurrency")
28
It has been used to link clusters across university campuses and around the world and can scale to handle clusters with 2000 nodes. Current support comes from Planet Lab, an open platform for developing, deploying, and accessing planetary-scale services.

29
Nagios “Nagios is a host and service monitor designed to inform you of network problems before your clients, end-users or managers do.” It is designed to run in Linux operating systems -works fine under most *nix variants The monitoring daemon runs intermittent checks on hosts and services an administrator can specify using external "plugins" which return status information to Nagios If a problem arises in a cluster or a grid, the daemon can send notifications out to administrative contacts in a variety of different ways (email, instant message).
.")
32
Global Investment Performance Standards “The principal goal of the Investment Performance Council is to have all countries adopt the GIPS standards as the standard for investment firms seeking to present historical investment performance” GIPS compliance acting as a “passport” allows firms to enter the arena of investment management competition on a global basis and to compete on an equal footing. Today, 25 countries throughout North America, Europe, Africa, and the Asia Pacific Region have adopted the GIPS standards

33
-Standard interface for presenting monitoring information about a resource -GIP sensor suite used as reference implementation -Information about grids to be returned in LDIF format standard data interchange format for representing LDAP directory content as well as directory update -GLUE Schema: abstract modeling for Grid resources and mapping to concrete schemas that can be used in Grid Information Services -Monitoring and Discovery System (MDS) 2.4 Gris
 2.4 Gris")
34
Sources: http://www.sura.org/cookbook http://monalisa.cacr.caltech.edu/monalisa.htm http://www.globus.org/toolkit/docs/4.0/info/key-index.html http://ganglia.sourceforge.net/ http://www.nagios.org/about/ osg-docdb.opensciencegrid.org/0004/000499/001/OSGMiddleware.pp

Similar presentations


 in AIX System COSC513 Operation Systems Instructor: Prof. Anvari Yuan Ma SID: 105820.>")


