Download presentation
Presentation is loading. Please wait.

1
Which physicians and practices are using electronic medical records? Catharine W. Burt, Ed.D. Chief, Ambulatory Care Statistics Branch July 19, 2006 The HIT Symposium U.S. DEPARTMENT OF HEALTH AND HUMAN SERVICES Centers for Disease Control and Prevention National Center for Health Statistics

2
Topics Background –Published results Survey methods Recent results –2005 estimates –Practice vs. physician estimates –EMR-enabled care among PCPs Conclusions

3
Background Starting in 2001, National Ambulatory Medical Care Survey (NAMCS) asked “ Does your practice use electronic medical records?” “ Does your practice use electronic medical records?”
 asked Does your practice use electronic medical records Does your practice use electronic medical records")
4
Published results Annual NAMCS summary reports 2001 and 2002 Burt, Hing “Use of computerized clinical support systems in medical settings: United States 2001- 03” Advance Data from Vital and Health Statistics; no 353 Burt, Sisk “Which Physicians and practices are using electronic medical records?” Health Affairs; September/October 2005

5
Percent of office-based physicians reporting using electronic medical records by specialty: 2001-2003 Source: CDC/NCHS: NAMCS found in Burt, Sisk.Health Affairs; 2005 17.6 24.4 23.6 21.2 19.7 19.4 18.6 17 16.9 16.6 15.8 15.3 13.4 10.7 9.2 All specialties Orthopedic surgery Cardiovascular disease Otolaryngology Other Internal medicine Neurology General and family practice OBGYN Urology General surgery Ophthalmology Pediatrics Dermatology Psychiatry 051015202530 Percent of physicians.0

6
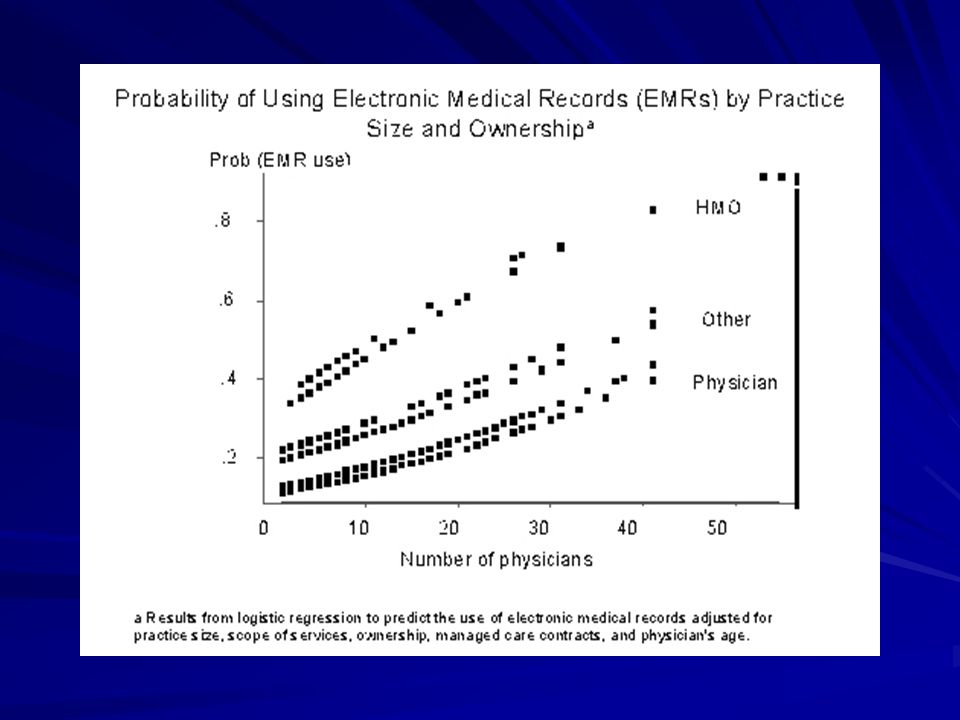
Fitted Probability of Using Electronic Medical Records (EMR) by Practice Size and Ownership a a Results from logistic regression to predict EMR use adjusted for practice size, scope of services, ownership, managed care contracts, and physician's age (See Exhibit 5- Burt, Sisk. Health Affairs; 2005). Solo2-45-910-1920+ Number of physicians in practice 0 0.1 0.2 0.3 0.4 0.5 0.6 0.7 Prob (EMR use) PhysicianOtherHMO
. Solo Number of physicians in practice Prob (EMR use) PhysicianOtherHMO.")
8
NAMCS Annual probability survey of office-based physicians (n~3,000) Includes nonfederal, office-based physicians who see patients in an office setting. Excludes radiologists, anesthesiologists, and pathologists Multi-stage sampling design –112 geographic areas –Physicians stratified by specialty –Sample of office visits from 1 week Sample frame - Masterfiles of the AMA and AOA

9
Induction interview Face-to-face interview by US Census Bureau interviewers ~ 20 minutes Content –Practice size - Weekly volume –Scope of practice - Revenue sources –Ownership - Age, gender,specialty –Managed care involvement –Use and components of EMRs

10
Office visits Abstracts from ~ 30 office encounters Abstracts from ~ 30 office encountersContent –Patient demographics –Continuity of care –Reasons for visit and diagnoses –Diagnostic and therapeutic services –Medications –Disposition and duration

11
Quality of data Data are centrally processed <1% error Response rate ~ 62-70% Sample weights include adjustment for nonresponse Sampling error - 6-20% of published estimates Nonsampling error - Studies indicate negligible nonresponse bias

12
2005 estimates of EMR penetration Starting in 2005 –finer EMR detail –General question: Full or partial use of EMR –Specific questions: Patient demographics Patient demographics CPOE CPOE Orders for tests Orders for tests Lab results Lab results Physician notes Physician notes Clinical reminders Clinical reminders Public health reporting Public health reporting

13
Diffusion of electronic medical records among office-based physicians: United States 2001-2005 Source: National Ambulatory Medical Care Survey, 2001-2005 ! ! !! ! 18.2 17.3 20.8 23.9 20012002200320042005 0 5 10 15 20 25 30 Percent of physicians

14
Percent of physicians using electronic medical records by practice size, for general and specific responses Chi-square test of independence = 71.0, df=10, p<.01 Note: General response is answer to single question about EMR use whereas specific response is a positive response to all four minimally required features. SOURCE: 2005 NAMCS. 16.0 20.2 25.3 33.8 46.1 4.4 6.0 10.2 16.5 20.8 SoloPartner3-56-1011 or more Number of physicians 0 10 20 30 40 50 Percent of physicians General responseSpecific response

15
EMR system featureAll PhysiciansFully electronicPartially electronic Patient demographics21.4 (1.6)91.5 (2.7)82.3 (3.8) Physician clinical notes17.7 (1.6)82.2 (5.8)65.4 (4.9) Lab results17.2 (1.6)80.9 (5.5)63.4 (5.0) Nurse clinical notes14.0 (1.5)72.6 (6.1)46.0 (5.7) CPOE13.4 (1.3)73.5 (5.1)40.4 (4.5) Test orders12.7 (1.3)67.6 (5.2)40.2 (5.6) Clinical reminders10.7 (1.1)57.9 (5.5)33.3 (4.3) Public health reporting 5.4 (0.9)34.2 (5.1)12.1 (2.8) Percent of office-based physicians with selected features of EMR systems (standard error)
91.5 (2.7)82.3 (3.8) Physician clinical notes17.7 (1.6)82.2 (5.8)65.4 (4.9) Lab results17.2 (1.6)80.9 (5.5)63.4 (5.0) Nurse clinical notes14.0 (1.5)72.6 (6.1)46.0 (5.7) CPOE13.4 (1.3)73.5 (5.1)40.4 (4.5) Test orders12.7 (1.3)67.6 (5.2)40.2 (5.6) Clinical reminders10.7 (1.1)57.9 (5.5)33.3 (4.3) Public health reporting 5.4 (0.9)34.2 (5.1)12.1 (2.8) Percent of office-based physicians with selected features of EMR systems (standard error)")
16
Geographic location Location Percent distribution of physicians Percent of physicians using EMRs Northeast 20.9 20.9 14.4 14.4 Midwest 21.4 21.4 26.9 26.9 South 34.9 34.9 21.7 21.7 West 22.7 22.7 33.4 33.4 Metro 89.4 89.4 24.8 24.8 Non-metro 10.6 10.6 16.9 16.9 SOURCE: 2005 NAMCS

17
Geographic location Location (county population information from ARF) Percent distribution of physicians Percent of physicians using EMRs Low income (<$25k) 11.6 11.6 20.3 20.3 Medium 77.2 77.2 24.0 24.0 High income (>$45k) 11.3 11.3 27.2 27.2 High % non-Hispanic white (>75%) 40.5 40.5 24.8 24.8 Medium 34.1 34.1 21.6 21.6 Low % non-Hispanic white (<50%) 25.4 25.4 25.8 25.8
 Percent distribution of physicians Percent of physicians using EMRs Low income (<$25k) Medium High income (>$45k) High % non-Hispanic white (>75%) Medium Low % non-Hispanic white (<50%)")
18
EMR practice penetration of geographic area Percent distribution of physicians Percent of physicians using EMRs Under 10% 41.9 41.9 9.9 9.9 10-19% 14.6 14.6 20.5 20.5 20-29% 13.8 13.8 31.1 31.1 30-39% 7.8 7.8 41.6 41.6 40% or more 12.8 12.8 55.0 55.0 Unknown HRR 9.2 9.2 24.5 24.5

19
Scatterplot of EMR diffusion among group and solo/partner physicians in 47 HRRs

20
Percent distributions of physicians and practices by practice size SOURCE: 2005 NAMCS 38.5 11.3 25.4 12.9 9.7 2.2 69 10.1 12.6 3.3 1.1 3.9 Solo (16.0) Partner (20.2) 3-5 (25.3) 6-10 (33.8) 11 or more (46.1) Unknown size (12.0) 020406080 Physicians 020406080 Practices Practice size (% EMR use).0
 Partner (20.2) 3-5 (25.3) 6-10 (33.8) 11 or more (46.1) Unknown size (12.0) Physicians Practices Practice size (% EMR use).0")
21
EMR-enabled care Visit data from the 2003-4 NAMCS indicate that estimates of EMR use among physicians who are the PCP for patients does not vary by.. –Age, sex, race, ethnicity, region, urbanicity, source of payment, income, education, language ability, etc About 16.6% of patients who saw their PCP in 2003 or 2004 were covered under EMRs. (95% CI: 12.6-21.5)
.")
22
Conclusions EMR use is gradually increasing. Group practices are leading the way. Location of practice is related to EMR penetration Core EMR capability lags behind physician perception of EMR use. Solo physicians are least likely to use EMRs – while they represent 38.5% of physicians, they represent 69.0% of practices. Good news is that there appears to be no disparity with regard to EMR-enabled care among patients visiting their PCP.

23
Information available on the Internet More information found on our website is www.cdc.gov/nchs/NAMCS.htm www.cdc.gov/nchs/NAMCS.htm Join our LISTSERV Contact information –Catharine Burt –cburt@cdc.gov

Similar presentations


 data Session 25 July 13, 2004 10:30-noon.>")


 K. Kromer Baker 1, A. T. Onaka 1, B. Horiuchi.>")
 Hsiao,>")

