Download presentation
Presentation is loading. Please wait.

1
Chapter4 Microbial growth
Isolation of pure cultures the growth curve Measurement of microbial growth The continuous culture of microorganisms

2
Isolation of pure cultures
Pure culture: a population of cells arising from a single cell, to characterize an individual species. They are required for the careful study of an individual microbial species. Single colony How to get 1. Dilute-pour/spread plate technique: dilutepour/spread isolated colonies 2. Streak plates: inoculating loop

3
Petri Disk Cultivation of a Pure Strain

4
The Streak Plate Technique: to obtain a pure clone

5
Laboratory Culture of Microorganisms
1.5% Agar

6
Colony morphology and growth
individual species often form colonies of characteristic size and appearance.

7
The growth of colonies on agar
At the colony edge: cells grow at maximum rates; In the center of colony: cells are lying; growth is much slower Cause: Oxygen, nutrients and toxic products The colony center is much thicker than the edge. Cell-cell communication and quorum sensing

8
Microbial growth Batch culture: When microorganisms are grown in a closed system, population growth remains exponential for only a few generations and then enters a stationary phase due to factors like nutrient limitation and waste accumulation. Continuous Culture: If a population is cultured in an open system with continual nutrient addition and waste removal, the exponential phase can be maintained for long periods.

9
The growth curve The logarithm of the number of viable cells versus the incubation time. .

10
The Growth Cycle of Populations
(a) Lag phase: cells begin to synthesize inducible enzymes and use stored food reserves. (b) Logarithmic growth phase: the rate of multiplication is constant. (c) Stationary phase: death rate is equal to rate of increase. (d) Death phase: cells begin to die at a more rapid rate than that of reproduction.
 Lag phase: cells begin to synthesize inducible enzymes and use stored food reserves. (b) Logarithmic growth phase: the rate of multiplication is constant. (c) Stationary phase: death rate is equal to rate of increase. (d) Death phase: cells begin to die at a more rapid rate than that of reproduction.")
11
Lag phase no immediate increase in cell mumber. The cell is synthesizing new compoments. ATP, cofactor, ribosomes, enzymes. The lag phase varies in length with the condition of the microorganisms and the nature of the medium. How to shorten the lag phase?

12
Exponential phase/log phase
Microorganisms are growing and dividing at the maximal rate possible. The population is most uniform in terms of chemical and physiological properties. Such culture: biochemical and physiological studies.

13
Stationary phase Balance between cell division and cell death.
Poplation growth ceases and the growth curve becomes horizontal. Bacteria: 109 cells per ml; Protozoan and algae: 106 cells per ml. Reasons: 1. Nutrient limitation 2. The accumulation of toxic waste products 3. A critical population level is reached

14
Death phase The decline in the number of viable cells.
Starvation can be a positive experience for bacteria. 1. decrease overall size: protoplast shrinkage; nucleoid condensation. 2. Produce a variety of starvation proteins. 3. Increase peptidoglycan cross-linking and cell wall strength. 4. The Dps protein protects DNA. 5. Chaperones prevent protein denaturation and renature damaged proteins.

15
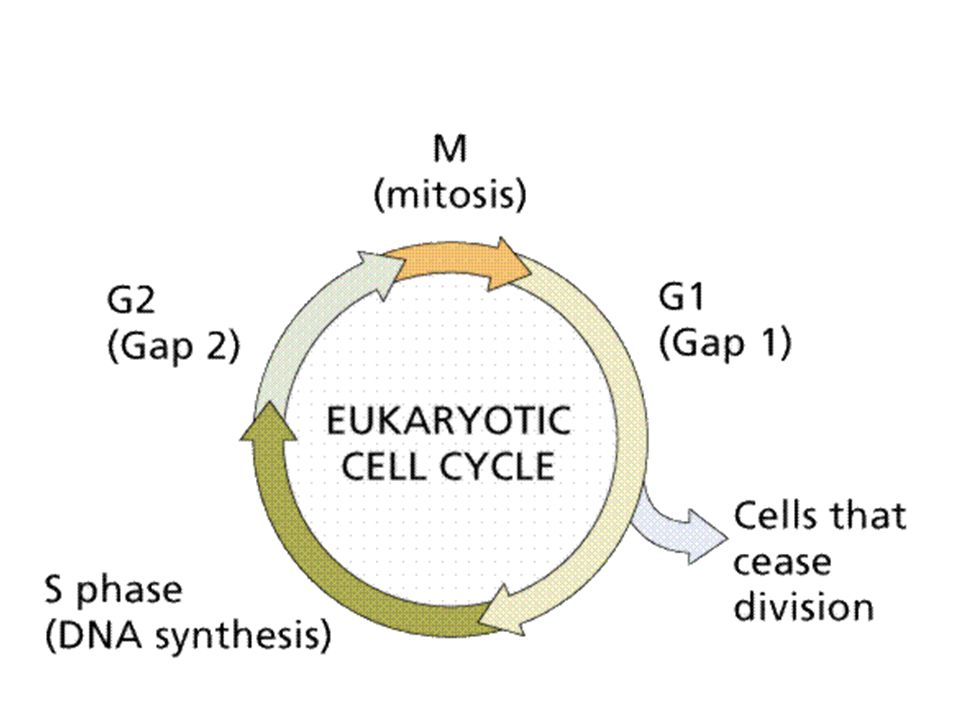
S phase in which replication of the genome occurs
Cell life cycle in Eukaryotic cells G1 Primary growth phase of the cell during which cell enlargement occurs, a gap phase separating cell growth from replication of the genome S phase in which replication of the genome occurs G2 Phase in which the cell prepares for separation of the replicated genomes, this phase includes synthesis of microtubules and condensation of DNA to form coherent chromosomes, a gap phase separating chromosome replication from miosis. M phase called miosis during which the microtubular apparatus is associated and subsequently used to pull apart the sister chromosomes. Eukaryotic cell: Prokaryotic cell: G S G M G R D

17
generation time The time required for a cell to divide (and its population to double) is called the generation time. Suppose that a bacterial population increases from103 cells to 109 cells in 10 hours. Calculate the generation time. Nt = No x 2n G = t log2 / log Nt – log No No = number of bacteria at beginning of time interval. Nt = number of bacteria at end of any interval of time (t). G = generation time T = time , usually expressed in minutes n = number of generation Number of cells Time
. G = generation time. T = time , usually expressed in minutes. n = number of generation. Number of cells. Time.")
18
Generation time Example 100 bacteria present at time 0
If generation time is 2 hr After 8 hr mass = 100 x 24

19
3 types of cell division a. Binary Fission b. Budding c
3 types of cell division a. Binary Fission b. Budding c. Multiple Fission

20
Binary fision Most bacterial cells reproduce asexually by binary fision, a process in which a cell divides to produce two nearly equal-sized progeny cells. Binary fision involves three processes: Increase in cell size (cell elongation), DNA replication Cell division
, DNA replication. Cell division.")
21
Binary Fission (二分裂) Attention: difference between cocci and bacilli in binary fission
 Attention: difference between cocci and bacilli in binary fission")
22
Budding (芽殖)
")
23
Multiple Fission

24
Measurement of microbial growth
Population mass Population number No single technique is always best.

25
Measurement of cell numbers
Total cell count (direct observation under microscope) Viable count (plate count or colony count) Spread plate method Pour plate method The membrane filtration procedure The plates required to have between 30 and 300 colonies.
 Viable count (plate count or colony count) Spread plate method. Pour plate method. The membrane filtration procedure. The plates required to have between 30 and 300 colonies.")
26
Direct counting The counting chamber
Disadvantages: 1. The microbial population must be fairly large for accuracy because such a small volume is sampled. 2. Difficult to distinguish between living and dead cells Electronic counters: the Coulter Counter for larger microorganisms such as protozoa, algae, and nonfilamentous yeasts.

27
Viable count: Spread plate method and Pour plate method
Problems: 1. Clumps of cells. colony forming units(CFU); 2. employed agar medium cannot support growth of all the viable microorganisms present. 3. Hot agar: spread plates>pour plates Three basic steps: Dilution, Plating Incubation
; 2. employed agar medium cannot support growth of all the viable microorganisms present. 3. Hot agar: spread plates>pour plates. Three basic steps: Dilution, Plating. Incubation.")
28
Measuring viable bacteria
Colony forming units colony

29
Viable Count: Dilution

30
Viable Count: Plating

31
Incubation (and counting)
Pour plate method Spread plate method

32
The membrane filtration procedure
Analyze aquatic samples 实验9:滤膜法测定水中大肠菌群数(设计性)
")
33
Measurement of cell mass
1. Dry weight: useful for measuring the growth of fungi. cells growing in liquid medium are collected by centrifugation, washed, dried in an oven, and weighed. for bacteria, not very sensitive 2. Turbidity and microbial mass measurement 3. The amount of a substance total protein or nitrogen chlorophyII(algae)
")
34
Measuring bacterial mass (live + dead) in liquid culture
Turbidity (Cloudiness)
")
35
Measuring cell density:
Turbidity vs Cell density

36
The continuous culture of microorganisms
Continual provision of nutrients and removal of wastes. A microbial population can be maintained in the exponential growth phase and at a constant biomass concentration for extended periods in a continuous culture system.

37
The chemostat: Chemostat used for continuous cultures, rate of growth can be controlled either by controlling the rate at which new medium enters the growth chamber or by limiting a required growth factor in the medium The turbidostat: measures the absorbance or turbidity of the culture in the growth vessel. automatically regulated to maintain a predetermined turbidity or cell density.

38
How to maintain Exponential Growth?

39
Questions How to describe the colony morphology?
• How to obtain a pure culture? How to calculate cell growth? How to describe the colony morphology? • How cells divide themselves? How to do viable count? • What is the microbial cell growth cycle? How to measure the cell mass and number? What is continuous culture, chemostat, turbidostat? • How to maintain exponential growth?

Similar presentations


 Lecture 4 Nutrition and Growth (Text Chapters: 5.1-5.3; 6.1; 6.4-6.8; 6.10-6.15)>")


