Download presentation
Presentation is loading. Please wait.

1
Health Consequences of Environmental Degradation and Social Injustice
Martin Donohoe, M.D., F.A.C.P.

2
Am I Stoned? A 1999 Utah anti-drug pamphlet warns:
“Danger signs that your child may be smoking marijuana include excessive preoccupation with social causes, race relations, and environmental issues”

3
Our Home

5
Perspective The earth spins at 1,038 mph at the equator, between 700 mph and 900 mph at mid-latitudes The earth rotates around sun at 18.5 miles/sec The solar system orbits the center of the Milky Way Galaxy at 137 miles/sec One rotation per 225 million years

6
Perspective The sun is one of hundreds of billions of stars in the Milky Way Galaxy The Milky Way is one of over one hundred billion galaxies in the known universe The universe may be one of an infinite number of universes

7
The Planets

8
Our Solar System

9
Jupiter = one pixel, Earth = invisible
![]()
10
Sun = one pixel, Jupiter = invisible
![]()
11
Earth/Moon Seen by Voyager Spacecraft through Saturn’s Rings

12
Portland, Oregon Mount Hood

13
Multnomah Falls, Oregon

14
The Environment The natural environment The built environment
The social environment

15
Causes of Environmental Degradation
Overpopulation Pollution Deforestation Global Warming Agricultural/Fishing Practices Overconsumption / Affluenza Militarization

16
Causes of Environmental Degradation
Maldistribution of Wealth National and Global Political and Economic Institutions Poor education Media manipulation and inaccurate reporting Unbalanced political influence Citizen apathy

17
Consequences of Environmental Degradation
Increased poverty and overcrowding Famine Weather extremes Species loss Medical illnesses Infectious diseases

18
Consequences of Environmental Degradation
Death (40% of world’s yearly deaths linked to water, air, and soil pollution) War Ecological footprint (22 hectares/person) exceeds Earth’s biological capacity (16 hectares/person) Malthusian chaos and disaster Tragedy of the Commons
 War. Ecological footprint (22 hectares/person) exceeds Earth’s biological capacity (16 hectares/person) Malthusian chaos and disaster. Tragedy of the Commons.")
19
Economic Costs of Environmental Diseases
Estimated at $ billion/year in the U.S. alone ($1.25-$2.0 billion in Oregon) Does not count the psychological and emotional costs of the human suffering involved for the victims, their families, and their communities
 Does not count the psychological and emotional costs of the human suffering involved for the victims, their families, and their communities.")
20
Economic Costs of Environmental Diseases: Oregon
Adult and childhood asthma: $30 million Childhood asthma: $28 million Adult cardiovascular disease: $342 million Childhood cancer: $9 million Childhood lead exposure: $878 million Birth defects: $3 million Neurobehavioral disorders: $187 million Source: OEC, The Price of Pollution, 2/08

21
Premature Deaths in the U.S.
10% due to inadequate medical care 60% due to behaviors, social circumstances, and environmental exposures

22
Overpopulation World population - exponential growth
1 billion in 1800 2.5 billion in 1950 6 billion in 2000 7 billion in 2011 (1/15 humans ever to live is alive today) est. 9 billion by 2040 More people added to the planet in the last 40 years than in all previous recorded history
 est. 9 billion by More people added to the planet in the last 40 years than in all previous recorded history.")
23
Overpopulation Africa, Asia, and Latin America primarily affected
Causes: Poverty Women’s rights issues – impaired access to reproductive health care and education, political/legal/economic/social marginalization

24
World Population

25
Urbanization 20-30 million people/year leave rural for urban areas
2007: first time in history that more than half the world’s population live in urban areas

26
The Displaced World migrant population = 42 million
15 million refugees 26 million internally displaced persons Economic, war and environmental refugees Vast majority of refugees hosted in the developing world

31
Urban Sprawl Since the 1960’s America’s metropolitan areas have been consuming land at a rate 4x faster that population growth 6,000 acres of open space lost per day

32
Wallace Stegner “We simply need … wild country available to us, even if we never do more than drive to its edge and look in. For it can be a means of reassuring ourselves of our sanity as creatures, a part of the geography of hope”

33
Air Pollution

34
Air Pollution

35
Air Pollution Top ten cities with the worst air pollution in the world (2012): 10 – Lahore, Pakistan 9 – Kanpur, India 8 - Yasouj, Iran 7 - Gaborone, Botswana 6 – Peshawar, Pakistan

36
Air Pollution Top ten cities with the worst air pollution in the world (2012): 5 – Kermanshah, Iran 4 - Ludhiana, India and Quetta, Pakistan 3 – Sanandaj, Iran 2 – Ulaan Baatar, Mongolia 1 – Ahvaz, Iran

37
Air Pollution However, World Bank states 16 of the top 20 most polluted cities are in China (#1 – Linfen) Studies differ with respect to types of pollutants measured Most polluted areas in US: 2001 – LA 2002 – Houston 2003 – San Joaquin Valley in Central California 2004, – LA

38
Most Polluted Cities in the US Particulate Matter (2012)
10 – Philadelphia, PA / Camden, NJ 9 – Louisville, KY 8 – Cincinatti, OH 7 – Phoenix, AZ 6 – Fresno, CA 5 – Fresno, CA 4 - Visalia, Porterville, CA 3 - LA/Long Beach/Riverside, CA 2 - Hanford/Corcoran, CA 1 - Bakersfield, CA

39
Health Effects of Air Pollution
Causes approximately 60, ,000 premature deaths/yr. in U.S. (656,000 in China, over 2 million worldwide) More than are killed by auto accidents
 More than are killed by auto accidents.")
40
Health Effects of Air Pollution
Air pollution causes asthma and impairs lung development and function Deaths from cardiopulmonary diseases correlate with air pollution levels in US cities Both day to day and over time Triggers 7.4% of heart attacks worldwide

41
Health Effects of Air Pollution
Increased admissions for CHF, asthma, COPD, PVD, and cerebrovascular disease (stroke and TIA) Increased ventricular arrythmias Increased lung cancer mortality Decreased exercise tolerance, increased pulmonary symptoms
 Increased ventricular arrythmias. Increased lung cancer mortality. Decreased exercise tolerance, increased pulmonary symptoms.")
42
Health Effects of Air Pollution
Increased risk of DVT Increased risk of rheumatoid arthritis Impaired sperm production Premature births (1/3 more common in large towns/cities) Pre-eclampsia
 Pre-eclampsia.")
43
Health Effects of Air Pollution
Increase in SGA and LBW infants Increased risk of appendicitis ?Via link with inflammation? Increased numbers of migraines Autism Days lost from work/school

44
Air Pollution Coarse, fine and ultrafine particles
Ultrafines not regulated, may be most dangerous Nanoparticles may contribute to health risks

46
Air Pollution: The Good News
Reductions in air pollution under Clean Air Act Account for up to 15% of overall increase in life expectancy in major U.S. metropolitan areas Act has saved $22 trillion in health care costs since 1972 passage Saved 160,000 lives in 2010

47
Ozone Destruction Ozone hole over Antarctic (2½X size of Europe)
Arctic ozone hole larger 40% of Arctic ozone destroyed

48
Effects of Ozone Destruction
Increased cataracts (UV damage) Increased lifetime melanoma risk 1/ 1/68 - today
 Increased lifetime melanoma risk. 1/ /68 - today.")
49
Antarctic Ozone Hole

50
Automobiles

51
Automobiles Number of autos -US: 1.17 car/2 people (88% drive to work) -Mexico: 1/8 -China: 1/100 (increasing, has surpassed US auto sales) -Worldwide: 1 billion cars (1/7 people) Over 1.2 million killed, million injured/disabled in road accidents annually worldwide
 Over 1.2 million killed, million injured/disabled in road accidents annually worldwide.")
52
Automobiles Average miles traveled/car/year in U.S. 1965 - 4,570 mi.

53
Automobiles Average fuel efficiency of U.S. autos stagnant
Cars: 23.6 mpg (2012); 35.5 mpg required by 2016; 54.5 mpg by 2025 Light trucks / SUVs: 23.5 mpg by 2011, 28.6 mpg by 2015 European and Japanese standards higher Relatively low oil prices (until recently)
; 35.5 mpg required by 2016; 54.5 mpg by Light trucks / SUVs: 23.5 mpg by 2011, 28.6 mpg by European and Japanese standards higher. Relatively low oil prices (until recently)")
54
Automobiles Growing market for low-efficiency pickups, minivans, and sport-utility vehicles SUVs = 1/3 of all vehicles sold today Ford Model T – 25 mpg (1908); Avg. car today – 22.6 mpg (2010)
; Avg. car today – 22.6 mpg (2010)")
55
Automobiles: Alternatives
Rapid transit -industry squashed in 1930’s and 40’s (GM, Standard Oil, Firestone, etc.) -Convicted under Sherman Antitrust Act
 -Convicted under Sherman Antitrust Act.")
56
Automobiles: Alternatives
Car sharing Pay-as-you-drive auto insurance Build fewer roads (the more roads you build, the more congestion you create) “Peak Pricing” and “Congestion Fees” E.g., London → 21% decrease in traffic, 43% increase in bus ridership, cleaner air
 Peak Pricing and Congestion Fees E.g., London → 21% decrease in traffic, 43% increase in bus ridership, cleaner air.")
57
Alternatives to Automobiles
Bicycles/walking 30% of all trips by bike in Amsterdam; 2% in Portland, OR Busses Trains 15 x more efficient per passenger than autos Amtrak receives 1/3 the amount of federal funding (adjusted for inflation) that it received 20 years ago
 that it received 20 years ago.")
58
Automobiles: Alternatives
Electric cars -killed by oil companies, automakers in early 20th century Natural gas, gasohol, and biodiesel Natural gas from fracking over-rated, carries environmental and seismic risks Beware Jevon’s Paradox (Increased efficiency leading to increased overall energy consumption)
")
59
Automobiles: Alternatives
Solar cars Hydrogen-powered cars Byproduct = water Problem: Hydrogen production requires fossil fuels Telecommuting

60
US Energy Consumption by Fuel
Oil – 37% peak oil production originally predicted 2014; new estimates much farther in future, but sources dirtier and more expensive/more dangerous to obtain Natural gas – 24% Coal – 22% - peak coal production 1920 Nuclear – 8.5% Renewables (mostly hydroelectric and biomass; small amounts of geothermal, wind, and solar) – 7.3%
 – 7.3%")
61
U.S. Energy Sources for Electricity
Coal – 51% Nuclear – 21% Gas – 17% Oil – 1% Renewables (mostly hydroelectric) – 9% Electricity generation utilizes 40% of US energy
 – 9% Electricity generation utilizes 40% of US energy.")
62
US Energy Consumption Transportation – 29% Industrial – 25%
Residential – 11.5% Commercial – 8.5%

63
Energy Spending/Research
Federal funding for energy R&D ( , in 2005 dollars): $50 billion: nuclear Nuclear subsidies under strong consideration by Congress, supported by Obama (2011) $20 billion: fossil fuels $12 billion: renewable energy $12 billion: efficiency 2010: increases in funding for renewable energy, possibly nuclear energy
: $50 billion: nuclear. Nuclear subsidies under strong consideration by Congress, supported by Obama (2011) $20 billion: fossil fuels. $12 billion: renewable energy. $12 billion: efficiency. 2010: increases in funding for renewable energy, possibly nuclear energy.")
64
Petroleum Industry Profits
Mergers squelch competition, drive up prices Record-breaking oil company profits The world’s 6 most profitable corporations in 2008 were oil companies (in 2010, 5 of the top 50) Exxon: $45 billion in 2008, over $30 billion in 2011 2008 profits largest in U.S. history (exceed GDP of 2/3 of world’s nations)
 Exxon: $45 billion in 2008, over $30 billion in profits largest in U.S. history (exceed GDP of 2/3 of world’s nations)")
65
Belridge, CA Oil Fields Edward Burtynsky

66
Nigerian Gas Flare

67
The U.S. and Oil U.S. consumes > 20 million bbl/d
Produces 5 million bbl/d World’s largest crude oil importer Ironically, greatest export in 2011 is gas, diesel, jet fuel, and other fuels Strategic Petroleum Reserve holds more than 700 million bbl ANWR contains 4.3 – 11.8 billion bbl oil One year supply

68
The U.S. and Oil 23 billion bbl under remaining U.S. territory
2.5 million abandoned oil and gas wells litter U.S. (20-30 million worldwide) Pollution, explosion hazards Alberta Tar Sands (shale oil), Keystone Pipeline controversies
 Pollution, explosion hazards. Alberta Tar Sands (shale oil), Keystone Pipeline controversies.")
69
Oil and War Countries that export oil are >40 times more likely to be engaged in civil war than those that do not Gulf Wars I and II The Future?

70
Coal 33% of U.S. carbon emissions (41% of world’s)
Coal mining dangerous (explosions, cave-ins, black lung disease) 48 deaths in 2010 from “accidents”/cave-ins 75,000 deaths from black lung disease in U.S. ( )
 48 deaths in 2010 from accidents /cave-ins. 75,000 deaths from black lung disease in U.S. ( )")
71
Coal Mountain-top removal damages ecosystems
Coal-fired power plants top source of mercury worldwide EPA’s 2011 limits on emissions to prevent 11,000 premature deaths, 4,700 MIs, 130,000 cases of childhood asthma

72
Proposed Coal Shipments through Pacific NW
150 million tons/yr from Powder River Basin (WY, MT; 40% of US coal deposits) Purchased from public lands and to be sold cheaply to markets in Asia 26 trains/day, each miles long, each over 100 cars and powered by 4 diesel engines Barges on Columbia River Amount expected to possibly quintuple by 2030
 Purchased from public lands and to be sold cheaply to markets in Asia. 26 trains/day, each miles long, each over 100 cars and powered by 4 diesel engines. Barges on Columbia River. Amount expected to possibly quintuple by")
73
Risks of Proposed Coal Shipments through Pacific NW
Diesel particulate matter: Impairs lung development; associated with asthma, COPD, heart disease, stroke, and cancers Coal dust: COPD, pneumoconiosis – black lung, contains heavy metals

74
Risks of Proposed Coal Shipments through Pacific NW
Noise: Associated with fatigue, ischemic heart disease/HTN/arrythmia, increased risk of stroke, exacerbation of mental health problems, fatigue, cognitive development, quality of life Train traffic delays affecting emergency responders Derailments, car vs. train accidents

75
Risks of Proposed Coal Shipments through Pacific NW
Global warming, ozone, mercury Jobs gained: Building and operating transfer facilities Temporary; dangerous Coal terminal workers have 3-fold increased risk of lung cancer Job loss: Local businesses cut off for 1-2 hours per day from auto traffic

76
Proposed Coal Shipments through Pacific NW
Facing strong community opposition Nineteenth Century technology vs. program of sustainable, clean energy for the 21st Century

77
Other Sources of Air Pollution
Industry - #1 Indoor air (chemicals) Indoor combustion of coal and biomass (wood, charcoal, crop residues, and animal dung) for cooking, heating and food preservation Used by almost 3 billion people worldwide Causes 2 million deaths/yr Associated with multiple pulmonary conditions Solar cookers may replace
 Indoor combustion of coal and biomass (wood, charcoal, crop residues, and animal dung) for cooking, heating and food preservation. Used by almost 3 billion people worldwide. Causes 2 million deaths/yr. Associated with multiple pulmonary conditions. Solar cookers may replace.")
78
Other Sources of Air Pollution
World Trade Center bombings (9-11) 3,300 fatalities Over 18,000 people suffering health problems linked to attack and rescue (multiple toxic pollutants in smoke and rubble First responders suffer elevated rates or asthma, abnormal spirometry, GERD, depression, PTSD, panic disorder, and cancer James Zadroga Health and Compensation Act of 2010 provides for some coverage of monitoring, treatment, and victim compensation
 3,300 fatalities. Over 18,000 people suffering health problems linked to attack and rescue (multiple toxic pollutants in smoke and rubble. First responders suffer elevated rates or asthma, abnormal spirometry, GERD, depression, PTSD, panic disorder, and cancer. James Zadroga Health and Compensation Act of 2010 provides for some coverage of monitoring, treatment, and victim compensation.")
79
Noise Pollution Common in inner cities, hospital wards
Average sound level 72dB in hospital wards WHO recommends no more than 35dB Adverse health effects include increased risk of HTN, ischemic heart disease, delayed wound healing, aggressive behavior, need for psychiatric and pain medications, GERD symptoms, hearing loss in neonates, and increased rates of rehospitalization

80
Garbage

81
Garbage 98% of the country’s total refuse is industrial waste; 2% municipal waste Making 1 lb of sellable product generates avg. 32 lbs. of waste

82
Garbage American produce 4.5 lbs/d garbage
1,680 lbs/person/yr Only 1.5 lbs recycled Newer estimate is 7.1 lbs/d In a lifetime, the average American generates 102 tons of trash

83
U.S. Garbage Composition
Paper and Paperboard - 34% Average American receives 41 lbs of junk mail per year Yard Waste - 13% Food Waste - 12% Plastics - 12% Metals - 8% Glass - 6% Wood - 5%

84
U.S. Recycling Rates Tires - 22% Plastic containers - 25%
Overall plastics – 7% Glass containers - 28% Yard waste - 41% Paper and Paperboard - 55% Aluminum packaging - 54% Steel cans - 60% Auto batteries - 93%

85
Garbage Average recycling rate for cities = 34% San Francisco = 78%
One half of US has no curbside recycling pickup Landfills Incinerators Between ¼ and ½ of rural Americans burn their trash Accounts for 1/3 of U.S. dioxin emissions Outlawed in some states

86
Garbage Garbage Exports Scrap is the leading US export
Mafia involved in $22 billion-a-yr illicit wasted trade 15 million grassroots recyclers / waste pickers living in garbage dumps worldwide

87
Toxins

88
Toxins 6 trillion tons of over 85,000 chemicals produced annually
new chemicals registered each year 2/3 of those introduced since 1983 marked “trade secret,” making investigation difficult More than 90% have never been screened for toxicity Consequence of 1976 Toxic Substances Control Act

89
Toxic Pollutants The chemical industry is a $450 billion enterprise in the U.S. alone Chemical manufacturers are not required to prove safety The legal burden is on the government to prove that a product is dangerous

90
Pesticides 5 billion lbs/yr pesticides worldwide
1.1 billion lbs/yr in U.S. About 3 lbs/person/yr in U.S.

91
Pesticides Only 5 states (CA, LA, MI, TX, NY) currently track pesticide sales and use and/or collect data on pesticide-related illnesses 2008: USDA axes national survey charting pesticide use Pesticide warnings in English only EPA, NAS currently allows pesticide testing in humans, despite strong opposition Monsanto’s Roundup purchased by US government for aerial spraying in Colombia as part of “War on Drugs” Pesticide black market

92
Pesticides EPA: U.S. farm workers suffer up to 300,000 pesticide-related acute illnesses and injuries per year 25 million cases/yr worldwide NAS: Pesticides in food could cause up to 1 million cancers in the current generation of Americans

93
Pesticides WHO: 1,000,000 people killed by pesticides over the last 6 years US health and environmental costs $12 billion/yr (2005)
 .")
94
Pesticides Linked to autism, Parkinson’s Disease, Alzheimer’s disease, diabetes, obesity (with prenatal exposure), depression, ADHD Autism spectrum disorders affect 1/88 children in U.S. Children living on or near farms score 5 points lower on IQ tests and other mental and verbal tests May be due to pesticide exposure

95
Anthropological Study of Children Exposed to Pesticides
Children from villages practicing organic agriculture Children from villages practicing non-organic agriculture

96
Pesticides

98
Pesticides $2.4 billion worth of insecticides and fungicides sold to American farmers each year Pesticide runoff contributes to coastal dead zones Over 200 (e.g., Baltic Sea, Mouth of Mississippi in Gulf of Mexico, Chesapeake Bay, off Oregon/Washington coast) Red tides Pesticides inhibit nitrogen fixation, decrease crop yields
 Red tides. Pesticides inhibit nitrogen fixation, decrease crop yields.")
99
Pesticides Evidence suggests that pesticides promote pests (vs. natural pesticides) 30% of medieval crop harvests were destroyed by pests vs % of current crop harvests Implies organic farming more cost-effective

100
Pesticides and Produce
The Dirty Dozen: apples, celery, sweet bell peppers, peaches, strawberries, nectarines (imported), grapes, spinach, lettuce, cucumbers, blueberries (domestic), potatoes The Clean 15: onions, avocados, sweet corn, pineapples, mangos, asparagus, sweet peas, kiwis, cabbages, eggplant, papayas, watermelon, broccoli, tomatoes, sweet potatoes
, grapes, spinach, lettuce, cucumbers, blueberries (domestic), potatoes. The Clean 15: onions, avocados, sweet corn, pineapples, mangos, asparagus, sweet peas, kiwis, cabbages, eggplant, papayas, watermelon, broccoli, tomatoes, sweet potatoes.")
101
Toxins Body burden of industrial chemicals, pollutants and pesticides high Environmental Working Group (2004)found 287 pesticides, consumer product ingredients, and wastes from burning coal, gasoline, and garbage in umbilical cord blood Many other compounds not even tested; numbers undoubtedly higher
found 287 pesticides, consumer product ingredients, and wastes from burning coal, gasoline, and garbage in umbilical cord blood. Many other compounds not even tested; numbers undoubtedly higher.")
102
Toxins Fetuses and children most vulnerable
Birth defects, learning disabilities increasing Toxins play important role UK Food Standards Agency has called for a phase out of 8 artificial dyes linked to hyperactivity in children

103
Toxins and gender Sex ratio changing: Cryptorchidism increasing
Normal = 105 boys/girls born (skewed by early male mortality) Fewer boys being born in industrialized countries Other causes include obesity, older parental age, stress, fertility aides Situation far worse in Arctic Cryptorchidism increasing Risk factor for testicular cancer Micropenis, hypospadias increasing
 Fewer boys being born in industrialized countries. Other causes include obesity, older parental age, stress, fertility aides. Situation far worse in Arctic. Cryptorchidism increasing. Risk factor for testicular cancer. Micropenis, hypospadias increasing.")
104
Phthalates/Bisphenol A
Found in construction materials, clothing, toys, cashier receipts, cosmetics, pills, dental fills/sealants, added to PVCs in IV tubing/other plastics At least 47 million prescription meds Exposure levels very high FDA approves 5 million metric tons consumed by industry per year (13% in the U.S.) Exxon Mobil and BASF dominate the market
 Exxon Mobil and BASF dominate the market.")
105
Phthalates/Bisphenol A
Wal-Mart, Target, Toys ‘R’ Us phasing out, San Francisco, California, Europe, and Canada have banned phthalates; Australia phasing out use in baby bottles 9 states, Chicago, Multnomah County (Portland), OR, and Suffolk County, NY have banned BPA in baby bottles and sipper cups Consumer Product Safety Commission reforms of 2008 eliminate lead and phthalates from toys and children’s products Sugar-derived epoxy lining could replace BPA in cans
, OR, and Suffolk County, NY have banned BPA in baby bottles and sipper cups. Consumer Product Safety Commission reforms of 2008 eliminate lead and phthalates from toys and children’s products. Sugar-derived epoxy lining could replace BPA in cans.")
106
Phthalates/Bisphenol A
2009: Ban Poisonous Additives Act (to ban use of BPA in food and beverage containers and items used by young children) submitted in U.S. House and Senate 2009: BPA-Free Kids Act (to ban BPA in food and beverage containers and utensils marketed for children aged 3 or younger) introduced into U.S. Senate 2012: EPA bans BPA in baby bottles and sippy cups, but not food packaging Substitutes (e.g., biphenol sulfonate or BPS) also estrogen-like endocrine disruptors
 submitted in U.S. House and Senate. 2009: BPA-Free Kids Act (to ban BPA in food and beverage containers and utensils marketed for children aged 3 or younger) introduced into U.S. Senate. 2012: EPA bans BPA in baby bottles and sippy cups, but not food packaging. Substitutes (e.g., biphenol sulfonate or BPS) also estrogen-like endocrine disruptors.")
107
Phthalates/BPA 90% of government-funded studies found adverse health effects vs. 0% of industry-funded studies Associated with: demasculinization and alterations in genitalia in male infants low birth weight lower and higher testosterone levels PCOS in women Early menopause lower sperm counts in adults; impaired sperm function male sexual dysfunction

108
Phthalates/BPA Associated with: Infertility
Decreased effectiveness of IVF childhood behavioral, emotional, and conduct problems obesity asthma heart disease diabetes elevated liver enzymes Meningiomas

109
Phthalates/PVCs and Medical Devices
EPA regulations weak, based on 50-year old study FDA has advised healthcare providers to use alternatives to DEHP-containing PVC medical devices, esp. in neonatal units Banned by EU, CA, and WA Federal legislation pending

110
Triclosan Pesticide used as an antimicrobial in many soaps and hand sanitizers, including those commonly used in hospitals Also found in toothpastes, deodorants, colognes Linked to reproductive, endocrine, and developmental damage in animals

111
Triclosan FDA: Antibacterial soaps are no more effective than regular soap and water in fighting infection AMA: It may be prudent to avoid the use of antimicrobial agents in consumer products Use restricted in EU, Canada, Japan

112
Food Dyes None of the 9 artificial food dyes approved for use in the U.S. has been proven safe E.U. warning labels required for six food dyes: “may have an adverse effect on activity and attention in children.” Animal studies suggest some may be carcinogenic

113
Teflon (PFOA – perfluorooctanate)
Non-stick material made by Dupont Chemicals released under high heat and when cookware damaged Exposure linked with cancer, birth defects, heart disease, peripheral arterial disease, and liver damage Dupont hit with largest-ever civil penalty ($10.25 million) in 2006 for concealing health consequences and transmission from mother to fetus
 in 2006 for concealing health consequences and transmission from mother to fetus.")
114
Flame Retardants Polybrominated diphenyl ethers (PBDEs) found in furniture produced before 2004 ban Newer brominated and chlorinated flame retardants Slow spread of flames, but release carbon monoxide and hydrogen cyanide when burned (these compounds account for 60-80% of fire-related deaths)
")
115
Pepper Spray Contains TCE (trichloroethylene) and PCE (tetrachloroethylene) Both can cause liver and kidney cancer, lymphoma, and other illnesses
 and PCE (tetrachloroethylene) Both can cause liver and kidney cancer, lymphoma, and other illnesses.")
116
Toxic Pollutants – Economic Costs
Americans pay more than $55 billion annually for direct medical expenses plus special schooling and long-term care for pediatric diseases caused by lead This excludes the greatest toxic pollutant - tobacco

117
Lead Affects brain development, associated with lower IQ, ADHD, depression, panic disorder No safe level for neurological development Levels between 4 and 10 significantly increase risk of cardio- and cerebrovascular disease Elevated levels associated with depression, anxiety, crime, and violent behavior Pre-natal and post-natal exposure

118
Lead Poor, African-Americans, and Hispanics more commonly exposed
Levels declining in US However 83,000 tons of lead shot into environment annually in U.S. (bullets) Developing world at risk Due to increased environmental exposure and, possibly, early umbilical cord clamping 12 million people worldwide lead poisoned
 Developing world at risk. Due to increased environmental exposure and, possibly, early umbilical cord clamping. 12 million people worldwide lead poisoned.")
119
Leaded Gasoline Banned in Canada in 1990, US in 1996 (after 25-year phase-out period), EU in 2002, Africa in 2006 Ban fought by industry for decades Lead paint banned in U.S. in 1978 after decades of industry push-back 6 countries still sell small amounts of leaded gasoline: North Korea, Iraq, Afghanistan, Algeria, Myanmar/Burma, and Yemen (all to phase out by 2013

120
Mercury Syphilis Treatment - 15th Century onward
- abandoned 1940 for penicillin Recognized as cause of disease in 19th Century (Hunter-Russell Syndrome) - chemists, hatters
 - chemists, hatters.")
121
Mercury: S/S, Dx, and Rx S/S: neuropsychiatric symptoms, excessive salivation/inflammation of gums, rash, nephropathy Linked to autism Dx: mercury levels in air, blood, urine (>100 mcg/l in blood and/or urine = toxic) Rx: chelation with BAL, penicillamine, DMPS, DMSA
 Rx: chelation with BAL, penicillamine, DMPS, DMSA.")
122
Minimata Disease: Signs and Symptoms
Acute / Chronic Poisoning: numbness, slurred speech, ataxia, unsteady gait, deafness, poor vision, dysphagia, hypersalivation, confusion, drowsiness/stupor to irritability/restlessness; chronic liver disease, liver cancer, hypertension, autoimmune disorders death within a few months if severe Rx EDTA – only partially effective

123
Minimata Disease: Signs and Symptoms
Congenital: high dose → infertility; medium dose → spontaneous abortions; low dose → congenital disease S/S: poor physical growth, developmental delay, ADHD, impaired speech/chewing/swallowing, muscle tone abnormalities, involuntary movements, constricted visual fields, hearing loss - EDTA not effective

124
Mercury Released into air by coal combustion, industrial processes, mining, waste disposal, and volcanoes; concentrated (along with lead, arsenic, and other heavy metals) in coal ash 4500 tons/yr
 in coal ash tons/yr.")
125
Mercury Travels throughout atmosphere and settles in oceans and waterways Bacteria convert it to toxic methyl-mercury Travels up food chain via fish Avoid top predators (tuna, shark, swordfish)
")
126
Gold Mining Gold = Cyanide + Mercury
Mercury used to capture gold particles as an amalgam Gold leached from ore using cyanide Cyanide paralyzes cellular respiration At least 18 tons of mine waste created to obtain the gold for a single 3 oz., 18k ring

127
Gold Mining and Mercury
Contaminated groundwater often sits in large toxic lakes held in place by tenuous dams Release of cyanide and mercury into local waterways kills fish, harms fish-eating animals, and poisons drinking water

128
Mercury 16% of women of childbearing age exceed the EPA’s “safe” mercury level Freshwater fish mercury levels too high for pregnant women to eat in 43 states Fish intake decreases risk for SGA newborn, but mercury can cause SGA

129
Mercury Mercury dental amalgams pose health risks to pregnant women, unborn babies, and children (FDA) Contaminant in high fructose corn syrup

130
Arsenic Contaminates groundwater in Bangladesh, also, India, China, Mexico, Argentina, Thailand, Vietnam, and parts of the U.S. 13 million Americans have drinking water exceeding EPA’s “safe level” Exposure also via rice (esp. brown), seafood Also found in apple and grape juices
, seafood. Also found in apple and grape juices.")
131
Arsenic Used to pressure treat wood in US and elsewhere
Primarily wooden structures built before 2005 Causes discoloration of skin, GI upset/N/V/D, numbness, paralysis, and blindness Linked to learning disabilities, heart disease, and bladder/lung/skin cancers

132
Health Consequences of Arsenic Exposure
Miscarriage, low birth weight Pigmentary skin changes Diabetes Heart Disease Increased risk of lung, bladder, and skin cancers Bone degeneration and deformities

133
Heavy Metals Heavy metals found in over half of low cost jewelry sold in the U.S. Lead, mercury, or arsenic found in 1/5 of both U.S.- and India-manufactured Ayurvedic medicines purchased via the internet

134
Manganese Welders exposed via fumes
Causes “manganism” (like Parkinson’s Disease) Welding companies covered up link for decades (like lead paint, etc.)
 Welding companies covered up link for decades (like lead paint, etc.)")
135
Cadmium Cigarettes most common source of exposure
Can delay pregnancy and cause neurological damage, osteoporosis, periodontal disease, and breast cancer

136
Phosphorus/Phosphates
Phosphorus in dishwater detergents Contribute to eutrophication, harmful algal blooms Banned in 16 states Phosphate in fertilizers Agricultural runoff contributes to algal blooms, dead zones World supply running critically low Composting would recycle, return to soil

137
Perchlorate (PERC) Perchlorate
Toxic air pollutant, endocrine and reproductive toxin, likely human carcinogen, exposure increases risk of bipolar disorder and PTSD Used in rocket fuel, dry cleaning Alternative = “wet cleaning” with compressed, liquefied CO2 EPA requiring phaseout of use in residential areas by 2020

138
Parabens Preservative used in food products, toiletries, cosmetics
Estrogenic May increase risk of breast cancer

139
Radon Comes from natural decay of uranium in soil
1/15 U.S. homes has elevated levels Cause of lung cancer Causes 15,000 to 22,000 lung cancer deaths in U.S. each year Home detectors available, relatively inexpensive Remediation lowers risk

140
Supplements and Milk Melamine scare with Chinese milk products
Kidney failure 37/40 herbal dietary supplements tested by GAO in 2010 contained trace amounts of at least one hazardous metal (lead, mercury, arsenic) Supplements do not require FDA approval pre-marketing
 Supplements do not require FDA approval pre-marketing.")
141
Artificial Turf Made from “crumb rubber,” derived from recycled tire bits Contains lead, mercury, benzene, harmful bacteria High levels of inhalational exposure among young athletes New York City park officials will no longer use tire crumbs in artificial turf fields (alternative = sand-based product)
")
142
Cell phones ?Link to parotid gland tumors?
Link to brain tumors per WHO Gliomas Acoustic neuromas Precautionary principle – hands-free headset ?Other safety benefits?

143
Toxic Pollutants 85,000 known or suspected hazardous waste sites in the U.S. Plus up to 600,000 lightly contaminated former industrial sites (“brownfields”) Will cost hundreds of billions of dollars to mitigate environmental impacts
 Will cost hundreds of billions of dollars to mitigate environmental impacts.")
144
Toxic Pollutants 1 in 4 U.S. citizens lives within 4 mile of a Superfund site (over 1600 sites listed; another 2,500 sites eligible) ½ live within 10 miles Taxpayers paying increasing share of cleanup costs Overall funding decreasing

145
Environmental Racism and Toxic Imperialism
Polluting factories/waste dumps/incinerators more common in lower SES neighborhoods “Cancer Belt” (Baton Rouge to New Orleans) More cardiovascular disease Toxic Imperialism WHO estimates toxic chemical exposures responsible for 4.9 million deaths and 86 million DALYs in 2004
 More cardiovascular disease. Toxic Imperialism. WHO estimates toxic chemical exposures responsible for 4.9 million deaths and 86 million DALYs in")
146
Toxic Pollutants: The Basel Convention
The Basel Convention on the Control of Transboundary Movements of Hazardous Wastes (designed to control dumping of hazardous wastes from the industrialized world in developing countries)
")
147
Toxic Pollutants: The Basel Convention
Ratified by 170 countries Despite being the largest producer of toxic pollutants in the world, the U.S. has signed but not ratified this agreement

148
Bathtub, Toilet, and Source of Drinking Water

149
Persistent Organic Pollutants
Toxic, remain in environment long-term, resist degradation, can travel long distances Bioaccumulate - higher concentrations as you move up the food chain Most are endocrine disruptors

150
Endocrine Disruptors Linked to: Obesity Insulin resistance Diabetes
Early age of onset of puberty in young girls ; 1920 – 14.6; 1950 – 13.1; 1980 – 12.5; 2010 – 10.5; 2012 – 9.9 (whites), 8.8 (blacks) Boys too (9-10)
, 8.8 (blacks) Boys too (9-10)")
151
Endocrine Disruptors Linked to:
PCOS, endometriosis, uterine fibroids, premature ovarian failure, early menopause Male and female reproductive tract abnormalities Impaired fertility, defective sperm Low birth weight, impaired fetal development and fetal anomalies

152
Endocrine Disruptors Linked to:
Multiple cancers (including breast, colon, prostate, testicular) Thyroid disease Neuroendocrine abnormalities Epigenetic effects
 Thyroid disease. Neuroendocrine abnormalities. Epigenetic effects.")
153
Endocrine Disruptors Endocrine Society, AMA, and APHA have called for policies to decrease public exposure to endocrine disruptors

154
Persistent Organic Pollutants
UN Environmental Program organizing worldwide phaseout of top 12 through the Stockholm Convention on Persistent Organic Pollutants Including DDT, PCBs, and dioxins U.S. has signed, but not ratified

155
Toxic Pollutants Floriculture Diamond and Gold Mining
Cosmetics (see Fragrances Scented candles Nanoparticles

156
Medical Waste The 6,000 US hospitals generate 2 million tons of waste per year; clinics and doctors’ offices an additional 700,000 tons 850,000 tons incinerated 15% infectious waste incinerated pollutants include dioxin, mercury, cadmium and lead

157
Medical Waste One hospital bed generates between 16 and 23 lbs/day of waste Outbreak of hepatitis B in India due to black market in medical waste and supplies (2009)
")
158
Medical Waste Solutions: Strengthen EPA regulations
Segregation and alternatives to incineration would cost < $1/patient/day 80% of thermometers no longer contain mercury Remove PVCs from medical supplies (e.g., IV tubing)
")
159
Medical Waste Organizations: Health Care Without Harm
Green Health Center Movement NAS: Hospitals built and operated on more environmentally sound principles save money and produce better patient outcomes

160
Electronic Waste 40 million tons/yr
Average lifespan of a computer is 2 years Only 5-10% of computers recycled Most sent overseas Some e-waste returns to U.S. in children’s jewelry

161
Electronic Waste EU now requires electronics firms to recycle and to eliminate lead, cadmium and mercury from their products Maine passed first law requiring electronic manufacturers to pay for recycling their discarded products 2012: US requires electronic equipment bought with federal dollars to be recycled

162
Water UN adopted water as a human right in 2002
International Covenant on Economic, Social, and Cultural Rights US has signed but not ratified

163
Water Only 2.5% of the earth’s water is fresh
2/3 of this locked up in glaciers and ice caps As glaciers and polar ice caps melt, this is mixed with sea water

164
Water U.S. water consumption: 81% irrigation, 6% domestic use
Water and sewage system infrastructures decaying 1 of every 6 gallons in city pipes leaks away into ground

165
Water Global water consumption doubling every 20 years
Worldwide freshwater supplies dwindling Drying up: Aral Sea, Great Lakes, etc. Water expected to be major cause of wars worldwide in 21st Century

166
Water Clean Water Act of 1972 has decreased pollution in the US
But 80% of US waterways never receive any comprehensive testing for pollutants

167
Water In developing countries, 90-95% of sewage and 70% of industrial wastes are dumped untreated into the local water supply 13,000-15,000 deaths per day worldwide from water-related diseases 4/10 people worldwide have no access to any latrine, toilet, bucket or box

168
Water Pollution and Plastics
120 billion lbs of plastics generated each year, using 4% of world oil supplies Every year more than 500 billion plastic bags discarded worldwide Bioplastics made from agricultural waste using renewable energy could be carbon neutral or even carbon negative

169
Water Pollution and Plastics
Texas-sized “great garbage patch” in North Pacific holds estimated 100 million tons of mostly plastic trash 6 times the mass of plankton there Most has degraded to microplastics, which bond with PCBs, DDT, and endocrine disruptors, making this area a million times more toxic than surrounding areas Harmful to marine life Works its way up food chain Great Lakes also affected

170
Water Out of 191 nations in the world, 10 nations share 65% of the world’s annual water resources A woman in a developing country walks an average of 6 km/day to obtain water

171
Water Privatization schemes supported by the World Bank and IMF lead to price increases, worsen poverty 5-10% of world’s water privatized – increasing $1 trillion market Privatization increases costs, incites social unrest (e.g., Cochabamba, Bolivia) 15% of US water in private hands
 15% of US water in private hands.")
172
Bottled Water Bottled water a $400 billion/yr profit-driven industry
10 billion gallons/yr in U.S. Costs up to 1,900 times more than tap water Uses up to 2,000 times more energy to produce than tap water Up to 44% is tap water

173
Bottled Water Ratio of amount of water needed to produce 1 plastic bottle to amount of water in the bottle = 2:1 Weaker standards, 33-44% is just tap water, dangers of plastics, energy costs/global warming, reduction of local water tables, recycling rate of plastic bottles only 25%

174
Bottled Water “Water is an efficient product. It is a product which normally would be free, and it is our job to sell it.” Suez CEO Gerard Mestrallet

175
Bottled Water San Francisco has banned city purchases of bottled water
Water expected to be the major cause of wars by 2050 or sooner

176
Water Pollution – Increased Beach Closings

177
Infamous Industrial Disasters
Minimata, Japan, 1920s-1970s Chisso Corporation Methylmercury poisoning 400 dead; 10,000 injured

178
Minimata Disease W Eugene Smith

179
Infamous Industrial Disasters
Bhopal, India, 1984 (Union Carbide, purchased by Dow in 2001) - methyl isocyanate gas ,000 dead within 3 days, 15,000-20,000 more over next 10 years; 150, ,000 injured and/or with resulting health problems Persistent water and soil contamination
 - methyl isocyanate gas ,000 dead within 3 days, 15,000-20,000 more over next 10 years; 150, ,000 injured and/or with resulting health problems. Persistent water and soil contamination.")
180
Infamous Industrial Disasters
Bhopal U.S. has refused Indian government extradition request for Warren Anderson Union Carbide settled with Indian government for $470 million in 1989 (victims received $1,500/death, $500/injury) 2012: US Court absolves Union Carbide of liability
 2012: US Court absolves Union Carbide of liability.")
181
Infamous Industrial Disasters
Love Canal: Hooker Electrochemical Company (parent company Occidental Petroleum) dumps over 21,000 tons of chemical waste in 1940s and 1950s Miscarriages, birth defects, cancers Occidental found liable
 dumps over 21,000 tons of chemical waste in 1940s and 1950s. Miscarriages, birth defects, cancers. Occidental found liable.")
182
Infamous Industrial Disasters
Leads to Superfund Law Today only seven states prohibit construction of schools on or near hazardous waste sites Half-million children attend schools within ½ mile of toxic waste dumps in NY, NJ, MA< and MI alone

183
Infamous Industrial Disasters
Chernobyl, USSR, nuclear power plant explosion 200 times the radiation of Hiroshima + Nagasaki died immediately, up to 1,000 injured acutely, NCI estimates 10-75K thyroid cancers (other estimates much lower) - some estimates as high as almost 1 million deaths
 - some estimates as high as almost 1 million deaths.")
184
Chernobyl Higher risk of neural tube defects and childhood leukemia among those living near nuclear power plants Anxiety a major problem Ukraine still spends 6% of its GDP each year on Chernobyl-related matters

185
Infamous Industrial Disasters
1989 Alaska, Exxon Valdez - oil spill -wildlife devastated, $5 billion damage Punitive damages overturned by U.S. Supreme Court Renamed “Oriental Nicety,” still sailing 2001 Gulf Oil spill (Retreating Iraqi Army pumped 8 million barrels oil into Persian Gulf to prevent US marines from making landfall)
")
186
Infamous Industrial Disasters
2006 BP Alaskan pipeline ruptures 2010 BP Gulf disaster (and Michigan oil spill) 2012: Legal settlement $7.8 billion and counting 2011 Exxon Mobil oil pipeline rupture and spill into Yellowstone River
 2012: Legal settlement $7.8 billion and counting Exxon Mobil oil pipeline rupture and spill into Yellowstone River.")
187
Oil and Water 1.3 million metric tons of oil enters oceans each year
46% seepage from natural deposits 8% tanker spills Exxon Valdez 38,800 metric tons ABT Summer disaster off southwest coast of Africa (1991) – 260,000 metric tons Remainder = industry, runoff UN phase-out of single-hulled tankers begins 2010
 – 260,000 metric tons. Remainder = industry, runoff. UN phase-out of single-hulled tankers begins")
188
Oil Pollution is Expensive to Clean Up

189
Oil Slicks Kill Marine Life

190
Top ten most polluted places on the planet
Air pollution – Linfen, China Industrial chemicals – Bhopal, India Mercury – Central Kalimantan province, Indonesia Pesticides – Kasargod, India Chemical weapons manufacturing – Dzerhinsk, Russia

191
Top ten most polluted places on the planet
Organic chemicals – Sumgayit, Azerbaijan Lead – Tianying, China Hexavalent chromium – Sukinda, India Radiation – Chernobyl, Ukraine Persistent organic pollutants – Arctic Canada

192
Deforestation Tropical forests constitute 7% of land surface area, contain > 50% of plant and animal species Majority of tropical forests destroyed Over one acre of world’s forest cut down every second 25 million trees/yr 50% of global wetlands destroyed (54% in U.S.) 100,000 acres lost per year in U.S.
 100,000 acres lost per year in U.S.")
193
Deforestation Historical -Easter Island (Polynesians), Middle East, U.S. Southwest (Anasazi Indians) Contemporary -Mauritania, Ethiopia, Haiti deforested -Philippines and Thailand are now net importers of forest products, looking at Latin America Next? -Indonesia, Burma, Papua New Guinea, Russian Far East, Amazon, B.C., Alaska, many others

194
Deforestation: Causes
New agricultural settlements (overpopulation, poverty, unsustainable farming practices) Logging Oil and gas exploration Drilling in ANWR would drop gas prices 4 cents per gallon, after a 15 year waiting period, and assuming companies sell oil to U.S. consumers Cattle ranching Drug cultivation -Peru, Bolivia, Columbia
 Logging. Oil and gas exploration. Drilling in ANWR would drop gas prices 4 cents per gallon, after a 15 year waiting period, and assuming companies sell oil to U.S. consumers. Cattle ranching. Drug cultivation -Peru, Bolivia, Columbia.")
196
Clearcutting

197
Clearcutting

198
Clearcutting with Corridors

200
Global Warming

201
Global Warming Greenhouse effect
30% increase in atmosphere CO2 since industrialization began (6.25 billion tons/year) Fossil Fuels (CO2) Methane, choloroflurocarbons, nitrous oxide, sulfur oxides Methane 25 times more heat than CO2, large amounts stored in permafrost Obesity
 Fossil Fuels (CO2) Methane, choloroflurocarbons, nitrous oxide, sulfur oxides. Methane 25 times more heat than CO2, large amounts stored in permafrost. Obesity.")
202
Global Warming 80% of carbon emissions from burning fossil fuels; 20% from deforestation, other land use changes 391 ppm CO2 (over 350 ppm dangerous) CO2 currently being released at almost twice the rate it is being removed Plants and soil absorb 1/3, ocean waters about ¼, the rest stays airborne
 CO2 currently being released at almost twice the rate it is being removed. Plants and soil absorb 1/3, ocean waters about ¼, the rest stays airborne.")
203
Global Warming Sources of methane: Natural – 41%
Wetlands - 29% Lakes, wild animals and termites, bodies of water - 12% Human Influenced – 59% Animal agriculture – 21% Natural gas / oil – 13% Waste disposal – 10% Caol and biomass – 7% Rice – 6% Other 2%

204
Global Warming The last 20 years have been the hottest ever recorded (data go back to 1856) 2012 hottest year on record (most other years between 2000 and 2009 a close second) Average global surface temperature = 58.3° Hottest temperature in last 10,000 years
 Average global surface temperature = 58.3° Hottest temperature in last 10,000 years.")
205
Global Warming Estimated degree increase in average global temperature by 2100 Far North, Pacific Northwest warming up faster than other parts of the planet

206
Consequences of Global Warming
150, ,000 deaths and million disability-adjusted life years lost per year WHO, UN Environment Program Expected to double by 2030

207
Consequences of Global Warming
↑ weather extremes/natural disasters/insurance claims Drought, flooding, severe storms Weather-related disasters cost U.S. over $50 billion in 2011 Ocean acidification → corals dying, rise of jellyfish (cockroaches of the sea)
")
208
Consequences of Global Warming
Floods, cholera, rising malaria zone Dengue fever, malaria, yellow fever, even plague now being seen in Europe Increased Chagas, yellow fever, chickungunya virus in U.S.

209
Weather Extremes Headline from “The Onion”
Hurriphoonado Cuts Swath Of Destruction Across Eastern, Western Hemispheres

210
Consequences of Global Warming
Polar icecaps/glaciers/Greenland ice sheet/Patagonian glaciers/Himalayas/permafrost melting, sea levels rising (est. at least 3 feet over 21st Century) Arctic ice pack has lost 40% of its thickness compared with 1960
 Arctic ice pack has lost 40% of its thickness compared with")
211
Consequences of Global Warming
Glacier National Park’s glaciers melting Great Lakes ice coverage down 71% over last 40 years Snows of Kilimanjaro down 85% compared to 1912; will be gone by 2015

212
Consequences of Global Warming
Droughts World’s oldest/biggest trees dying (10X background rate) Ice islands threaten shipping lanes and offshore oil platforms
 Ice islands threaten shipping lanes and offshore oil platforms.")
213
Glaciers Calving

214
Polar Bears Stranded / Dying Off

215
Greenland’s Ice Cap Melting: 1992

216
Greenland’s Ice Cap Melting: 2002

217
Greenland’s Ice Cap Melting: 2005

218
Consequences of Global Warming
Increased allergies/asthma/anaphylaxis Rising temperatures increase smog/ground level ozone Ozone stunts plant growth Higher levels of CO2 favor growth of ragweed and other pollen-producing plants

219
Global Warming The top 1/5 of the world’s largest 145 countries account for 63% of global C02 emissions (lowest 1/5 = 2%) The countries likely to be most affected by global warming are those least responsible for the increases in global temperature Climate refugees Disappearing locales: Tuvalu, Vanuatu, Kivalina (Alaska), Male (Maldives)
, Male (Maldives)")
220
Global Warming Increases Droughts

221
Agriculture Global per capita cropland down over 50% from 1961 to 0.6% acre Soil erosion exceeds soil formation In the past 40 years, 1/3 of U.S. topsoil has eroded Takes 1,000 years to “grow” 1 inch of soil

222
Agriculture Livestock responsible for more greenhouse gas emissions than the entire transportation sector Methane, CO2, and NO Grass-fed cattle healthier, produce less methane, contain less saturated fat

223
Agriculture Water use has tripled since 1950, up 6-fold over 20th Century 70% of freshwater use in agriculture; 20% for agriculture; 10% for domestic purposes

224
Large scale irrigation/power projects
China’s Three Gorges Dam World’s largest power station (second largest generator after Itaipu Dam on border of Brazil and Paraguay) $59 billion project Displacing 1.5 million people Loss of valuable archeological sites
 $59 billion project. Displacing 1.5 million people. Loss of valuable archeological sites.")
225
China’s Three Gorges Dam

226
Wasted Food Household food waste adds up to $43 billion/yr in the U.S.
40% of all food produced in U.S. wasted An average American family of four tosses out $590/yr food Americans discarded 3 times as much food in 2005 as in 1985 96 billion lbs/yr in America (2009)
")
227
Decreasing crop diversity
75,000 plant species are edible Humans have utilized 7000 plant species for food Rice, wheat, and maize provide 2/3 of the world’s food supply 20% of species provide 80% of the world’s food supply Consequences: decreasing genetic diversity, vulnerability to disease, huge crop losses (e.g., Irish potato famine)
")
228
Factory Farming Factory farms have replaced industrial factories as the # 1 polluters of American waterways 1.4 billion tons animal waste generated/yr 130 x human waste 1 hog farm in NC generates as much sewage annualy as all of Manhattan

229
Factory Farming

230
Factory Farming

231
Factory Farm Waste Most untreated Ferments in open pools
Seeps into local water supply, estuaries Kills fish Causes human infections - e.g., Pfisteria pescii, Chesapeake Bay Creates unbearable stench Widely disseminated by floods/hurricanes

232
Agricultural Antibiotic Use
Agriculture accounts for 80% of U.S. antibiotic use Use up 50% over the last 15 years

233
Antibiotic Resistant Pathogens
CDC: “Antibiotic use in food animals is the dominant source of antibiotic resistance among food-borne pathogens.” $4billion/yr to treat antibiotic-resistant infections in humans Campylobacter fluoroquinolone resistance VREF (poss. due to avoparcin use in chickens)
")
234
Alternatives to Agricultural Antibiotic Use
Decrease overcrowding Better diet/sanitation/living conditions Control heat stress Vaccination Increased use of bacterial cultures and specific antibiotic treatment in animals when indicated

235
Ending Agricultural Antibiotic Use
EU bans use of all antibiotic growth promoters effective 1/1/06 Three years after a Danish ban on routine use of antibiotics in chicken farming, the prevalence of antibiotic-resistant bacteria in chickens dropped from 82% to 12% US Preservation of Antibiotics for Medical Treatment Act, 2007 – awaiting vote

236
Overfishing Fisheries collapsing: Newfoundland cod West Coast salmon
1/3 of fish species threatened with extinction 90% drop in # of largest predatory ocean fish since 1950 Global fisheries collapse predicted by 2048 unless practices change Fish getting smaller due to global warming (warm water holds less oxygen)
")
237
Harmful Fishing Practices
Long-lining, bottom trawlers, drift nets Tear up seafloor, damage corals Large amounts of bycatch discarded Up to 20 lbs per lb of desired catch Cyanide fishing (400 kg/year) Dynamite Reef fishing Fishing with pesticides
 Dynamite Reef fishing. Fishing with pesticides.")
238
Factory Trawlers

239
Dynamite Reef Fishing

240
The Military Harms Fish
Environmental destruction Navy sonar harming/killing off whales Japanese/Norwegian whaling compounds problem Dolphins as mine detectors (in Vietnam and Iraq) Weaponizing sharks, dolphins, etc. (DARPA) Sharks already in severe decline due to hunting for fins
 Weaponizing sharks, dolphins, etc. (DARPA) Sharks already in severe decline due to hunting for fins.")
241
Coral Reefs Generate $30 billion/yr globally in fishing, tourism, and protection from storm surges Reefs make up 1% of ocean floor, support ¼ of all marine life

242
Coral Reefs Threatened by bleaching due to rising ocean temperature, acidification from increased CO2, runoffs from deforestation, pesticides pH of oceans down 0.1 from preindustrial times to 8 With current trends, pH will be 7.7 by 2100 At pH 7.8, shell formation ceases

243
Coral Reefs 10% of world’s reefs ruined (90% in Philippines), 30% in critical condition Jellyfish populations burgeoning (“cockroaches of the sea”) Americans purchase 350,000 pieces of live coral broken off from reefs per year vs. 90,000 for the rest of the world

244
Aquaculture 50% of fish now consumed worldwide is farmed (vs. 4% in 1970) 5-10% of U.S. fish consumption Almost all catfish and trout farmed Majority of shrimp 1/3 of salmon

245
Consequences of Aquaculture
No compensation to general public for potentially exclusionary use of public services for private profit Feed inefficiency (2-6 lbs of wild fish to raise 1 lb farmed fish) Decreased diversity Escapes, interbreeding with (and lowering fitness of) wild stocks
 Decreased diversity. Escapes, interbreeding with (and lowering fitness of) wild stocks.")
246
Consequences of Aquaculture
Antibiotics (incl. chloramphenicol), hormones, dyes, herbicides, pesticides, algicides → increased pollution and sewage Damage to local estuaries, birds of prey Disease
, hormones, dyes, herbicides, pesticides, algicides → increased pollution and sewage. Damage to local estuaries, birds of prey. Disease.")
247
Aquaculture Good seafood (clean water): Farmed bivalves: eat plankton
Freshwater farm fish (with pollution controls): rainbow trout, tilapia, catfish, arctic char Bad seafood Farmed salmon contains 10X as much PCBs as wild salmon
: rainbow trout, tilapia, catfish, arctic char. Bad seafood. Farmed salmon contains 10X as much PCBs as wild salmon.")
248
Maldistribution of Wealth
500 billionaires worldwide top 250 billionaires worth $1 trillion, the combined income of bottom 2.5 billion people (45% of world’s population)
")
249
Maldistribution of Wealth
Americans make up half the world’s richest 1% U.S: Richest 1% of the population owns 50% of the country’s wealth -poorest 90% own 30% -widest gap of any industrialized nation -2011 U.S. family median net income = $52,752 ($76,600 – Canada); net worth = $77,300 ($89,014 - Canada)
; net worth = $77,300 ($89,014 - Canada)")
252
The Stock Market 20% of Americans own stock; 90% of stocks and bonds owned by 10% The top 1% owns 51% of all stocks, bonds, and mutual fund assets. “Business” news

253
The Stock Market Interesting Fact: As a group, U.S. Senators beat the market by an average of 12% from (study published 2004) The best fund managers average 3% STOCK (Stop Trading on Congressional Knowledge) Act passes Congress (2012): Removes loophole exempting Congressional lawmakers and staff members from being prosecuted for “insider trading” for using knowledge gained in their work (political intelligence)
 Act passes Congress (2012): Removes loophole exempting Congressional lawmakers and staff members from being prosecuted for insider trading for using knowledge gained in their work (political intelligence)")
254
Consequences of Differential Stock Ownership
Corporations are answerable to their shareholders Governments are answerable (at least in theory) to their citizens (either through elections or revolutions)
 to their citizens (either through elections or revolutions)")
255
Maldistribution of wealth
The worldwide gap between rich and poor doubled between 1960 and 1990, and grew an additional 20% between 1990 and 1998, and continues to grow today Gap is higher in the U.S. than in any other industrialized nation Associated with 880,000 deaths per year over expected number if gap was same as in Western European nations

256
Worldwide statistical breakdown of wealth (2012)
Wealth over $2,138 = top 50% Wealth over $61,000 = top 10% Wealth over $510,000 = top 1% Top 2% of individuals own more than 50% of global wealth 34% of world’s wealth held in U.S. and Canada; 30% in Europe; 24% in wealthier Asian-Pacific countries; 12% in the rest of the world

257
Maldistribution of wealth
Less than 4% of the combined wealth of the 225 richest individuals in the world would pay for ongoing access to basic education, health care (including reproductive health care), adequate food, safe water, and adequate sanitation for all humans (UNDP)
, adequate food, safe water, and adequate sanitation for all humans (UNDP)")
258
Declaration of Independence
“All men are created equal.”

259
“Some people are more equal than others”
George Orwell “Some people are more equal than others”

260
Hudson River, 2009

261
Maldistribution of Wealth/Resources Threatens National Security and Requires a Permanent War Economy
“The U.S. has about 50% of the world’s wealth, but only 6.3% of its population. This situation cannot fail to be the object of envy and resentment. Our real task in the coming period is to devise a pattern of relationships which will permit us to maintain this position of disparity withoug positive detriment to our national security.” George Kennan, U.S. State Dept. Policy Planning Study, 1948

262
Voltaire “The comfort of the rich rests upon an abundance of the poor”

263
Primo Levi “A country is considered the more civilized the more the wisdom and efficiency of its laws hinder a weak man from becoming too weak or a powerful one too powerful.”

264
Thomas Jefferson “Experience declares that man is the only animal which devours its own kind, for I can apply no milder term to … the general prey of the rich on the poor.”

265
Racial Disparities: Economic
Median income of black U.S. families as a percent of white U.S. families: 60% in in 1968 62% in 2002 59% in 2010 (69% for Hispanic families)
")
266
Racial Disparities: Economic
Recession, housing crisis has hit black and Latino families harder than white families 7.5% on Blacks live in substandard housing (vs. 2.8 % of Whites) Educational disparities Higher levels of unemployment
 Educational disparities. Higher levels of unemployment.")
267
Racial Disparities: Economic
Criminal justice system involvement Toxic waste sitings / environmental injustice / environmental racism Persistent overt / subtle discrimination E.g., “driving while black”

268
Racial Disparities in Health Care Coverage
Percent uninsured: Whites = 12% Asians = 17% African-Americans = 21% Hispanics = 32% Undocumented immigrants = 100% (emergency care exception) CA Proposition 189
 CA Proposition 189.")
270
Racial Disparities: Health Care
Higher maternal and infant mortality Higher death rates for most diseases Shorter life expectancies Less health insurance Fewer diagnostic tests / therapeutic procedures

272
Health Disparities Among Latinos
Higher rates of: Overweight and obesity Certain cancers Stroke Diabetes Asthma/COPD Chronic liver disease/cirrhosis HIV/AIDS Homicide

273
Income Inequality Kills
Higher income inequality is associated with increased mortality at all per capita income levels Equalizing the mortality rates of whites and African-Americans would have averted 686,202 deaths between 1991 and 2000 Whereas medical advances averted 176,633 deaths AJPH 2004;94:

274
Income Inequality Lower life expectancy
Higher rates of infant and child mortality 20 million deaths/yr worldwide Short height Poor self-reported health AIDS

275
Income Inequality Depression Mental Illness Obesity Crime
Diminished trust in people and institutions

276
Overconsumption (Affluenza)
I = P x A x T (Human Impact = Population x Affluence x Technology) U.S. = 6.3% of world’s population Own 50% of the world’s wealth
 U.S. = 6.3% of world’s population. Own 50% of the world’s wealth.")
277
Overconsumption (Affluenza)
U.S. responsible for: -25% of world’s energy consumption -33% of paper use -72% of hazardous waste production (1 ton/person/year)
")
280
But are we happier? Workloads increasing, vacation and free time decreasing U.S. only OECD country not to guarantee paid leave Over 40% of private sector workforce do not have paid sick leave 2006: San Francisco ordinance guarantees one hour sick leave for every 30 hours worked

282
Guaranteed Paid Sick Leave: International Comparisons

283
But are we happier? Average American wastes 62 hrs/yr sitting in rush hour traffic Average American working 200 more hrs/yr than in 1960 (#1 in world) 8/10 Americans want a new job (CNNMoney.com, 11/03)
 8/10 Americans want a new job (CNNMoney.com, 11/03)")
284
But are we happier? Stress up / satisfaction with life down
5% of U.S. population suffer from a serious mental illness Anti-depressant use doubled between 1993 and 2005

285
But are we happier? 1/10 Americans over age 6 currently taking a psychotropic medication Pharmaceutical marketing plays a significant role 8.7 million Americans considered suicide in 2011 1.1 million attempted suicide

286
Erosion of social capital
Erosion of social capital is strongest where maldistribution of wealth is largest Americans have an average of 2 close friends today Down from 3 in 1985 Lack of social interaction as or more harmful than smoking, alcohol abuse, obesity

287
Erosion of social capital
1 in 4 Americans say they have no one with whom they can discuss important matters Includes nuclear family Was 1 in 8 in 1985 “Most people can be trusted” 1960: agree = 58% 1994: agree = 37% Greater income inequality associated with less trust in people and institutions

288
Maldistribution of Wealth
In countries with moderate levels of wealth, happiness is highest where income inequalities lowest and taxes most progressive Major League Baseball: teams are more successful when players’ salaries are more equitably distributed

289
Wealth Associated with: Sense of entitlement
Less attention to lower classes Presumption of superiority, “earned” rights Less ethical behavior

290
The Booming Economy Inflation-adjusted income of the median U.S. household $54,600 $49,000 $44,389 $49,777 $51,861

291
The Booming Economy Weekly wages for the avg. American worker are 12% below what they were in 1973 But productivity is up 33-78% $1.5 trillion needed to repair nation’s infrastructure Roads, bridges, water and sewer systems

292
Booming No Longer Financial meltdown of 2008 → Causes:
De-regulation of banks, insurance companies, and financial services companies via repeal of Glass-Steagall Act Housing bubble, sub-prime mortgages Greed Requiring huge bailouts Consumer Protection Agency may help

293
Vacation Time Down Americans work more than any other country: 1970 hrs/yr Canada (#2): 1800 hrs/yr Industrialized EU countries: hrs/yr Many advocate 30 hour workweek

294
Vacation Time Americans allotted 13 days leave per year (take less than 10) Italy 42 France 37 UK 28 Canada 26 Japan 25

295
Minimum Wage ≠ Living Wage
Federal minimum wage = $7.25/hr 18 states and DC have higher minimum wages (Oregon = $8.80/hr, 2012) $10,423/yr for full-time job Real value down 42% compared with 1968 Inadequate to pay rent, buy food and clothing 3 million homeless (13-17% of homeless adults work)
 $10,423/yr for full-time job. Real value down 42% compared with Inadequate to pay rent, buy food and clothing. 3 million homeless (13-17% of homeless adults work)")
296
Supplemental Nutritional Assistance (Food Stamp) Program
Covers 26 million Americans 35 million Americans (1/3 of them children) live in household that cannot consistently afford food) $1.05/person/meal 5-year residency requirement for adult legal immigrants Undocumented immigrants not eligible Inadequate signup rates
 live in household that cannot consistently afford food) $1.05/person/meal. 5-year residency requirement for adult legal immigrants. Undocumented immigrants not eligible. Inadequate signup rates.")
297
Minimum Wage ≠ Living Wage
¼ of US jobs pay less than a poverty-level income Wage theft common, worst among lowest paid workers Robs workers and governments Public service sector workers earn less than private sector employees (after adjustment for age, education, and years of experience)
")
298
Undocumented Immigrants
Undocumented immigrants pay taxes: State and local income, property, and excise taxes; employer’s share of SS, Medicare, and unemployment taxes BUT, they are not eligible for many public services: Medicaid, SNAP, SS, Medicare, unemployment benefits, temporary cash assistance

299
Undocumented Immigrants
See Public Health and Social Justice website page on migrant and seasonal farm workers at

300
Congressional Wealth In 4 of the last 5 years, Congress granted itself a $5,000 cost of living salary increase ½ of legislators are millionaires (vs. 1% of U.S. citizens) Average personal fortune: Senator = $13 million Representative = $5 million
 Average personal fortune: Senator = $13 million. Representative = $5 million.")
301
Exorbitant CEO Pay CEO salaries up 759% since 1978
Average worker pay up 6% Dodd-Frank Executive Pay provision requires corporations to report SEC figuring out how to implement Much compensation outside of salary (stock, stock options, other perks) Shareholders only allowed “advisory” say on pay voting rights
 Shareholders only allowed advisory say on pay voting rights.")
302
Exorbitant CEO Pay The average CEO makes X the salary of the average U.S. worker ( X) Mexico 45:1 Britain 25:1 Japan 10:1 US Military: 15-20:1 (top rank : lowest rank)
")
303
CEO Personality Characterisitics
Some data suggest certain traits common among psychopaths are also commonly found in CEOs (and politicians, world leaders, and serial killers): Grandiose sense of self worth Persuasiveness Superficial charm Ruthlessness Lack of remorse Manipulation of others
: Grandiose sense of self worth. Persuasiveness. Superficial charm. Ruthlessness. Lack of remorse. Manipulation of others.")
305
The Mega-Rich Worried / Investing in personal security Bodyguards
Armored cars Bullet-proof windows; machine gun proof doors Home security fogs Panic rooms Fully-stocked home medical suites Yachts with escape submarines Islands

306
U.S. Debt US national debt $14.8 trillion in 2011
Over $46,250 for every US citizen Personal savings down Annual bankruptcies up approximately 50% between 2007 and 2010

307
CEO Personality Characterisitics
Some data suggest certain traits common among psychopaths are also commonly found in CEOs (and politicians, world leaders, and serial killers): Grandiose sense of self worth Persuasiveness Superficial charm Ruthlessness Lack of remorse Manipulation of others
: Grandiose sense of self worth. Persuasiveness. Superficial charm. Ruthlessness. Lack of remorse. Manipulation of others.")
308
U.S. Debt Average household debt (for mortgages, car loans, credit cards and all other debt combined) = $114,434 (2010) Debt exacerbated by Predatory lending practices, sub-prime mortgage collapse Payday loans (22,000 stores, serving 10 million people/yr, $40 billion/yr business) Rent-to-own companies
 Rent-to-own companies.")
309
Total Credit Card Debt Up
$243 billion $560 billion $1.5 trillion $800 billion $951 billion Average number of credit cards per U.S. adult = 3.5

310
Bankruptcies 1.6 million bankruptcies between 6/09 and 6/10
Over 60% of bankruptcies due to health care expenses (and ¾ of these individuals were insured) exceed # of college graduates/year, # of persons diagnosed with cancer per year Bankruptcy “reform” bill grossly unfair
 exceed # of college graduates/year, # of persons diagnosed with cancer per year. Bankruptcy reform bill grossly unfair.")
311
Pensions Pensions in jeopardy
Shift from Defined Benefit Plans to Defined Contribution Plans Reductions in / elimination of employer contributions

312
The “Global Economy” 53 of the world’s 100 largest economies are private corporations; 47 are countries GM was, until recently, larger than Denmark, Thailand, Hong Kong, and Turkey Apple is larger than Poland Wal-Mart is larger than Israel and Greece AT&T is larger than Malaysia and Ireland

313
The “Global Economy” Until 2007, the combined revenues of GM and Ford exceed the combined GDP of all sub-Saharan Africa Combined sales of the top 6 Japanese companies are nearly equivalent to the combined GDP of all of South America

314
Corporations Almost 6 million corporations ¼ non-profits
500 companies control 70% of world trade 148 corporations control 40% of world’s wealth (most are financial institutions)
")
316
Corporations - Milton Friedman
“The [only] social responsibility of business is to increase its profits.” - Milton Friedman

317
Corporations “Corporations [have] no moral conscience. [They] are designed by law, to be concerned only for their stockholders, and not, say, what are sometimes called their stakeholders, like the community or the work force…” -Noam Chomsky

318
Corporations Internalize profits
Externalize health and environmental costs Confidential legal settlements keep important public health and safety information secret May delay governmental intervention, cause unnecessary morbidity and mortality

319
Corporate Taxation Nearly 1/3 of all large corporations (assets > $250 million or annual sales > $50 million) pay no annual income tax
 pay no annual income tax.")
320
Corporate Taxation Corporations shouldered over 30% of the nation’s tax burden in 1950 vs. 6.5% today (“real rate” = 2.8% per U.S. Treasury Department) Corporate taxes are at their lowest level since WW II
 Corporate taxes are at their lowest level since WW II.")
321
Corporate Taxation 2004: Bush administration offered temporary tax holiday on foreign earnings $300 billion in profit repatriated 92% went to dividend payouts, stock buybacks, and corporate coffers Only 8% went to R and D, new factories, and hiring

322
Reasons for Inadequate Corporate Taxation
Tax breaks, corporate welfare, corporation-friendly tax laws, loopholes, transferring assets overseas Cities and states offer incentives to companies to locate in their communities, in exchange for the promise of jobs Companies often leave when a better offer becomes available

323
Reasons for Inadequate Corporate Taxation
Incentives: Cash grants and loans Sales tax breaks Income tax credits and exemptions Free services Property tax abatements Highway and school construction $80 billion in 2011 Income tax breaks - $18 billion Sales tax relief - $52 billion

324
Reasons for Inadequate Corporate Taxation
Cheating and under-payment common Auditing program understaffed and underfunded 1/3 high school students admits to stealing something from a store in the past year

325
Reasons for Inadequate Corporate Taxation
Offshore tax havens shelter capital Estimated 1/3 of global assets $11.5 trillion in individual wealth alone 83 of the largest 100 US companies have subsidiaries in tax havens Lost annual tax revenue: $250 billion worldwide $100 billion in US

326
Ugland House, Cayman Islands 18,000 Corporations Registered Here

327
Job Creators?

328
Corporate Crime Each year in America, we lose;
$3.8 billion to burglary and robbery $100-$400 billion to health care fraud; $40 billion to auto repair fraud, $15 billion to securities fraud, etc.; the S and L fraud cost between $300 billion and $500 billion Fines meager, often considered a cost of doing business Corporate crime under-prosecuted, prosecutors under-funded

329
Corporate Crime 25% decrease in federal prosecutions of white collar crime, including corporate crime, since 1999 Increase in non-prosecution and deferred-prosecution agreements 3/5 U.S. companies settling corporate crime cases illegally deduct some or all of the settlement to the IRS

330
Corporate Crime Companies mandating forced arbitration
SCOTUS allows corporate binding arbitration contracts, limiting class action lawsuits (AT&T v. Concepcion, 2011) Arbitration Fairness Act would counteract ruling
 Arbitration Fairness Act would counteract ruling.")
331
Corporate Crime 1,288 whistleblower lawsuits ; government ruled for whistleblower in only 17 US Supreme Court (Garcetti v. Ceballos, 2006) sharply restricted rights of public employee whistleblowers Congress passed Whistleblower Protection Enhancement Act (2011) Obama has pursued more whistleblowers than any U.S. president
 sharply restricted rights of public employee whistleblowers. Congress passed Whistleblower Protection Enhancement Act (2011) Obama has pursued more whistleblowers than any U.S. president.")
332
Unemployment 9-12% unemployment rate
True percentage likely higher (approximately 16%) Only 1/3 of the unemployed are eligible for unemployment insurance Women slightly more likely to be unemployed than men Black women 2X white women Under-employment rate approximately 10%
 Only 1/3 of the unemployed are eligible for unemployment insurance. Women slightly more likely to be unemployed than men. Black women 2X white women. Under-employment rate approximately 10%")
333
The Rise of the Permatemp
Temporary agency workers million million est. 4.0 million Results: job insecurity, fewer benefits, no retirement savings, more uninsured, etc. 30% of U.S. workers have no retirement savings

334
Job Loss and The Decline of Labor
Millions of jobs lost, early (sometimes forced) retirements Free trade Expatriation of jobs : U.S.-based multinational corporations cut 2.9 million jobs in U.S. while increasing foreign employment by 2.4 million 40% of US jobs part-time or seasonal
 retirements. Free trade. Expatriation of jobs : U.S.-based multinational corporations cut 2.9 million jobs in U.S. while increasing foreign employment by 2.4 million. 40% of US jobs part-time or seasonal.")
335
Job Loss and The Decline of Labor
Labor union membership declining since 1950 Now 12%: 7% in private sector 36% in public sector Employers generally anti-union Employee Free Choice Act would make it easier for workers to unionize

336
Labor Unionized workers earn more, have better health benefits, safer working conditions, retirement and disability portfolios Industrialized countries with a greater fraction of workers in unions invest more in social welfare Corporate class turns U.S. laborers against their natural advocates (workers in other countries, undocumented immigrants, etc.)
")
337
Abraham Lincoln “Labor is prior to, and independent of, capital; that, in fact, capital is the fruit of labor, and could never have existed if labor had not first existed. Labor is the superior of capital and deserves much the higher consideration.”

338
Railroad magnate Jay Gould
“I can hire one-half of the working class to kill the other half.”

339
Overseas Labor Markets
Currently made overseas: 83% of all garments sold in the U.S. 90% of sporting goods 93% of shoes

340
Overseas Labor Markets
Overseas factories often lack adequate occupational health and safety / pollution controls (e.g., maquiladoras) Even in U.S., up to 80% of occupational illnesses and injuries missed 2/3 of workers fear disciplinary reaction for disclosing 1/3 of physicians asked to undertreat to avoid triggering an incident report
 Even in U.S., up to 80% of occupational illnesses and injuries missed. 2/3 of workers fear disciplinary reaction for disclosing. 1/3 of physicians asked to undertreat to avoid triggering an incident report.")
341
Value of Workers to Society
Tax accountants destroy $47 for every $1 in value they generate Advertisers destroy $11 for every $1 they generate Bankers destroy $7 for every $1 they generate

342
Value of Workers to Society
Waste recycling workers generate $12 in value for every $1 they are paid Hospital cleaners generate $10 in social value for every $1 they are paid Childcare workers generate $7-$9.50 for every $1 they are paid

343
Worker Health and Safety
ILO: 2.2 million die of work-related injuries and diseases worldwide each year Considered vast underestimate, due to poor reporting in many developing countries Over 5,600 U.S. workers die each year due to job-related injuries Highest numbers: construction, transportation and warehousing, forestry, fishing and hunting OSHA inspections rare, fines minimal

344
Outsourcing 2 million U.S. jobs lost to outsourcing since 1983
Exact numbers difficult to obtain, companies do not have to report Over the last few years, compared to other firms, CEO compensation has increased five times faster at the 50 U.S. firms that do the most outsourcing of jobs

345
Asian Sweatshop

346
Violations of Employment and Labor Laws
26% of low-wage workers paid less than legally-required minimum wage 25% of workers had put in overtime Avg. 11 hrs, 75% not paid overtime rate Off-the-clock, meal break, pay stub, tipped job violations common

347
Violations of Employment and Labor Laws
Illegal deductions, employer retaliation, and workers’ compensation violations Women, foreign-born, non-English-speaking, less educated, and non-unionized face more violations Violations common in home-based work and industry

348
The Global Workforce 27 million enslaved laborers
Slavery occurs in every country in Africa (Unicef) 800,000 persons trafficked across international borders annually Dollar value of commerce in human beings rivals drug trafficking and illegal arms trade
 800,000 persons trafficked across international borders annually. Dollar value of commerce in human beings rivals drug trafficking and illegal arms trade.")
349
The Global Workforce 215 million child laborers
¼ children in sub-Saharan Africa 60% exposed to hazardous conditions; 25% exposed to hazardous chemicals Violations of child labor laws common in U.S.

350
Child Labor

351
Outsourcing the Government
More than ½ of federal jobs now outsourced to private corporations More than ½ of contracts no-bid Threat to democracy Outsourcing of military Mercenaries Demoralizes troops

352
Thomas Jefferson The care of human life and happiness, and not their destruction, is the first and only legitimate object of good government

353
The Third World Debt Crisis
Over 40 of the poorest countries in Africa, Latin America, and Asia owe a total of almost $300 billion in foreign debt countries borrowed when loans cheap and easy to get money lent to corrupt/undemocratic governments during Cold War corruption world prices for main exports declined new loans (at higher interest rates) required to pay interest on debt
 required to pay interest on debt.")
354
The Third World Debt Crisis
Creditors US, UK, Japan, France and Germany interest rates up to 20-22% in 1980’s

355
The Third World Debt Crisis
Each African child inherits approximately $379 in debt at birth debt % of GDP for Tanzania, Zambia, Ethiopia, and others Per capita income in Sub-Saharan Africa has declined in real terms by 6% since 1975 Live Aid (1985 raised $200 million) Equal to the amount all African countries pay back on foreign debts each week (in 2001)
 Equal to the amount all African countries pay back on foreign debts each week (in 2001)")
356
The Third World Debt Crisis
Countries spend more each year repaying debt than on education and healthcare. Debt will never be paid off

357
Effects of the Third World Debt Crisis
Indebted countries drastically cut wages, which slows the economy and decreases purchases of U.S. imports makes U.S. jobs less secure Currency is devalued. imports more expensive; exports cheaper Government price controls eliminated basic goods more expensive

358
Effects of the Third World Debt Crisis
Government spending on food, fuel and farming subsidies reduced Social service (healthcare/education) program spending cut Countries strip and sell their natural resources increased global pollution, etc.
 program spending cut. Countries strip and sell their natural resources. increased global pollution, etc.")
359
Debt and Microfinance Muhammad Yunus (2006 Nobel Peace Prize) – Grameen Bank Microfinance promises growth of individual and small business Reality – interests and default rates often high, corruption common Perpetuates unfair economic system

360
Solution to the Third World Debt Crisis
Debt forgiveness

361
Foreign Aid In total dollars: U.S. #1
As a % of GDP, U.S. ranks 21st among the world’s wealthiest nations More money flows out of developing countries in the form of interest payments, profits of foreign corporations, and clandestine investments in financial markets of rich countries than flows into them as loans, aid, and foreign direct investment

363
Foreign Aid U.S. Aid: Over 1/3 military, 1/4 economic, 1/3 for food and development Most U.S. aid benefits U.S. corporations, is spent on military, goes to Egypt, Israel, Turkey, Pakistan, and the Philippines

364
Foreign Aid Aid agencies often forced to buy from U.S. companies at inflated prices 70% of aid effectively returned to U.S. Food aid inefficient, benefits large agribusiness at expense of local farmers/economies Takes $2 taxpayer money to generate $1 in food aid

365
Foreign Aid 0.9% of the total federal budget, 1.6% of the U.S. discretionary budget Yet 64% of Americans believed in a 1997 poll that foreign aid was the largest federal expenditure On average, Americans think that 24% of the federal budget goes toward foreign aid

366
Approximately $250 billion/year
U.S. Charitable Giving Approximately $250 billion/year 2.5% of income 2.9% at height of Great Depression

367
U.S. Charitable Giving by Income Bracket
$15K and under: 26% $15K - $30K: 9% $30K - $50K: 5.3% $50K - $100K: 3.8% $100K - $200K: 3.0% $200K and over: 3.4% Empathy Gap: wealthier people ruder with strangers, less charitably generous than poor people

368
American Charitable Giving
Religious Groups: 35% Education: 13% Multipurpose Foundations: 10% Social Services: 8% Health: 8% Arts and Culture: 6%

369
American Charitable Giving
Science: 5% Environment and Animals: 3% International Aid: 2% Other: 9% - Includes individual, corporate, foundation, and bequest donations Less than 10% goes to groups which directly help the poor

370
The Gates Foundation Endowment of approximately $37 billion, with another $31 billion pledged by Buffett Foundation Donates 5% of its worth/yr, invests 95% (typical for charities) Drives international public health agenda As do other corporate donors (“philanthrocapitalists”) Most grants go to organizations in high-income countries
 Drives international public health agenda. As do other corporate donors ( philanthrocapitalists ) Most grants go to organizations in high-income countries.")
371
The Gates Foundation Lack of external oversight, accountability
At least 41% of its assets invested in companies that counter the foundations charitable goals or socially concerned philosophy E.g., Oil and chemical companies, agrobusiness, pharmaceutical industry, soda Similar problems for Warren Buffet’s Berkshire wealth Lancet 2009;373:

373
Federal Fund Outlay Sources (2009)
Individual income taxes: 35% maximum Was 91% in 1960, 70% in 1980, 50% in 1986, 39.6% in 2000 Poor pay a higher percent of their income in state and local taxes Corporate taxes: 5% 3.5% estate and gift taxes, customs, misc. 0.5% excise fees 57% borrowing (increasing national debt)
")
376
Discretionary Federal Spending (2013)
")
377
The Military and Pollution
World’s single largest polluter 6-10% of global air pollution 2-11% of world raw material use

378
The Military and Pollution
97% of all high level and 78% of all low level nuclear waste 104 commercial U.S. nuclear reactors (495 worldwide) – most aged, many unsafe More than 210 million liters of radioactive and chemical waste stored at Hanford, WA Site plagued by leaks, cost overruns
 – most aged, many unsafe. More than 210 million liters of radioactive and chemical waste stored at Hanford, WA. Site plagued by leaks, cost overruns.")
379
The Military and Pollution
Pentagon generates 750,000 tons hazardous waste/year Numerous toxic waste sites Exempt from most environmental regulations

380
The Military and Pollution
“The more birds that the [Department of Defense] kill[s], the more enjoyment [people] will get from seeing the ones that remain: ‘Bird watchers get more enjoyment spotting a rare bird than they do spotting a common one.’” From a 2002 court summary of the U.S. Defense Department’s argument for exemption from the Migratory Bird Treaty Act of 1918

381
World Military Spending (2012)
")
382
War and Peace World military budget = 1.7 trillion (2011)
230X what the UN spends on peacekeeping US: Largest military budget; largest arms supplier Greatest debtor to peacekeeping fund

383
Economic Cost of War, U.S.

384
The Military: Diversion of Resources Away from Health Care
3 hours world arms spending = annual WHO budget 1/2 day of world arms spending = full childhood immunizations for all world’s children 3 days of U.S. military spending = amt. spent on health, education, and welfare for U.S. children in 1 year

385
The Military: Diversion of Resources Away from Health Care and Other Scientific Projects
3 weeks of world arms spending/yr. = primary health care for all in poor countries, incl. safe water and full immunizations 25% of the world’s 2.5 million research scientists and engineers work entirely on military R and D Anthropologists co-opted under U.S. Army’s Human Terrain Team

386
The Military: Diversion of Resources Away from Health Care and Other Scientific Projects
Iraq/Afghanistan war creating enormous U.S. debt Federal and state budgets strapped States - $55 billion budget gap (2012)
")
387
War Deaths,

388
Arms Exports

389
Arms Imports

390
Weapons of Mass Destruction
Nuclear Weapons: 1054 U.S. nuclear tests since 1940s, 331 in atmosphere 23,360 nuclear weapons at 11 sites in 14 countries (1/2 active or operationally-deployed) 5200 active U.S. warheads today (½ on hair-trigger alert); similar number in Russia START treaty signed by Obama, Putin Awaiting Senate approval Will limit US and Russia to 1,550 long-range warheads (still overkill)
 5200 active U.S. warheads today (½ on hair-trigger alert); similar number in Russia. START treaty signed by Obama, Putin. Awaiting Senate approval. Will limit US and Russia to 1,550 long-range warheads (still overkill)")
391
Weapons of Mass Destruction
Biological Weapons Chemical Weapons See WMD slide show on “War and Peace” page of phsj website

392
“Every gun that is made, every warship launched, every rocket fired, signifies in the final sense a theft from those who hunger and are not fed, those who are cold and not clothed.” ~ Dwight D. Eisenhower

393
“The problem in defense spending is to figure out how far you should go without destroying from within what you are trying to defend from without.” ~Dwight D. Eisenhower

394
Poverty and Hunger US: 15% of residents and 22% of children live in poverty Rates of poverty in Blacks and Hispanics = almost 3X Whites 2012 federal poverty level = $11,170 gross annual income (individual); $23,050 for family of 4 Hunger rate increasing nationally Poverty associated with worse physical and mental health
; $23,050 for family of 4. Hunger rate increasing nationally. Poverty associated with worse physical and mental health.")
395
Poverty, Health Insurance, and Food Insecurity
15% (47 million people) in poverty (2011) 15.7% (49 million people) lack health insurance (2012) Cost of maintaining COBRA health insurance for a family consumes 84% of worker’s unemployment benefits Food insecurity 15% (2011)
 in poverty (2011) 15.7% (49 million people) lack health insurance (2012) Cost of maintaining COBRA health insurance for a family consumes 84% of worker’s unemployment benefits. Food insecurity 15% (2011)")
402
Poverty At least 1 billion people live in urban slums
1.1 billion people lack access to safe, clean drinking water -1.8 million child deaths/year 2 billion have no electricity 2.6 billion do not have adequate sanitation services Lack of clean water and sanitation cause 4 billion cases of diarrhea and 1.6 million deaths per year

403
Poverty 2.8 billion live on less than $2/day
3 billion have never made a phone call 3.8 billion have no cash or credit with which to make purchases 770 million unable to read 2006: net transfer of capital of $784 billion from poorer countries to rich ones

404
Human Poverty

405
Poverty

406
Poverty, Hunger, and Micronutrients
Cost of providing vitamin A and zinc supplements to malnourished infants and toddlers under age 2 = $60 million/year Benefits (including prevention of blindness and malnutrition) > $1 billion/yr Cost of providing iron and iodized salt = $286 million/year Benefits (including prevention of iron-deficiency anemia, cretinism) = $2.7 billion/yr
 > $1 billion/yr. Cost of providing iron and iodized salt = $286 million/year. Benefits (including prevention of iron-deficiency anemia, cretinism) = $2.7 billion/yr.")
407
Poverty and Priorities
Amount of money needed each year (in addition to current expenditures) to provide water and sanitation for all people in developing nations = $9 billion Amount of money spent annually on cosmetics in the U.S. = $8 billion
 to provide water and sanitation for all people in developing nations = $9 billion. Amount of money spent annually on cosmetics in the U.S. = $8 billion.")
408
Poverty and Priorities
Amount of money needed each year ( in addition to current expenditures) to provide reproductive health care for all women in developing countries = $12 billion Amount of money spent annually on perfumes in Europe and the U.S. = $12 billion
 to provide reproductive health care for all women in developing countries = $12 billion. Amount of money spent annually on perfumes in Europe and the U.S. = $12 billion.")
409
Poverty and Priorities
Americans bought > $57 billion worth of lottery tickets in 2008 (more money than is spent on movies, music, and books combined) In 2006, Americans spent $31 billion on toys and video games Almost as much as the rest of the world combined 80% of U.S. toys made in China American American buys 60 items of clothing per year (2012, vs. 31 in 1985) Consider alternate gifts, charitable donations
 In 2006, Americans spent $31 billion on toys and video games. Almost as much as the rest of the world combined. 80% of U.S. toys made in China. American American buys 60 items of clothing per year (2012, vs. 31 in 1985) Consider alternate gifts, charitable donations.")
410
Toy Exports

411
Toy Imports

412
U.N. Declaration of Human Rights
“Everyone has the right to a standard of living adequate for the health and well-being of himself and of his family, including food, clothing, housing and medical care”

414
Famine 1.5 billion not consuming enough calories to prevent stunted growth/other health risks Hunger kills 18,000 people per day, most under age 5 Hunger-related causes kill as many people in 8 days as the atomic bomb killed at Hiroshima

415
Famine UN FAO: enough food produced daily to provide every living person with over 2700 calories/day Even so, half the world’s food is wasted (UN FAO) Better methods of food preservation needed Diversion of food crops to biofuels significant contributor to rise in food prices, along with food commodities speculation and trading
 Better methods of food preservation needed. Diversion of food crops to biofuels significant contributor to rise in food prices, along with food commodities speculation and trading.")
416
Monetization and Food Aid
US food aid purchased from already-subsidized US agribusiness US shipping lines transport food to aid organizations in developing countries Undermines local farmers and destabilizes local agriculture

417
Monetization and Food Aid
EU has almost entirely phased out monetization UN World Food Programme (the world’s largest distributor of food aid) has rejected monetization and refuses monetized food aid
 has rejected monetization and refuses monetized food aid.")
418
Famine Rich governments and corporations buying up rights to millions of hectares of agricultural land in developing countries in order to secure their own long-term food supplies One week of developed world farm subsidies = annual cost of food aid to solve world hunger Hunger: solution requires political will

419
Feast and Famine For the first time in history, there are now an equal number of people – 1.1 billion – who get too much to eat as those who don’t have enough to eat

420
Famine

421
Famine Affects the Old and Young

422
Medical Care 50% of global health care budget spent in the U.S.
Currently only 10% of funding devoted to diseases affecting 90% of world’s population Per capita expenditure on health care: U.S. = $8,233 Average for low income developing nations = $22-25

423
Medical Care Even so, U.S. has 49 million uninsured, ranks 24th worldwide in overall population health as judged by disability-adjusted life expectancy and ranks 42nd in global life expectancy Lack of universal health care limits workforce mobility 2008 study: 7% say they or a family member has married in order to get health insurance

424
Headline from The Onion
Uninsured Man Hopes His Symptoms Diagnosed This Week On House

425
Infectious Diseases Increased morbidity and mortality due to changing distributions of disease vectors, reservoirs, and agents -overpopulation and population shifts -malnutrition -drought -decreased immunity

426
Infectious Diseases Malaria min zone expands million additional cases/year by 2100 TB Viral encephalitis Schistosomiasis AIDS Influenza Trypanosomiasis

427
Infectious Diseases Onchocerciasis Dengre Leishmanasis Rabies Hookworm
Yellow fever West Nile Virus

428
HIV/AIDS 2008: 33 million infected 2007: 2 million deaths
Sub-Saharan Africa hardest hit Only 20% of HIV+ individuals in low and middle-income countries know they are infected Less than 1/3 of those needing therapy receive any medication

429
HIV Prevalence

430
Malaria Deaths

431
Species Loss Earth contains an estimated 5 to 100 million species
Best estimate 8.7 million +/- 1.3 million 6.5 million on land 2.2 million in water

432
Species Loss Only 1.8 million have been identified
50 new species identified each day Rate of extinction = 4,000-6,000 species/year, highest estimates = 4 species/hour - 1, ,000X background rate of extinction

433
Species Loss 50,000 vertebrates - 7,100 of 10,000 bird species threatened with extinction - 1/4 of 4,400 mammalian species - 70% decline in wild chimpanzees over last 30 years - 1/2 of 232 primate species (including man?) bush meat trade contributing - 1/3 of 24,000 fish species % of 10,300 reptile and amphibian species (may be higher, limited assessment) Almost ¾ of flowering plants at risk of extinction
 bush meat trade contributing. - 1/3 of 24,000 fish species % of 10,300 reptile and amphibian species (may be higher, limited assessment) Almost ¾ of flowering plants at risk of extinction.")
434
Alpha Predators Precipitous decline of alpha predators (apex consumers) will have enormous repercussions for ecosystems/other species 90% already extinct

438
Species Loss 6000-8000 Orangutans left in Borneo 3200 tigers worldwide
More in American backyards than in the wild 2800 Manatees in Florida 720 wild gorillas 30-50 Florida Panthers 1 Pacific Manzanita Plant

439
Species Loss More than 1600 animals on ES list today – many more at risk 73% of plants and animals that have gone extinct since 1973 were not listed Yangtze River dolphins extinct as of 2007 Polar bears, Adelie penguins at risk of extinction due to global warming Bees and bats imperiled

442
Causes of Species Loss Habitat loss (logging, overpopulation, etc.) - #1 cause now Global warming – est. #2 cause by 2050 Overhunting Chemical pollution of environment

443
Causes of Species Loss Exotic species invasions (e.g. rabbits/Australia; role of ballast water, link of shipping with GDP): Cost = $1.4 trillion/yr (5% of global economy); $130 billion/yr in US Rise of fungi and funguslike pathogens (oomycetes) Account for 65% of pathogen-driven species loss
; $130 billion/yr in US. Rise of fungi and funguslike pathogens (oomycetes) Account for 65% of pathogen-driven species loss.")
444
Causes of Species Loss HUMANS

445
Extinction: Lost Pharmacopoeia
Drugs from plants and native peoples’ health knowledge -More than 1/2 of the top 150 prescription drugs contain an active compound derived from or patterned after natural products -e.g. aspirin, acyclovir, lovastatin, digoxin, vincristine, etoposide, captopril, cyclosporine, sirolimus, vancomycin, paralytic agents, warfarin, etc. Of the more than 250,000 known flowering species, <0.5% have been surveyed for medicinal value

446
A Cure for Cancer?

447
The Black Market in Endangered Animals
>$20 billion market -equal to smuggled arms market -less than contraband drug market ($30 Billion) Environmental crimes poorly policed, punishments weak Convention on International Trade in Endangered Species (CITES) Still allows more than 100 million individuals of rare species to be bought and sold each year
 Environmental crimes poorly policed, punishments weak. Convention on International Trade in Endangered Species (CITES) Still allows more than 100 million individuals of rare species to be bought and sold each year.")
451
Invasive Species Rabbits and cane toads in Australia
Brown tree snakes in Guam Pacific rats in Polynesia Kudzu in the U.S. Asian carp (threatening U.S. Great Lakes) Jellyfish (“cockroaches of the sea”)
 Jellyfish ( cockroaches of the sea )")
452
Worrisome Trends Environmental Audit Laws
Increased federal pre-emption of state laws WTO/World Bank/IMF Policies MAI

453
Worrisome Trends GATT, NAFTA, CAFTA, other trade agreements
Food Disparagement Laws SLAPP Lawsuits

454
Worrisome Trends Corruption of judiciary by campaign contributions
86% of US judges are elected Many federal judgeships remain vacant, as Senate refuses to confirm nominees

455
Bush Administration Key administrators/committee members/regulators former industry representatives and/or lobbyists Corporate profit before public good Unsound/distorted/suppressed science “Climategate”

456
Bush Administration Eco-harassment Criminalizing activists
Rollbacks of key environmental laws Lax enforcement of existing laws OMB estimates annual benefits of major federal regulations between 1996 and 2006 = $99 billion - $484 billion, annual costs = $40 billion - $46 billion

457
Bush Administration American exceptionalism:
“The American lifestyle is non-negotiable” Huge tax cuts primarily benefit wealthy

459
Obama Administration Large industry influence Very slow progress
Change?

460
Obama Administration Overturns global gag rule
Some improvements in FDA, EPA Withdrawal (partial) from Iraq Failure to consider single payer health care Supports genetically-modified crops Appointees holdovers (philosophically and personally) from prior administrations ?The future?
 from Iraq. Failure to consider single payer health care. Supports genetically-modified crops. Appointees holdovers (philosophically and personally) from prior administrations. The future")
461
Status of Women in the Third World
Poverty Impaired access to employment and education Lack of reproductive health services, early childbearing, large families

462
Status of Women in the Third World
Political marginalization Discriminatory and “cultural practices” -forced prostitution, female genital mutilation, etc. Trafficking, sex slavery

463
Status of Women Economic discrimination Poverty
women do 67% of the world’s work receive 10% of global income own 1% of all property Poverty Women make up 45% of the global employed workforce, yet are 70% of the world’s poor

464
Status of Women Women in the U.S. working full-time make $ $0.81/$1.00 males Those in unions have higher salaries, better benefits Part-time salary balanced $1.04/$1.00 60% of differential due to women’s choosing lower-paying and more portable careers in order to support a spouse or allow for more time to care for children or elders

465
Gender Pay Gap (US)
")
467
Education Worldwide More education = longer life (for mother and her child) Less education = worse health Infant mortality rates vary by mother’s education Parents’ education is linked with children’s health

468
Education Worldwide Education increases health knowledge and healthy behaviors Greater educational attainment leads to better employment opportunities and higher income, which are linked with better health

469
Public Education in Disarray
U.S. public schools ranked lowest among developing nations Inadequate funding, decaying infrastructure National HS graduation rate 65-70% No change from 1970s Lower incomes youths 6X as likely to drop out College tuition costs rising Increasingly marginalizes poor, minorities

470
Would You Sign a Petition to Ban Dihydrogen Monoxide?
1. It can cause excessive sweating and vomiting 2. It is a major component in acid rain 3. It can cause severe burns in its gaseous state 4. It can kill you if accidentally inhaled 5. It contributes to erosion 6. It decreases effectiveness of automobile brakes 7. It has been found in tumors of terminal cancer patients

471
Geographic Ignorance Percent of US teens unable to locate the following on a map: United States – 11% Pacific Ocean – 29% Japan – 58% United Kingdom – 68%

472
Pseudoscientific Beliefs
Percentage of Americans who believe “at least to some degree” in these “phenomena” Astrology 37% % UFOs 30% % Reincarnation 25% % Fortune-Telling 14% 4%

473
Ignorance/Pseudoscientific Beliefs
Half of US citizens do not believe in evolution and do believe that humans and dinosaurs coexisted (2007) 40% think scientists still generally disagree about evolution Only 12% of U.S. Protestant pastors believe in evolution 70% believe in global warming
 40% think scientists still generally disagree about evolution. Only 12% of U.S. Protestant pastors believe in evolution. 70% believe in global warming.")
474
Pseudoscientific Beliefs
37% believe places can be haunted (2007) 25% believe in UFOs (2007) 24% believe in astrology (2009) 16% believe that people with the “evil eye” can cast curses or harmful spells
 25% believe in UFOs (2007) 24% believe in astrology (2009) 16% believe that people with the evil eye can cast curses or harmful spells.")
475
Ignorance/Pseudoscientific Beliefs
22% of Americans don’t know whether an atomic bomb has ever been dropped (2000) 20% of Americans don’t know the earth revolves around the sun (1999) 18% believe in Bigfoot and the Loch Ness Monster (2007) 8% of men / 18% of women believe in astrology and fortune tellers (2007) 14% have consulted a psychic or fortune teller (2009)
 20% of Americans don’t know the earth revolves around the sun (1999) 18% believe in Bigfoot and the Loch Ness Monster (2007) 8% of men / 18% of women believe in astrology and fortune tellers (2007) 14% have consulted a psychic or fortune teller (2009)")
476
Ignorance/Pseudoscientific Beliefs
Despite politicians’ statements, 72% of Republicans believe global warming is occurring (92% of Democrats) Some states require instructors to teach “creation science,” “intelligent design,” and “climate change skepticism”
 Some states require instructors to teach creation science, intelligent design, and climate change skepticism")
478
Greenwash Public relations / ad campaigns -Chevron’s “People Do” Campaign, butterflies/refinery -BP invests $100 million annually in clean energy = amt. it spends annually to market its new name and environmentally-friendly image of moving “Beyond Petroleum” -Dupont Freon Campaign in 1970’s -Grants to a few scientists who challenge environmental warnings -tobacco ads in 1950’s Bluewash: association with UN principles/logo

479
Astroturf Artificially-created grassroots coalitions
Utilize specially tailored mailing lists, field officers, telephone banks, fax machines, intense lobbying May be one or two individuals, or run by a PR firm, or have “volunteer” employee members

480
Corporate Front Groups
The American Council on Science and Health The Alliance for Responsible CFC Policy The Oregon Lands Coalition National Wilderness Institute The Environmental Conservation Organization The Foundation for Clean Air Progress Similar semantics for new laws/congressional bills

481
Corporate PR Tactics Advertising
Astroturf - artificially-created grassroots coalitions Corporate front groups Invoke poor people as beneficiaries

482
Corporate PR tactics Characterize opposition as “technophobic,” anti-science,” and “against progress” Portray their products as environmentally beneficial despite evidence to the contrary Corporate espionage: spying, bribes Bribery of foreign officials illegal under Foreign Corrupt Practices Act

483
Chief Seattle “The earth is our mother. Whatever befalls the earth befalls the sons of the earth. The earth does not belong to man, man belongs to the earth. All things are connected like the blood that unites us all. Man did not weave the web of life, he is merely a strand in it. Whatever he does to the web, he does to himself.”

484
Sponsored Environmental Educational Materials
Corporate-sponsored and supported by a loose coalition of antiregulatory zealots, corporate polluters, lapdog scientists and misguided parents

485
Sponsored Environmental Education Materials (Examples)
Exxon’s “Energy Cube” -“Gasoline is simply solar power hidden in decayed matter” -“Offshore drilling creates reefs for fish” Pacific Lumber Company -“The Great American Forest is. . . renewable forever”

486
Sponsored Environmental Education Materials (Examples)
International Paper -“Clearcutting promotes growth of trees that require full sunlight and allows efficient site preparation for the next crop” American Coal Foundation 4th grade lesson packet (published by Scholastic) entitled “The United States of Energy) Omits mention of toxic waste, mountaintop removal, and greenhouse gasses
 entitled The United States of Energy) Omits mention of toxic waste, mountaintop removal, and greenhouse gasses.")
487
Sponsored Environmental Education Materials (Examples)
American Nuclear Society’s “Activities with the Atoms Family” Dow’s “Chemipalooza” Council for Biotechnology Information’s “Look Closer at Biotechnology”

488
Textbook Publishers Facilitate Corporate Messaging
Scholastic, Inc. World’s largest publisher of children’s educational materials Found in 90% of U.S. classrooms Has taken money from Big Coal, Disney, Microsoft, Nestlé, and Shell to produce books and lesson plans 2011: Announces plan to terminate some industry contracts, set up quasi-independent review board to review corporate materials

489
Advertising US now spends $290 billion/yr on advertising
Almost $1,000/person/yr in the U.S. 10% of a two-year olds nouns are brand names The average American can recognize over 1,000 corporate logos, but fewer than 10 plants and animals native to his/her locality

490
Advertising/PR "Those who manipulate the unseen mechanism of society constitute an invisible government which is the true ruling power of our country. We are governed, our minds molded, our tastes formed, our ideas suggested largely by men we have never heard of. →

491
Advertising/PR In almost every act of our lives, whether in the sphere of politics or business, in our social conduct or our ethical thinking, we are dominated by the relatively small number of persons who understand the mental processes and social patterns of the masses. It is they who pull the wires that control the public mind.“ -Edward Bernays, Pioneer of Corporate PR and Propaganda

492
Worrisome Trends Television
Average American watches over 4 hours of TV daily Average American child aged 8-18 spends 7.6 hrs/day using an electronic device or watching TV TV sets now outnumber homes in America

493
Channel One (Primedia, for-profit)
12 minutes per day: Includes 2 minutes of ads (mostly for junk foods, video games) Viewed by 8 million students in 12, 000 classrooms Disproportionately shown in low income and minority communities Costs taxpayers $1.8 billion per year Opposed by major education groups
 Viewed by 8 million students in 12, 000 classrooms. Disproportionately shown in low income and minority communities. Costs taxpayers $1.8 billion per year. Opposed by major education groups.")
494
Worrisome Trends Public Education in disarray
1/3 of America’s 80,000 schools need extensive repair or replacement 1/3 or more have mold, dust, indoor air problems (contribute to asthma, absenteeism Higher Education increasingly expensive

495
Nation’s Schoolchildren Call For Cuts in Math/Science Funding

496
Education in America 16% of adults have not completed high school
30% have no schooling beyond high school 27% have attended but not completed college 28% are college graduates Rates vary dramatically across racial and ethnic groups

498
Educational Apartheid
High levels of de facto school segregation by race and SES Gross discrepancies in per-pupil spending and teacher salaries Achievement and graduation gaps growing

499
Benefits of Education For every $1 spent on early childhood education, up to $17 are saved from increased school achievement, improved health, reduced crime, and reduced reliance on public assistance Income increases 11% for every year of education

500
Benefits of Education College graduates live 5 years longer than high school dropouts Eliminating educational inequities would have saved 8X as many lives as medical advances from

501
Academics at Risk Increasing corporatization of academia
Private commercial funding of university research: $264 million in 1980 $2 billion in 2001 Secrecy/Pseudoscience AAPG Notable Achievement in Journalism prize to Michael Crichton for State of Fear (which denies global warming)
")
502
Academics at Risk Including government scientists
Subversion of science by Bush Administration Obama administration slow to roll out ethical standards Discourages young scientists

503
Academics at Risk Contingent (adjunct) faculty up from 43% (1979) to 73% today Paid ¼ amount of regular faculty No benefits No job security, opportunities for career advancement Dramatic rise in number of administrators Many very well paid

504
Academics at Risk University faculty members spend about 40% of their research time writing grant applications and fulfilling grant paperwork requirements Funding agencies favor worthy but incremental research over risky but potentially transformative work Solutions: Increase research budgets Longer funding cycles Fund people, rather than projects

505
Academics at Risk College tuition up (440% from ), administrators’ salaries skyrocketing Average debt for graduating college students = $25,250 Total US student debt exceeds $1 trillion

506
Academics at Risk Job market poor for graduating college students
50% of college students do internships, up from 17% in 1992 1/3 – ½ of internships are unpaid

507
Academics/Professional Organizations Affected
Increasing corporatization of academia ↑Private commercial funding of university research Secrecy/Gag Clauses For-profit colleges growing, marked by corruption, high interest rates on loans to the un- and under-qualified

508
Academics/Professional Organizations Affected
For-profit colleges growing, marked by corruption, high interest rates on loans to the un- and under-qualified Benefit largely from taxpayer money Dramatic decrease in tenured faculty, rise in administrators

509
Academics/Professional Organizations Affected
Gagging of researchers at federal agencies demoralizing, can affect recruitment of quality scientists 2001 – 2011: Number of published papers increased by 44%; number of retracted articles increased 15-fold (3/4 for errors, ¼ for fraud)
")
510
Academics at Risk Teachers underpaid Teachers’ unions under attack
47% of K-12 teachers graduate in bottom 1/3 of college class Forced instruction in creationism, intelligent design, etc.

511
The Medical Brain Drain
U.S. – 280 physicians/100K people (vs. sub-Saharan Africa – 18/100K people) Five times as many migrating doctors flow from developing to developed nations than in the opposite direction Example of “inverse care law”: Those countries that need the most health care resources are getting the least
 Five times as many migrating doctors flow from developing to developed nations than in the opposite direction. Example of inverse care law : Those countries that need the most health care resources are getting the least.")
512
Science in the Developing World
Lack of scientists in developing world (1/50th of developed world per capita) Impaired access to scientific data (publications/textbooks too expensive, hence information outdated
 Impaired access to scientific data (publications/textbooks too expensive, hence information outdated.")
513
The Media Most media organizations owned by multinational, multi-billion dollar corporations that are involved in a number of businesses apart from the media, such as forestry, pulp and paper mills, defense, real estate, oil wells, agriculture, steel production, railways, and water and power utilities

514
Global Warming: Controversial?
Of 928 articles in peer-reviewed scientific journals, 0% were in doubt as to the existence or cause of global warming Of 636 articles in the popular press (NY Times, Washington Post, LA Times, WSJ), 53% expressed doubt as to the existence (and primary cause) of global warming Science 2004;306:1686-7 (Study covers ) IPCC / Al Gore share 2007 Nobel Peace Prize
, 53% expressed doubt as to the existence (and primary cause) of global warming. Science 2004;306: (Study covers ) IPCC / Al Gore share 2007 Nobel Peace Prize.")
516
Legislative Mandates Bills allowing teaching of creationism or “intelligent design” alongside evolution Bills requiring global warming to be taught as a “theory”

517
Anti-Science Legislators
Members of the House Science Committee (2012) Paul Broun (R-GA): Evolution, embryology, and the Big Bang Theory are “lies straight from the pit of hell;” climate change is a “hoax” Ralph Hall (R-TX): Agrees with TX Governor Rick Perry that climate scientists are involved in a conspiracy to receive research funding. Jim Sensenbrenner (R-WI): The science on global warming is “inconclusive”
 Paul Broun (R-GA): Evolution, embryology, and the Big Bang Theory are lies straight from the pit of hell; climate change is a hoax Ralph Hall (R-TX): Agrees with TX Governor Rick Perry that climate scientists are involved in a conspiracy to receive research funding. Jim Sensenbrenner (R-WI): The science on global warming is inconclusive")
518
Anti-Science Legislators
Members of the House Science Committee (2012) Todd Akin (R-MO): “If it’s legitimate rape,” women will not get pregnant (lost 2012 election) Dana Rohrbacher (R-CA): Claimed an earlier period of global warming may have been caused by “dinosaur flatulence,” suggested that if global warming is real it could be addressed by cutting down trees, does not believe that CO2 is a cause of global warming
 Todd Akin (R-MO): If it’s legitimate rape, women will not get pregnant (lost 2012 election) Dana Rohrbacher (R-CA): Claimed an earlier period of global warming may have been caused by dinosaur flatulence, suggested that if global warming is real it could be addressed by cutting down trees, does not believe that CO2 is a cause of global warming.")
519
The Media 5 corporations control majority of US media (down from 50 in 1983) Mass Media Sources, 2002: 92% white 85% male Where party affiliation identifiable, 75% Republican Predominantly conservative/centrist

520
Lobbying 42,000 lobbyists (15,000 full-time)
Estimates of return on lobbying range from $28 to $100 for every $1 spent Revolving door between lobbyists and Congress Between 2001 and 2011, 5,400 former Congressional staffers have left to become lobbyists, and 605 lobbyists have left their positions to work for Congress

521
Drug Company Malfeasance
The pharmaceutical industry is the biggest defrauder of the federal government, as determined by payments made for violations of the federal False Claims Act (FCA) Accounted for 25% of all FCA payouts between 2000 and 2010 Defense industry – 11% Has paid out almost $20 billion in civil and criminal penalties over the last 20 years
 Accounted for 25% of all FCA payouts between 2000 and Defense industry – 11% Has paid out almost $20 billion in civil and criminal penalties over the last 20 years.")
522
Pharmaceutical Industry
$240 million dollars spent on lobbying in 2011 1,228 lobbyists (2.3 for every member of Congress) Revolving door between legislators, lobbyists, executives and government officials
 Revolving door between legislators, lobbyists, executives and government officials.")
523
Lobbying Lobbying groups spent 3.5 billion in 2010 (federal lobbying, a record) Financial sector spent over $1.7 billion on campaign contributions for federal elections from All single issue ideological groups combined (e.g., pro-choice, anti-abortion, feminist and consumer organizations, senior citizens, etc.) = $76.2 million
 = $76.2 million.")
524
Lobbying Agribusiness/oil industry lobbying dwarf environmental lobbying Active lobbying (new laws, not enforce existing laws or fund existing programs) “Lobbying for lethargy” (maintain status quo)
 Lobbying for lethargy (maintain status quo)")
525
Corporate Influence Leads to Large Taxpayer Subsidies to Polluting Industries
Mining - $3.6 billion/yr Nuclear power - $10.5 billion/yr Coal - $8 billion/yr Ranching (grazing on public lands) - $52 million/yr Timber (below cost sales of national forest trees) – approx. $350 million/yr Oil and gas - $550 million/yr
 - $52 million/yr. Timber (below cost sales of national forest trees) – approx. $350 million/yr. Oil and gas - $550 million/yr.")
526
Citizens United v. Federal Election Commission (U. S
Citizens United v. Federal Election Commission (U.S. Supreme Court, 2010) U.S. Supreme Court ruled that corporations can effectively be treated as persons No limits on campaign spending Not persons when it comes to liability for causing harm to the environment or the public’s health 196 donors contributed nearly 80% of money raised by super-PACs in 2011
 U.S. Supreme Court ruled that corporations can effectively be treated as persons. No limits on campaign spending. Not persons when it comes to liability for causing harm to the environment or the public’s health. 196 donors contributed nearly 80% of money raised by super-PACs in")
527
“We have the best Congress money can buy.”
Will Rogers “We have the best Congress money can buy.”

528
Privatization of Public Services
Water Roads Public schools Child support enforcement Military Others Iraqi reconstruction, disaster capitalism

529
The Decline of Democracy
True democracy demands an informed citizenry (education), freedom of the press (media), and involvement (will, time, money) “Information is the currency of democracy” Thomas Jefferson
, freedom of the press (media), and involvement (will, time, money) Information is the currency of democracy Thomas Jefferson.")
530
Colonial Exploitation
Cecil Rhodes (Rhodesia, Rhodes Scholarship, DeBeers Mining Company): “We must find new lands from which we can easily obtain raw materials and at the same time exploit the cheap slave labour that is available from the natives of the colonies. The colonies would also provide a dumping ground for the surplus goods produced in our factories.”
: We must find new lands from which we can easily obtain raw materials and at the same time exploit the cheap slave labour that is available from the natives of the colonies. The colonies would also provide a dumping ground for the surplus goods produced in our factories.")
531
Colonial Exploitation
Winston Churchill (speaking in favor of RAF’s “experimental” bombing of Iraqis in 1920s, which killed 9,000 people with 97 tons of bombs): “I am strongly in favor of using poisoned gas against uncivilized tribes to spread a lively terror…against recalcitrant Arabs as an experiment”
: I am strongly in favor of using poisoned gas against uncivilized tribes to spread a lively terror…against recalcitrant Arabs as an experiment")
532
Colonial Exploitation
Christopher Columbus’ log entry upon meeting the Arawaks of the Bahamas: “They…brought us…many…things…They willingly traded everything they owned…They do not bear arms…They would make fine servants…With fifty men we could subjugate them all and make them do whatever we want.”

533
The US: Rogue Nation History: Native Americans, slavery, current excesses, disparities and injustices Co-opting Nazi and Japanese WWII scientists Minimum 277 troop deployments by the US in its 225+ year history

534
The US: Rogue Nation Since the end of WWII, the US has bombed:
China, Korea, Indonesia, Cuba, Guatemala, Congo, Peru, Vietnam, Laos, Cambodia, Nicaragua, El Salvador, Grenada, Libya, Panama, Afghanistan, Sudan, Yugoslavia, and Iraq

535
The US: Rogue Nation Conservative estimate = 8 million killed
US invasions/bombings often largely at behest of corporate interests European colonial history similar

536
The US: Rogue Nation The US spends vastly more on militarization than on peacemaking The US maintains military bases in 69 “sovereign” nations around the world Continued funding of the Western Hemisphere Institute for Security Cooperation

537
International Non-Cooperation/Isolationism
Failure to sign or approve: Kyoto Protocol on Climate Change International Covenant on Economic, Social, and Cultural Rights Convention on the Prohibition of Anti-Personnel Land Mines

538
International Non-Cooperation/Isolationism
Failure to sign or approve: Treaty to ban cluster bombs Comprehensive Nuclear Test Ban Treaty Convention on the Rights of the Child Convention on the Elimination of Discrimination Against Women

539
International Non-Cooperation/Isolationism
Convention for the Suppression of Traffic in Persons UN Convention on the Rights of Disabled Persons WHO International Code of Marketing of Breast Milk Substitutes UN General Assembly Recognition of Human Right to Water and Sanitation

540
International Non-Cooperation/Isolationism
Failure to sign or approve: Protocol 1, Article 55 of the Geneva Conventions, which bans methods or means of warfare which are intended, or may be expected, to cause widespread, long-term and severe damage to the natural environment

541
International Non-Cooperation/Isolationism
Failure to sign or approve The Stockholm Convention on Persistent Organic Pollutants The Basel Convention on the Control of Transboundary Movements of Hazardous Wastes The Cartagena Protocol on Biosafety (re GM foods)
")
542
The US: Rogue Nation Death Penalty:
US one of only 20 countries to execute civilians (2011) Until recently, the US was the only country to execute both juveniles (ended 2005) and the mentally ill (ended 2002)
 Until recently, the US was the only country to execute both juveniles (ended 2005) and the mentally ill (ended 2002)")
543
The US: Rogue Nation Failure to follow World Court Decisions
Failure to recognize International Criminal Court Largest debtor to the UN (only 40% of dues paid)
")
544
The US: Rogue Nation Patriot Act, government spying, revocation of habeas corpus, presidential signing statements Cited by Human Rights Watch, Amnesty International for Human Rights Violations

545
Positive Trends Majority of U.S. citizens rate the environment as one of the most important issues facing the country, think the government is doing too little to safeguard the environment, and favor environmental protection over economic expansion Power/voice of green groups increasing Involvement of religious groups growing

546
Positive Trends Insurance industry urging reductions in global emissions due to dramatic increase in weather-related claims Analogy with smoking

547
The “Benefits” of Sterility-Causing Chemicals in the Workplace?
12 September 1977 Dr. Eula Bingham, Assistant Secretary for Occupational Safety and Health [Regarding] worker exposure to DBCP. While involuntary sterility caused by a manufactured chemical may be bad, it is not necessarily so. After all, there are many people who are now paying to have themselves sterilized to assure they will no longer be able to become parents... If possible sterility is the main problem, couldn’t workers who were old enough that they no longer wanted to have children accept such positions voluntarily? Or…some [workers] might volunteer for such workposts as an alternative to planned surgery for a vasectomy or tubal ligation, or as a means of getting around religious bans on birth control when they want no more children? Sincerely, Robert K. Phillips, National Peach Council

548
Environmental Success Story The Montreal Protocol (1987)
Phaseout of chlorofluorocarbons (CFCs) by 1996 CFC MDIs phased out in US by 2008 (tetrafluoroethane or HFA = substitute) Major cause of Antarctic and Arctic ozone holes Should disappear by 2060
 by CFC MDIs phased out in US by 2008 (tetrafluoroethane or HFA = substitute) Major cause of Antarctic and Arctic ozone holes. Should disappear by")
549
Environmental Success Story The Montreal Protocol (1987)
Current substitute, HCFCs, much less damaging to ozone layer, also to be phased out in developed world Still produced in large quantities in China Large black market with international smuggling

550
REACH Registration, Evaluation, and Authorization of Chemicals
European Treaty requiring companies to test chemicals already on the market by a set timetable and test new products before putting them on the market

551
REACH Cost of evaluations < 1% of chemical industry’s total sales
Economic analyses show REACH could bring environmental benefits worth €95 billion over the next 25 years and result in health cost savings of €50 billion over the next 30 years Upgrades to treaty to address mixtures of chemicals

552
Convention on Biological Diversity
Calls for: conservation of biological diversity sustainable use Includes Nagoya Protocol on Access to Genetic Resources and the Fair and Equitable Sharing of Benefits Arising from their Utilization - aimed at stopping biopiracy and ensuring that developing countries get their fair and equitable benefits from biodiversity and indigenous knowledge

553
Solutions Based on the Precautionary Principle
“When evidence points toward the potential of an activity to cause significant, widespread or irreparable harm to public health or the environment, options for avoiding that harm should be examined and pursued, even though the harm is not yet fully understood or proven”

554
The Precautionary Principle: Practical Essentials
Give human and environmental health the benefit of doubt Include appropriate public participation in the discussion Gather unbiased, scientific, technological and socioeconomic information Consider less risky alternatives

555
The Precautionary Principle
Endorsed by APHA, ANA, CMA, others Institute of Medicine/National Research Council have endorsed for FDA policies Puerto Rico, San Francisco have adopted, among others Big business, US Chamber of Commerce oppose

556
The Four Laws of Ecology Barry Commoner
1. Everything is Connected to Everything Else. There is one ecosphere for all living organisms and what affects one, affects all. 2. Everything Must Go Somewhere. There is no "waste" in nature and there is no “away” to which things can be thrown.

557
The Four Laws of Ecology Barry Commoner
3. Nature Knows Best. Humankind has fashioned technology to improve upon nature, but such change in a natural system is likely to be detrimental to that system. 4. There Is No Such Thing as a Free Lunch. Everything comes from something. There's no such thing as spontaneous existence.

558
Connectedness Globalization – benefits and drawback Homogenization:
7,000 extant languages 78% speak the 85 largest languages Within one century, nearly ½ expected to disappear Technology/Social Media: dual capacities for good and evil

559
Solutions Shift from a throw-away economy to a reduce/reuse/recycle economy Support local economies Enhance fair trade policies

560
Solutions Rebuild decaying infrastructure:
Federal outlays for basic infrastructure: 1968 = 3.3% of GDP 2011 = 1.3% of GDP Am Soc Civil Engs estimates $2.2 trillion needed, over 5 years, to adequately maintain and upgrade the nation’s roads, dams, drinking water, school buildings, etc.

561
Solutions Recognize nature’s net worth (Natural Capitalism)
Annual value of ecosystem services worldwide = $33 trillion (1997 estimate) $44 trillion (2012); nearly 2X global GNP of $24 trillion Calculate economic prosperity based on Genuine Progress Index or Global Happiness Index, rather than Gross Domestic Product
 $44 trillion (2012); nearly 2X global GNP of $24 trillion. Calculate economic prosperity based on Genuine Progress Index or Global Happiness Index, rather than Gross Domestic Product.")
562
Solutions Consider democratic alternatives to capitalism
Participatory economics (with component of natural economics) – aka Parecon Ground-up system
 – aka Parecon. Ground-up system.")
563
Solutions Decrease energy consumption Zero waste production systems
Extended producer responsibility / Extended product liability 70+ laws in US Cover electronic devices, mercury-containing thermometers, fluorescent lamps, paint, batteries, pharmaceuticals

564
Solutions Production-side environmentalism (reducing “planned obsolescence”) Recycling laws Only 11 states have bottle deposit laws (recycling rates 63% vs. 12% in those without)
")
565
Solutions Pharmaceutical Take-Back Laws Drug companies fighting
Combat the spread of illegal, dangerous black market pharmaceuticals Cause 100,000 deaths/yr worldwide $75 billion business

566
Solutions Restructure tax system Decrease taxes on work and savings
Increase taxes on wealthy Lower taxes on wealthy are not associated with economic growth, are associated with more inequality Maximum income (France, England considering)
")
567
Solutions Restructure tax system
Increase capital gains tax from 15% to (at least) prior 25% rate Resume transaction tax on stock sales/purchases Increase taxes on destructive activities (e.g., carbon emissions, toxic waste generation)
 prior 25% rate. Resume transaction tax on stock sales/purchases. Increase taxes on destructive activities (e.g., carbon emissions, toxic waste generation)")
568
Solutions Greater regulation of financial markets
Eliminate confidential legal settlements relevant to public health and safety Stronger clean air and water standards Revise and update TSCA

569
Solutions Drink tap water
Incredibly cheap and, in the US, almost always safe Exceptions include private well water, from which 15% of Americans get their drinking water Not regulated by Safe Drinking Water Act 40% contaminated to some degree with arsenic, radon, nitrates

570
Solutions Eat less meat
It takes lbs of grain and 2500 gallons of water to produce one lb of hamburger Catch-share agreements to decrease over-fishing Eliminate fossil fuel industry tax breaks and subsidies

571
Solutions Carpooling Keep car longer
> ½ of energy consumption attributable to vehicles occurs during manufacturing

572
Solutions Sweden plans to be world’s first oil-free economy by 2020
EU to cut CO2 emissions 20% by 2020 UK committed to 80% reduction by 2050 California mandates 25% cut in global warming gasses by 2020

573
Solutions EPA to regulate carbon emissions under Clean Air Act (2011)
Climate Security Act: weaknesses include unfair “cap and trade” provisions, carbon capture and storage (CCS) New EPA rules re mercury, coal ash (2011)
 New EPA rules re mercury, coal ash (2011)")
574
Solutions Replace annual crops with perennials Sequesters CO2
Support organic farming converts carbon from a greenhouse gas into a food-producing asset

575
Solutions Solar and wind power; appropriate biofuels (i.e., cellulosic ethanol, algal bio-diesel; not food crops), not CCS (carbon capture and storage) or nuclear CCS raises specter of Lake Chad, Lake Nyos, and Lake Monoun disasters Implies dangers likely to be associated with carbon capture and storage
, not CCS (carbon capture and storage) or nuclear. CCS raises specter of Lake Chad, Lake Nyos, and Lake Monoun disasters. Implies dangers likely to be associated with carbon capture and storage.")
576
Solutions Increase tax breaks, subsidies, research for renewable energy Renewable energy now 3% of transportation fuel market (ethanol) and 9% of the electricity market (wind, solar, biomass)
 and 9% of the electricity market (wind, solar, biomass)")
577
Solutions Streamline EPA -25% of 14 billion superfund payouts have gone to lawyers and consultants Composting / Recycling organic wastes Safe disposal of pharmaceuticals Europe, Canada have take-back systems Shift medical research agenda

578
Solutions Decrease light pollution ($2 billion energy wasted per year) and see the stars! 2/3 of US population and over ½ of EU population can’t see Milky Way -Czechoslovakian anti-light pollution law

579
Solutions Insulation Energy-efficient lighting
Europe bans incandescent lightbulbs (2009) Australia mandates use of compact fluorescent light bulbs by 2012
 Australia mandates use of compact fluorescent light bulbs by")
580
Solutions Decrease excessive packaging
¼ of world lives with ban or fee on plastic bags 15¢/plastic bag tax in Ireland ↓’d use by 90% More than 30 states have enacted or proposed plastic bag restrictions Los Angeles, San Francisco, Portland (OR), Mexico City have outlawed plastic bags Canada, China, Italy, Bangladesh, and a few other countries have banned; others considering ban Charge for paper bags (LA) – markedly decreased use
, Mexico City have outlawed plastic bags. Canada, China, Italy, Bangladesh, and a few other countries have banned; others considering ban. Charge for paper bags (LA) – markedly decreased use.")
581
Solutions Sustainable forest management Plant trees
The average urban tree removes nearly one ton of greenhouse gas during its first 40 years of life Stop receiving catalogues contact Direct Marketing Association

582
Solutions Prevent Congress from weakening NEPA (National Environmental Policy Act) Requires federal officials to conduct environmental impact assessments; allows citizens to challenge the government’s conclusions Oppose Congressional attempts to create “Sunset Commissions” with the power to review federal programs and recommend which programs live, die, or get realigned

583
Solutions Punish environmental scofflaws with large fines and jail time Increase enforcement budgets to combat international environmental crime Establish International Court of the Environment Alien Tort Claims Act designed to hold corporations accountable for human rights abuses overseas

584
Solutions Safe storage of nuclear wastes Green electricity - $3/month
Bioprospecting Ecotourism Rewilding (Contemporary vs. Pleistocene)
")
585
Solutions More equitable distribution of medical research funds and health care dollars Worldwide In U.S. Every $1 invested in community-based programs to increase physical activity, improve nutrition, and prevent tobacco use saves $5.60 in health care costs

586
Address Social Factors Responsible for Illness and Death
Deaths in 2000 attributable to: Low education: 245,000 Racial segregation: 176,000 Low social support: 162,000 Individual-level poverty: 133,000 AJPH 2011;101:

587
Address Social Factors Responsible for Illness and Death
Deaths in 2000 attributable to: Income inequality: 119,000 (population-attributable mortality – 5.1%) Area-level poverty: 39,000 (population-attributable mortality – 1.7%) AJPH 2011;101:
 Area-level poverty: 39,000 (population-attributable mortality – 1.7%) AJPH 2011;101:")
588
Deaths per year Tobacco = 400,000 (+ 50,000 ETS) Obesity = 300,000
Alcohol = 100,000 Microbial agents = 90,000 Toxic agents = 60,000 (likely higher) Firearms = 35,000 Sexual behaviors = 30,000 Motor vehicles = 25,000 Illicit drug use = 20,000
 Firearms = 35,000. Sexual behaviors = 30,000. Motor vehicles = 25,000. Illicit drug use = 20,000.")
589
Address Social Factors Responsible for Illness and Death
Deaths in 2000 attributable to: AMI – 193,000 CVD – 168,000 Lung CA – 156,000 AJPH 2011;101:

590
Major Contributors to Illness and Death
40% of US mortality due to tobacco, poor diet, physical inactivity, and misuse of alcohol Every $1 invested in programs covering above items saves $5.60 in health care costs Up to $1/$50 for tobacco control

591
Maldistribution of Wealth is Deadly
880,000 deaths/yr in U.S. would be averted if the country had an income gap like Western European nations, with their stronger social safety nets

592
Prevention 2-4% of national health care expenditures
Every $1 spent on building biking trails and walking paths would save nearly $3 in medical expenses Every $1 spent on wellness programs, companies would save over $3 in medical costs and almost $3 in absenteeism costs

593
Public Health Spending
Public health spending minimal Mortality rates fall 1-7% for every 10% increase in public health spending

594
Solutions Reverse medical and scientific brain drain
Programs for education and return to home country Eliminate unnecessary health care waste; re-use/send overseas hospital and surgical supplies Open-access publication (see Dr Gavin Yamey’s slide show on the “Activism and Education” page of the phsj website

595
Solutions Federal Research Public Access Act
Would require federal agencies that fund over $100 million in external research/yr to make their study results publicly available on-line Currently before Congress

596
Solutions Strengthen family planning programs
Decrease “demand” for large families education status of women child mortality

597
Solutions: Fair, Representative Elections
Publicly financed campaigns and campaign finance reform Members of Congress spend between 30% and 70% of their time fundraising 50% of Senators and 42% of Representatives become lobbyists after leaving office

598
Solutions: Fair, Representative Elections
Open debates, free air time for candidates Proportional representation Instant runoff voting/cumulative voting/range (rating) voting Halt disenfranchisement, overturn voter restriction laws
 voting. Halt disenfranchisement, overturn voter restriction laws.")
599
Solutions: Living Wage
Over 140 municipalities have adopted living wage laws Including NY, LA, Chicago, and Philadelphia 15 states now have minimum wages that exceed the federal requirement

600
Solutions: Maximum Wage
British-, French-, and New Zealand-proposed income-cap legislation (“maximum wage”) U.S. proposals to create maximum wage of $400,000 (president’s salary) 25X annual pay of the lowest-paid federal worker Patriot Corporations Act would cap pay at 100X pay of lowest paid worker
 U.S. proposals to create maximum wage of $400,000 (president’s salary) 25X annual pay of the lowest-paid federal worker. Patriot Corporations Act would cap pay at 100X pay of lowest paid worker.")
601
Solutions Join and contribute to environmental and social justice groups (Greenpeace, Doctors without Borders) Local grassroots groups especially good Land purchases Litigation (e.g., EJLDF, NRDC)
")
602
Solutions Green investing -returns as good or better than the S & P 500 Terror-free investing Celebrities/Jocks for Justice

603
Solutions Activism / Letter writing / Protesting / Whistleblowing
US Supreme court ruled in 2006 (Garcetti v. Ceballos) that public employees have no free-speech rights re whistleblowing and no constitutional protections against retaliation by bosses Join community groups – become involved in local as well as national issues
 that public employees have no free-speech rights re whistleblowing and no constitutional protections against retaliation by bosses. Join community groups – become involved in local as well as national issues.")
604
The health impact pyramid
Frieden, T. R. Am J Public Health 2010;100: Copyright ©2010 American Public Health Association

605
“Western science and efficiency has made major contributions to minor needs”
- Buddhist Monk, quoted in Wade Davis’ The Wayfarers

606
Solutions: Vote US voter turnout low (139/172 worldwide)
Wealthy vote at almost twice rate of poor Whites > Blacks > Hispanics Old > Young Property owners > Renters

607
Voter Turnout

608
Solutions Fair, representative elections Campaign finance reform
Publicly financed campaigns Better candidates Lower voting age to 16

609
Solutions Increased exposure to nature Improvements in education
Multidisciplinary Literature History Law Photography Community Service

610
The Role of Literature Vicarious experience
Explore diverse philosophies Promotes empathy, critical thinking, flexibility, non-dogmatism, self-knowledge Encourages creative thinking Allows for group discussion/debate cadmium

611
Why Use Literature Encourage appreciation of non-medical literature
Develop reading, analytical, speaking and writing skills Promote ethical thinking (narrative ethics) Identification with authors who are health professionals (e.g., Keats, Chekhov, Maugham, Williams, Sanger, Nightingale, etc.)
 Identification with authors who are health professionals (e.g., Keats, Chekhov, Maugham, Williams, Sanger, Nightingale, etc.)")
612
Homelessness Doris Lessing “An Old Woman and Her Cat”
From the Doris Lessing Reader (New York: Knopf, 1988)
")
613
Race and Access to Care Ernest J Gaines “The Sky is Gray”
in Gray, Marion Secundy, ed. Trials,Tribulations, and Celebrations: African American Perspectives on Health, Illness, Aging and Loss. Yarmouth, Maine: Intercultural Press, 1992

614
Poverty Orwell, George. How the Poor Die. In Sonia Orwell and Ian Angus, eds. The Collected Essays, Journalism and Letter of George Orwell, IV; In Front of Your Nose, New York: Harcourt, Brace and World, Inc: pp Checkhov, Anton. Letter to AF Koni, January 26, 1891, Letter to AS Survivor, March 9, In Norman Cousins, ed. The Physician in Literature Philadelphia: WB Saunders, 1982. Eighner, Lars. Phlebitis: At the Public Hospital. In Travels with Lizbeth. New York: St. Martin’s Press, 1993.

615
“Activist” Journals American Journal of Public Health
Public Citizen’s Health Letter PNHP Newsletter Mother Jones Harpers Z Magazine Hightower Lowdown Synthesis/Regeneration

616
“Activist” Journals Rachel’s Democracy and Health News
Rachel’s Precaution Reporter Sierra The Amicus Journal Bulletin of Atomic Scientists Multinational Monitor Dollars and Sense Some articles in NEJM, JAMA, JGIM, SSM, Policy, Politics, and Nurs Prac, others

617
“The first job of a citizen is to keep your mouth open.”
Günter Grass “The first job of a citizen is to keep your mouth open.”

618
“You must be the change you wish to see in the world.”
Mahatma Gandhi “You must be the change you wish to see in the world.”

619
Alice Walker “The most common way people give up their power is by thinking they don’t have any”

620
“A nation of sheep will beget a government of wolves”
Edward R Murrow “A nation of sheep will beget a government of wolves”

621
Margaret Mead “Never doubt that a small group of thoughtful, committed people can change the world. Indeed, it is the only thing that ever has."

622
African Proverb If you think you are too small to have an impact, try going to bed with a mosquito in your tent

624
Public Health and Social Justice Website
Contact Information and References Public Health and Social Justice Website

Similar presentations


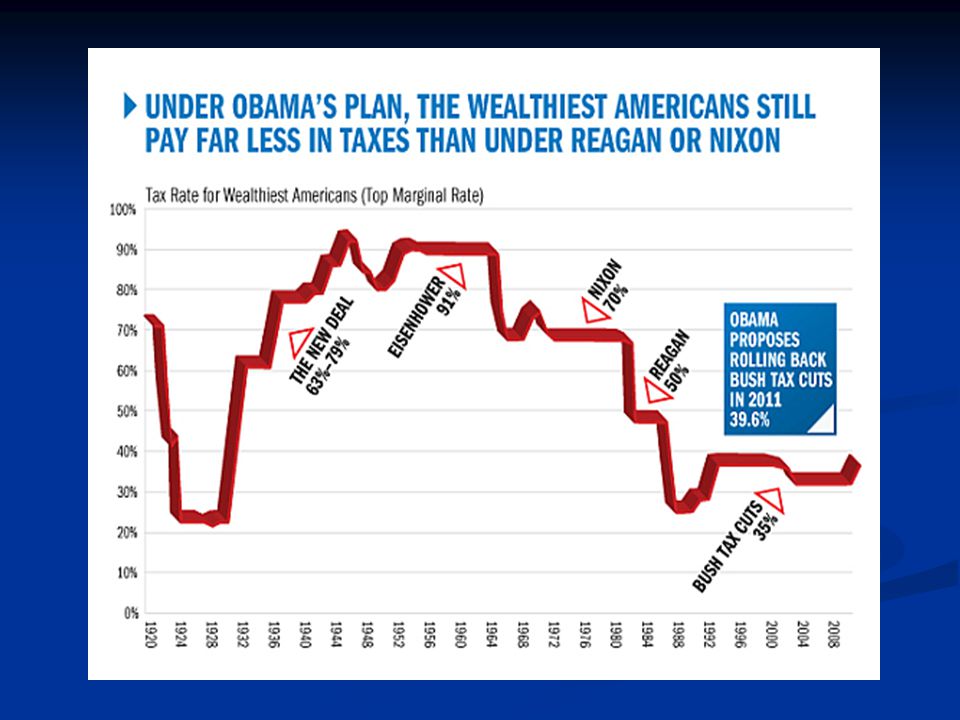
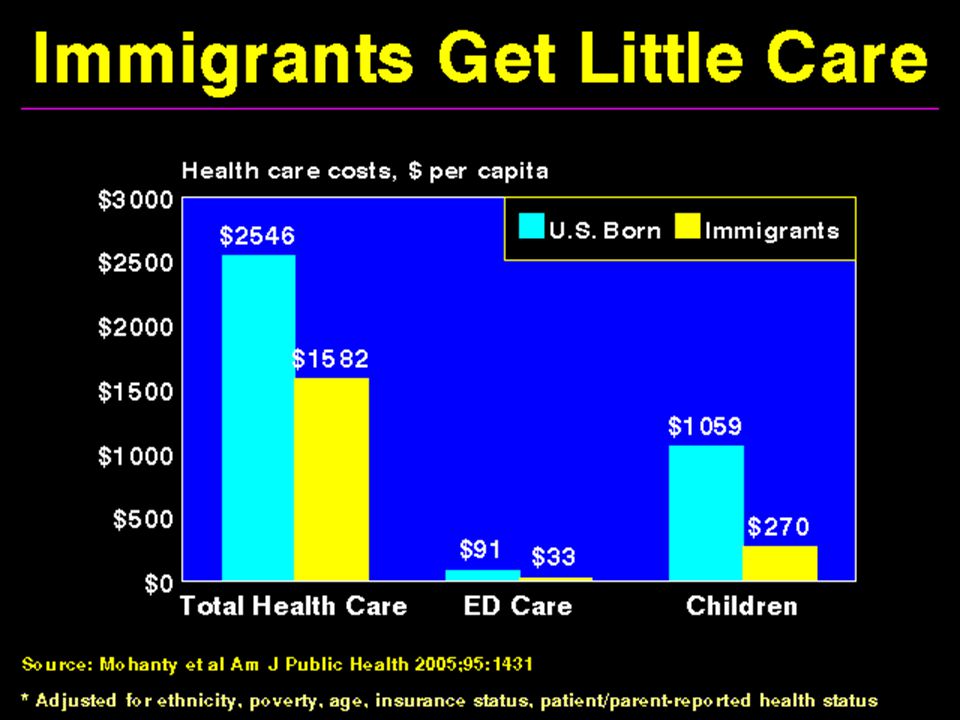

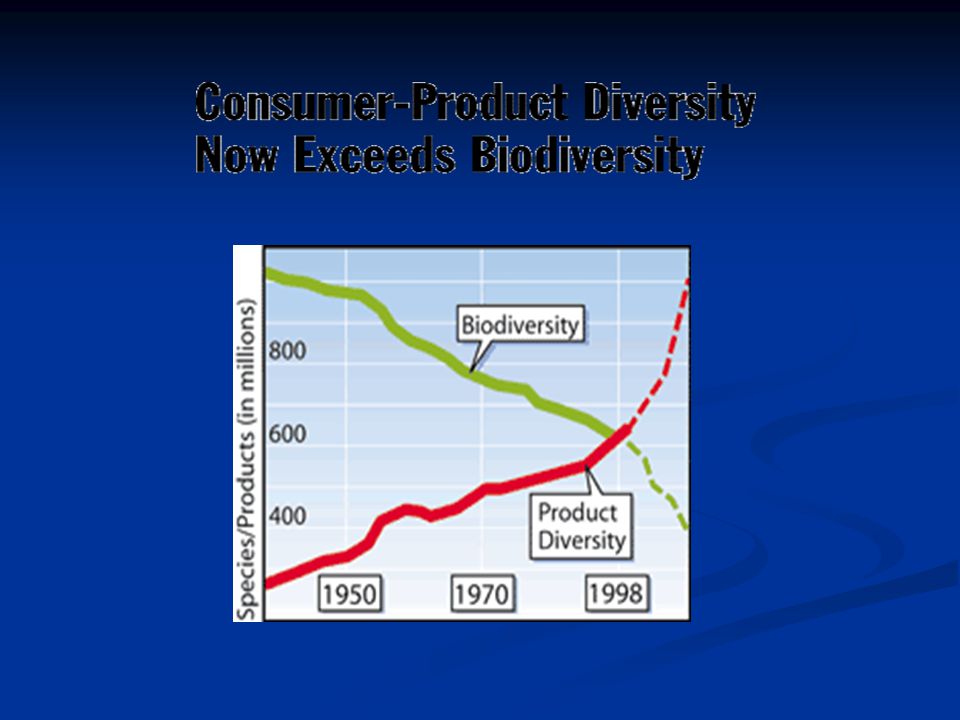


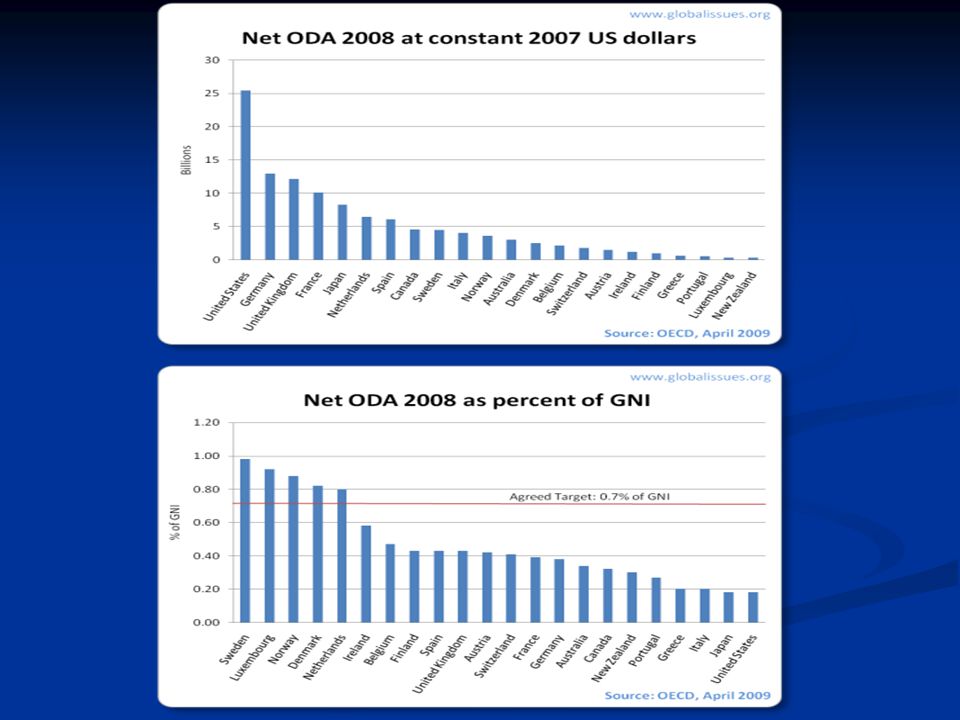

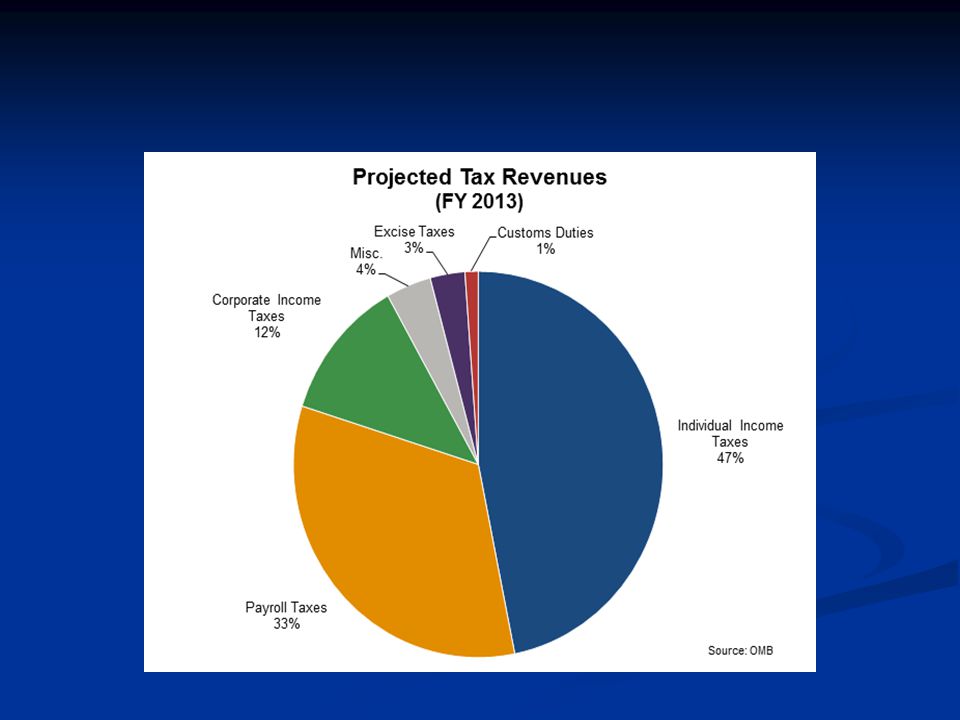
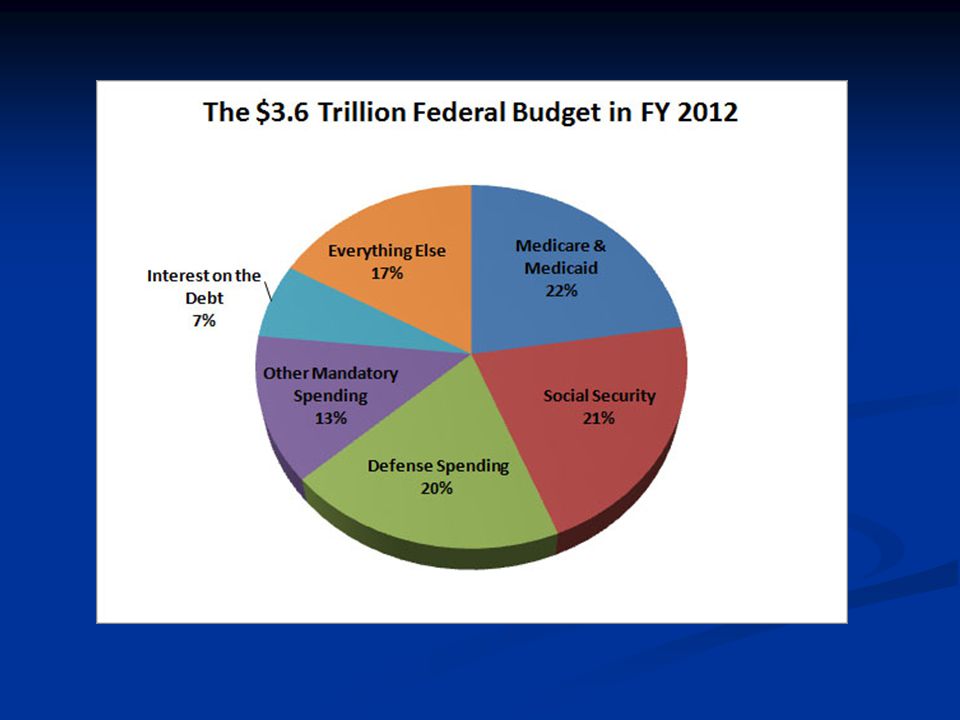


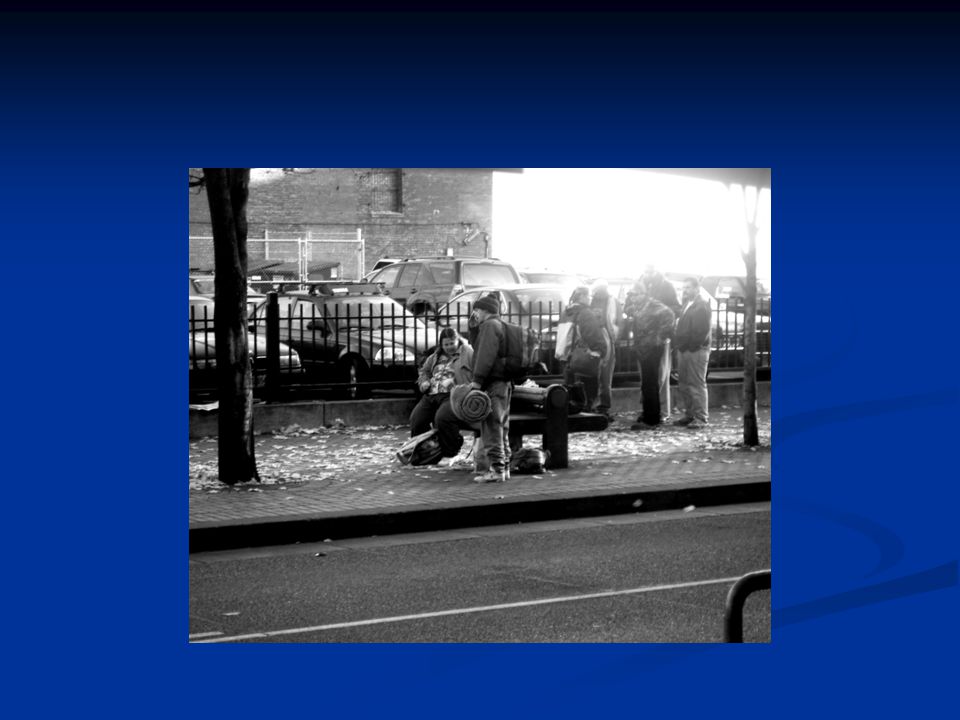


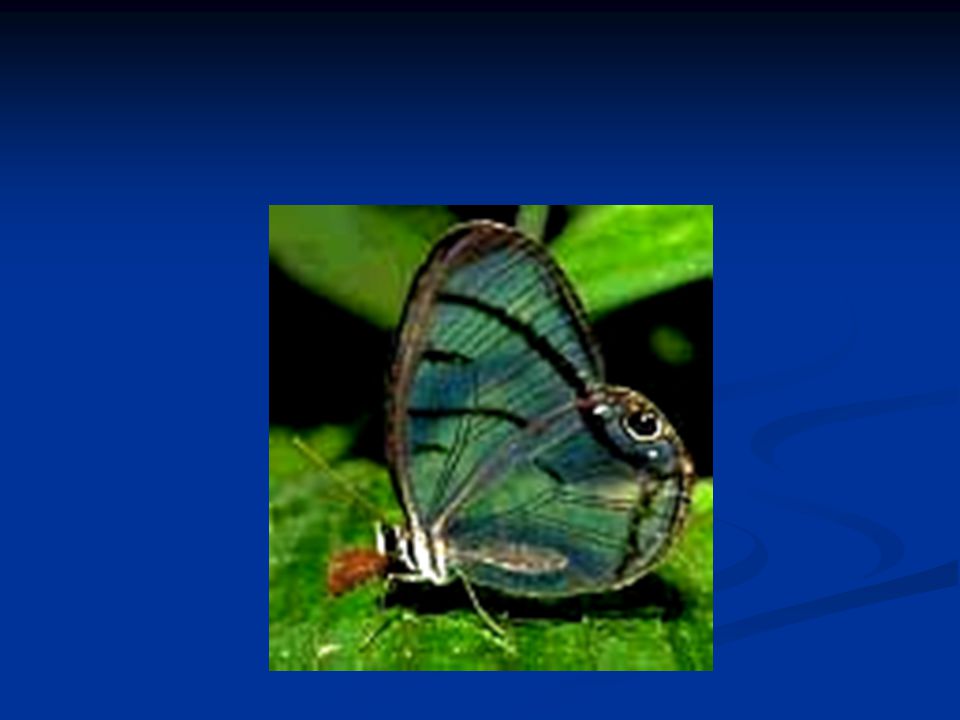


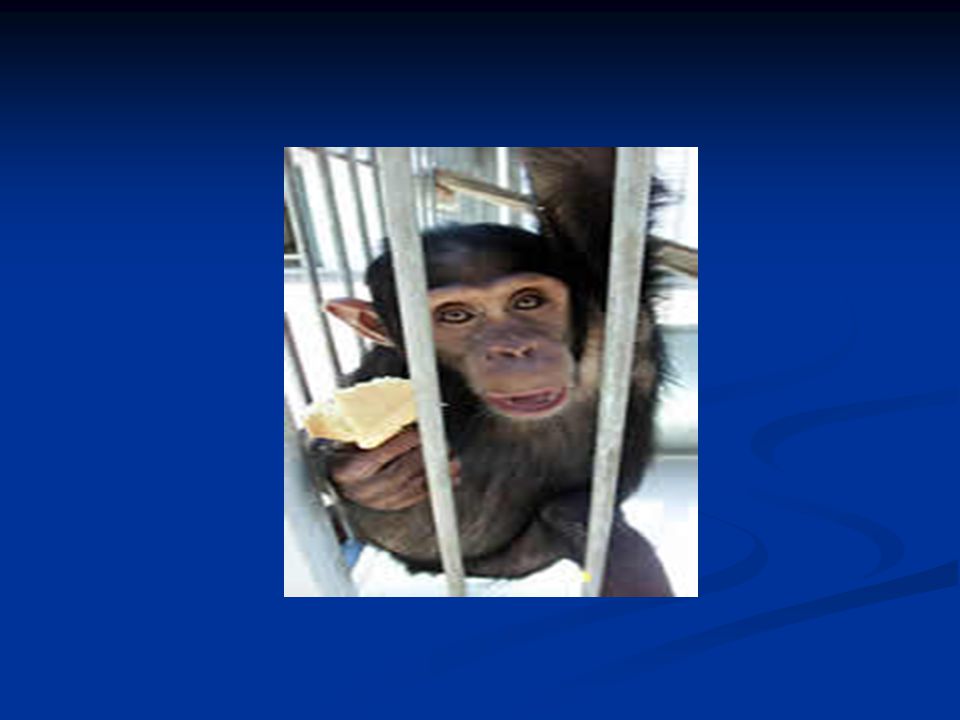


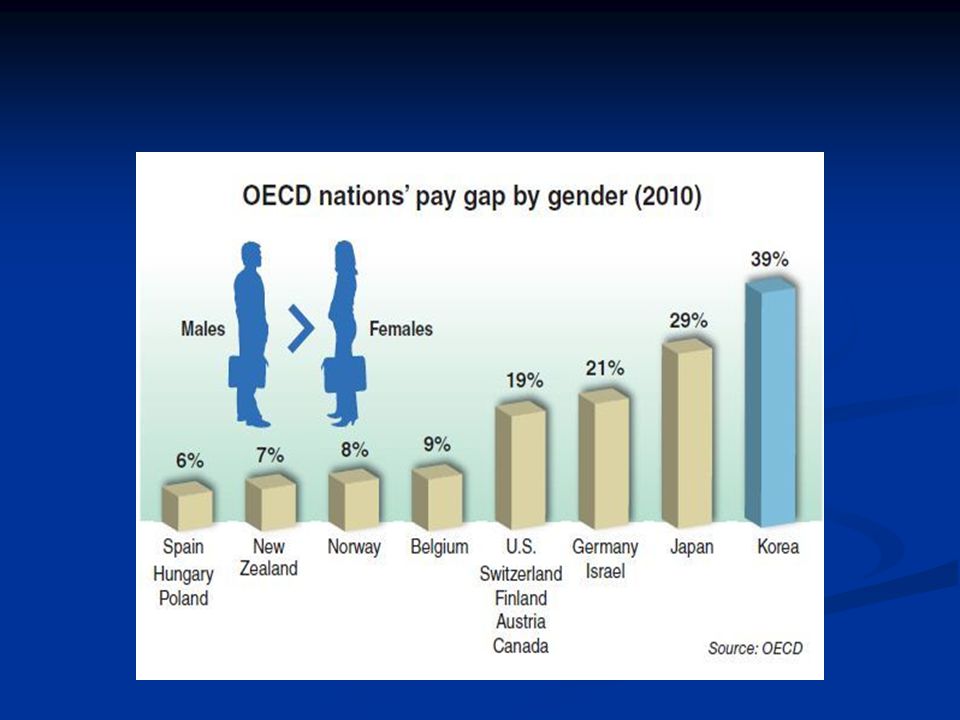

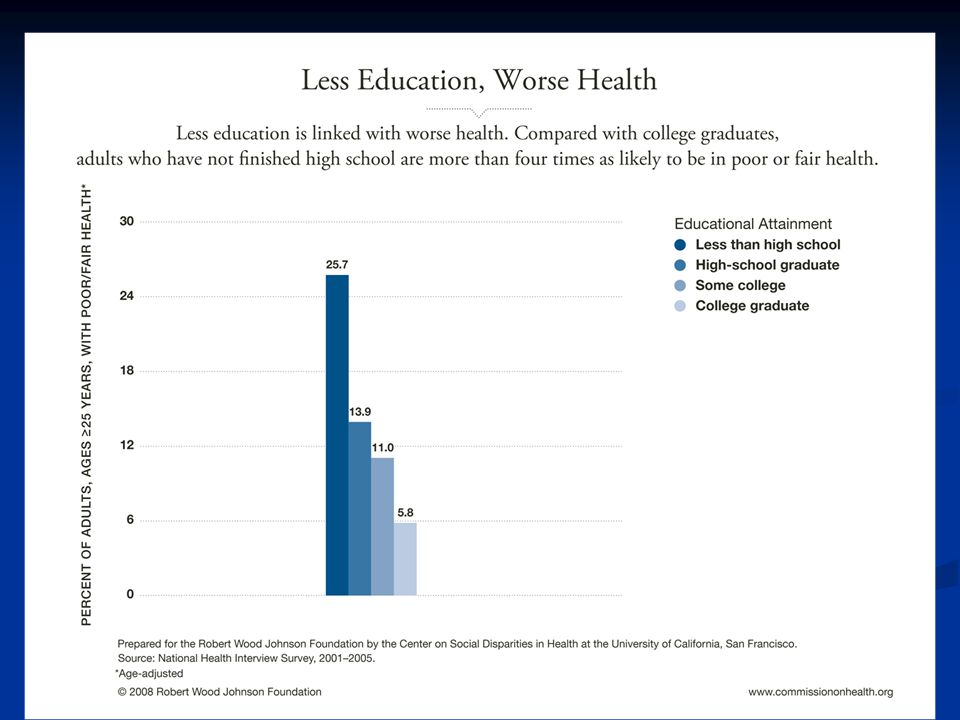


 Cinnabar.>")
. Can be “good” up.>")


 McGraw Hill Ryerson 2007 2.3 Effect of Bioaccumulation on Ecosystems Amphibians (like frogs) live on both land and in the water. They are also sensitive.>")


