Download presentation
Presentation is loading. Please wait.

1
Fiscal Impacts of Korean Public Pension System: A Generational Accounting Approach Young Jun Chun University of Incheon, Korea January 2006

2
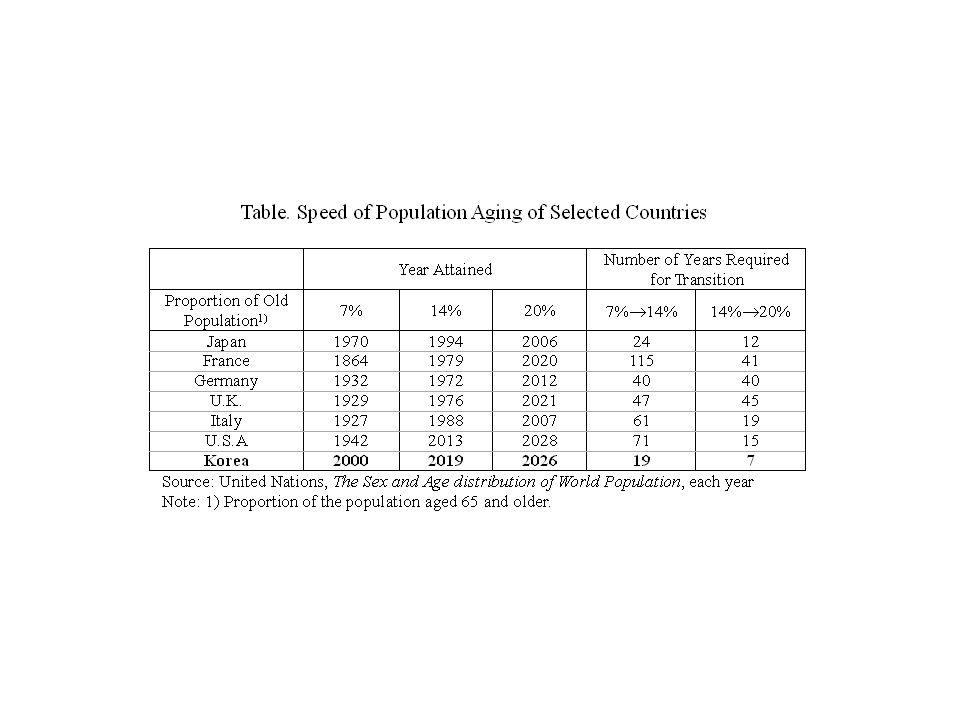
Motivation High speed of Population Aging in Korea - Old population proportion: 7.2% (2000) → 23.1% (2030, OECD average) Effects of population aging on Public Pensions budget - Increase in public pension benefits and contribution revenue decrease will deteriorate pension budgets → Increase in Fiscal Burden of future generations
 → 23.1% (2030, OECD average) Effects of population aging on Public Pensions budget - Increase in public pension benefits and contribution revenue decrease will deteriorate pension budgets → Increase in Fiscal Burden of future generations")
4
Motivation Budgetary Imbalance of Public Pensions - Too generous public pension benefit promised compared with contribution Replacement Ratio: 60%(NPS), 70%(OCP) Contribution Rate: 9%(NPS), 17%(OCP) ※ NPS: National Pension OCP: Occupational Pensions PCS: Pension for Civil Servants PPS: Pension for Private School Employees
, 70%(OCP) Contribution Rate: 9%(NPS), 17%(OCP) ※ NPS: National Pension OCP: Occupational Pensions PCS: Pension for Civil Servants PPS: Pension for Private School Employees")
5
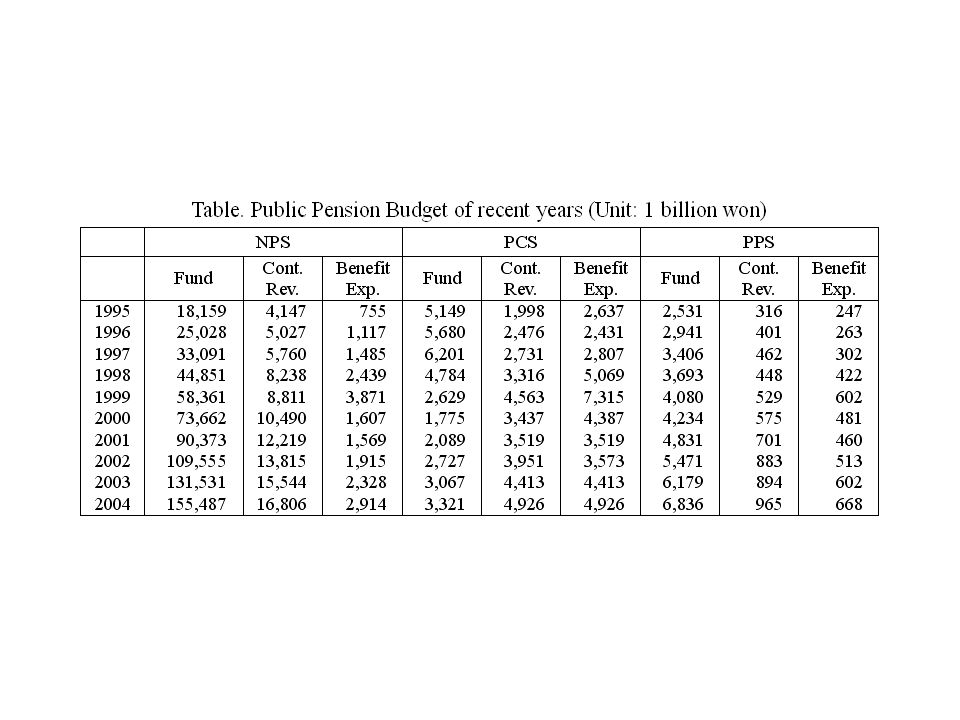
Motivation Short History of Public Pensions - National Pension (NPS) was introduced in 1988. Regulatory Pension benefit will be paid from 2008 - Occupational Pensions (OCP) has longer history, but the proportion of Participants of OCP is small. Pension for Civil Servants (PCS): introduced in 1960 Pension for Private School Employees (PPS): introduced in 1972. → Large amount of contribution revenue without regulatory payment of NPS benefits results in accumulation of NPS funds. → Difficult to evaluate the fiscal impacts of public pension and intergenerational redistribution effects using cross-sectional distribution of pension contribution and benefits. Need a forward-looking approach: i.e. need to project contribution and benefit distribution by age for future years
 has longer history, but the proportion of Participants of OCP is small. Pension for Civil Servants (PCS): introduced in 1960 Pension for Private School Employees (PPS): introduced in → Large amount of contribution revenue without regulatory payment of NPS benefits results in accumulation of NPS funds. → Difficult to evaluate the fiscal impacts of public pension and intergenerational redistribution effects using cross-sectional distribution of pension contribution and benefits. Need a forward-looking approach: i.e. need to project contribution and benefit distribution by age for future years.")
7
Purpose Investigate financial sustainability of public pensions and their intergenerational redistributive Effects - Generational Accounting Approach to evaluate the effects of public pensions - Construct Projection Model for public pensions to compute the benefit and contribution distribution of future years

8
Generational Accounts (GA) Present value of net tax payment of representative individual of generations for remaining lifetime - Net tax: tax payment – transfer income
 Present value of net tax payment of representative individual of generations for remaining lifetime - Net tax: tax payment – transfer income")
9
Traditional Method of computing GA Project aggregate values of Taxes and Benefits Estimate age*sex distribution using micro-data Allocate aggregates across age and sex in each year, based on the assumption that the age*sex distribution will not change Compute PV of net payment for each cohort

10
Modification of Method Compute age*sex distribution of contributions and benefits in future years, using projection models, because the distribution changes overtime, as the NPS and other public pensions mature.

11
Projection (NPS) Use National Pension Corporation (NPC)’s 2000 projection of distribution of the covered population (participants), average income, new benefit recipients by age*sex*year. Modify the distribution of participants and new benefit recipients using 2005 Population Projection of National Statistics Office (NS0). - Assume that the ratio of the number of participants and new benefit recipients by age*sex to the relevant population group is the same as that assumed in NPC’s projection ※ NPC’s projection used 1996 population projection Modify average income and average benefit amount of new benefit recipients, by changing assumptions on macroeconomic variables Compute contribution by age*sex, based on the assumption on participation rate, contribution collection rate, contribution rates. Compute the pension benefit recipients by age*sex, taking account of demographic characteristics
. - Assume that the ratio of the number of participants and new benefit recipients by age*sex to the relevant population group is the same as that assumed in NPC’s projection ※ NPC’s projection used 1996 population projection Modify average income and average benefit amount of new benefit recipients, by changing assumptions on macroeconomic variables Compute contribution by age*sex, based on the assumption on participation rate, contribution collection rate, contribution rates. Compute the pension benefit recipients by age*sex, taking account of demographic characteristics.")
12
Projection Model (PCS, PPS) Use data published statistical yearbook: - Statistical Yearbook for the PCS Statistical Yearbook for the PPS Distribution of Participants by age*sex*duration of service - For benchmark year (2004), use data in the statistical yearbooks - After benchmark year, compute the distribution, using distribution of the newly employed, survival rate, retirement rate by age*sex computed using the data of the statistical yearbook
 Use data published statistical yearbook: - Statistical Yearbook for the PCS Statistical Yearbook for the PPS Distribution of Participants by age*sex*duration of service - For benchmark year (2004), use data in the statistical yearbooks - After benchmark year, compute the distribution, using distribution of the newly employed, survival rate, retirement rate by age*sex computed using the data of the statistical yearbook")
13
Projection Model (PCS, PPS) Wage by age*sex*duration of service - For benchmark year (2004), use data on wage by duration of service in the statistical yearbooks - After benchmark year, compute wage using the profile of benchmark year and the assumption that the wage growth rate is the same across age groups. Distribution of benefit recipients - For benchmark year (2004), use data on the distribution by age in the statistical yearbooks - After benchmark year, compute new benefit recipients by age*duration of service using retirement rate computed using the statistical yearbook
, use data on the distribution by age in the statistical yearbooks - After benchmark year, compute new benefit recipients by age*duration of service using retirement rate computed using the statistical yearbook.")
14
Projection Model (PCS, PPS) Benefit Amounts - For benchmark year (2004), use the profile published in the statistical yearbook - After benchmark year, compute the benefit amount for new benefit recipients, and compute weighted average of benefit amount of the existing benefit recipients and the new benefit recipients Compute contribution by age*sex, using distribution of participants, computed wage profile, and contribution rate
 Benefit Amounts - For benchmark year (2004), use the profile published in the statistical yearbook - After benchmark year, compute the benefit amount for new benefit recipients, and compute weighted average of benefit amount of the existing benefit recipients and the new benefit recipients Compute contribution by age*sex, using distribution of participants, computed wage profile, and contribution rate")
15
Findings Aggregate Contribution and Benefits - Aggregate Public Pension Benefits rise up to 17% of GDP in the long run. - Aggregate Public Pension Contribution Revenue does not exceed 4% of GDP - Pension budget turns deficit around 2015, and the magnitude of deficit reaches up to 13% of GDP, if current policy maintains. → Long-term budgetary imbalance Public Pension benefit profile changes overtime. - The Profile becomes flatter as the NPS matures.

18
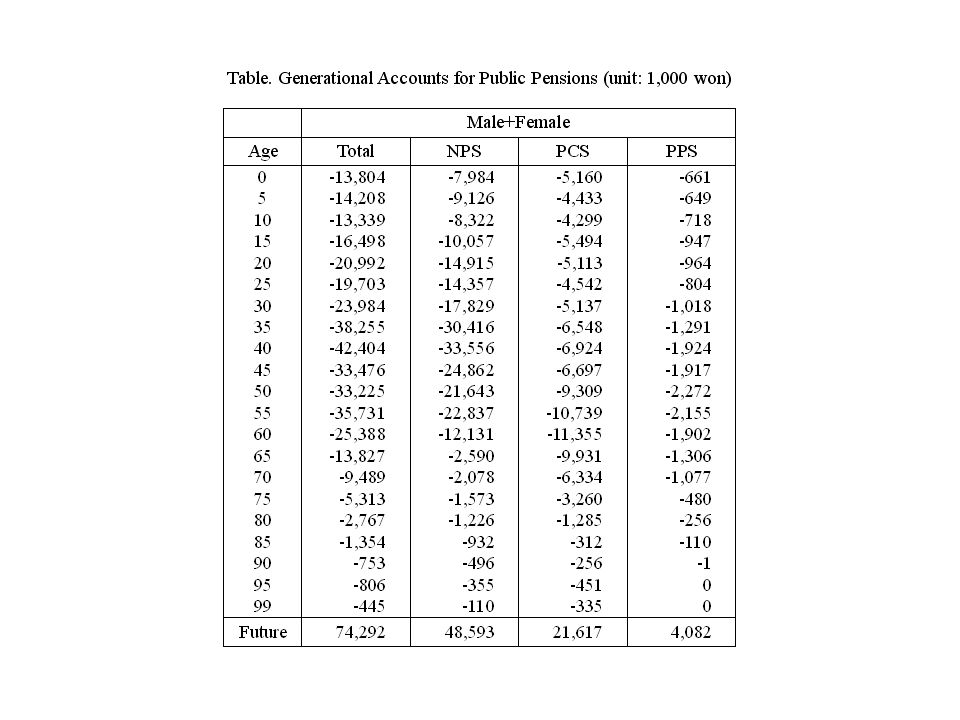
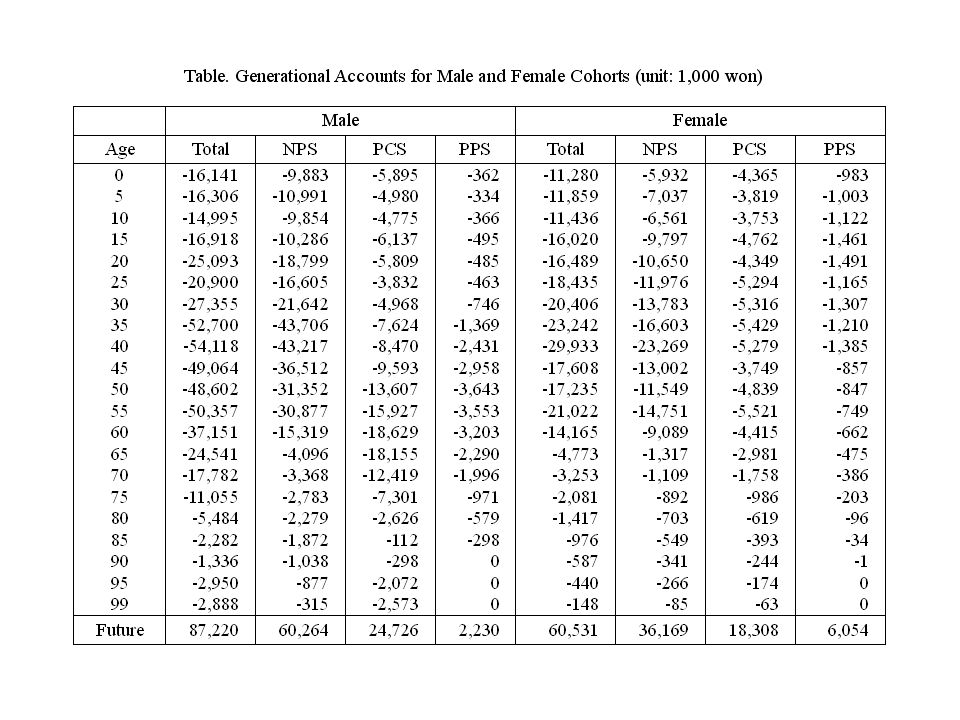
Findings Current Public Pension system substantially shifts its fiscal burden to future generations. - Net payments for all the current generations (alive in 2004) are negative - The accounts for future generations is positive and its magnitude is very large. Generational Imbalance is more serious for the PCS and the PPS then for the NPS. - Fiscal burden shifted to future generations by the PCS (PPS) is 44.5 (8.4%) of that by the NPS, while the ratio of the number of the PCS (PPS) participants to that of the NPS is only 7.6% (18%).
 are negative - The accounts for future generations is positive and its magnitude is very large. Generational Imbalance is more serious for the PCS and the PPS then for the NPS. - Fiscal burden shifted to future generations by the PCS (PPS) is 44.5 (8.4%) of that by the NPS, while the ratio of the number of the PCS (PPS) participants to that of the NPS is only 7.6% (18%)..")
20
Findings Net transfers from the public pensions are larger for male than for female, except for the young age groups of the PPS participants. - Korean public pensions covers the income earners and the proportion of the economically active population is larger for males. - The proportion of the female newly employed private school employee is much larger than the male. ※ number of newly employed (PPS) in 2004 male: 5,176 female: 13,303
 in 2004 male: 5,176 female: 13,303.")
22
Findings The required contribution (and benefit) adjustment to attain long-term budgetary balance is very large. - Need to raise contribution rate by 127% of current rate, if adjust in 2010. - The tax increase is accompanied by the same percentage decrease in benefits, the required adjustment decreases to 36%. The adjustment is delayed until 2020, the adjustment magnitude of contribution (and benefit) rise to 165%(41%)
 rise to 165%(41%).")
24
Findings Changing the assumption on fertility rate, discount rate, and wage growth rate does not produce qualitatively different results Rise in wage growth rate does not improve the public finance of the public pensions. - Rise in wage growth rate increases the magnitude of the required tax adjustment, because wage growth increases the benefit amounts. - The deficit of public pension become larger then the contribution revenue after 2030. Therefore, the wage growth raises the deficit.

26
Summary Current public pension policy in Korea is not sustainable, even though its current budget maintains surplus and the magnitude of pension fund is very large. - The annual budget of public pensions may cause fiscal illusion, which implies that forward-looking approaches are needed to evaluate the intergenerational redistribution

27
Summary Evaluation of intergenerational redistributions based on cross-sectional distributions may be misleading. - Need to separate age effects and cohort effects using panel studies. - In addition, forward-looking approaches are needed in order to take account of changing trend of economic behavior in economies that experience rapid transition.

Similar presentations