Download presentation
Presentation is loading. Please wait.

1
6.5 Graphing Linear Inequalities in Two Variables Wow, graphing really is fun!

2
What is a linear inequality? A linear inequality in x and y is an inequality that can be written in one of the following forms. ax + by < c ax + by ≤ c ax + by > c ax + by ≥ c

3
An ordered pair (a, b) is a solution of a linear equation in x and y if the inequality is TRUE when a and b are substituted for x and y, respectively. For example: is (1, 3) a solution of 4x – y < 2? 4(1) – 3 < 2 1 < 2 This is a true statement so (1, 3) is a solution.
 a solution of 4x – y < 2. 4(1) – 3 < 2 1 < 2 This is a true statement so (1, 3) is a solution..")
4
Check whether the ordered pairs are solutions of 2x - 3y ≥ -2. a. (0, 0) b. (0, 1) c. (2, -1) (x, y)SubstituteConclusion A(0,0)2(0) – 3(0)=0 ≥ -2(0,0) is a solution. B(0,1)2(0) – 3(1)=-3 ≥-2(0, 1) is NOT a solution. C(2,-1)2(2) – 3(-1)=7 ≥ -2(2, -1) is a solution.
 b. (0, 1) c. (2, -1) (x, y)SubstituteConclusion A(0,0)2(0) – 3(0)=0 ≥ -2(0,0) is a solution. B(0,1)2(0) – 3(1)=-3 ≥-2(0, 1) is NOT a solution. C(2,-1)2(2) – 3(-1)=7 ≥ -2(2, -1) is a solution..")
5
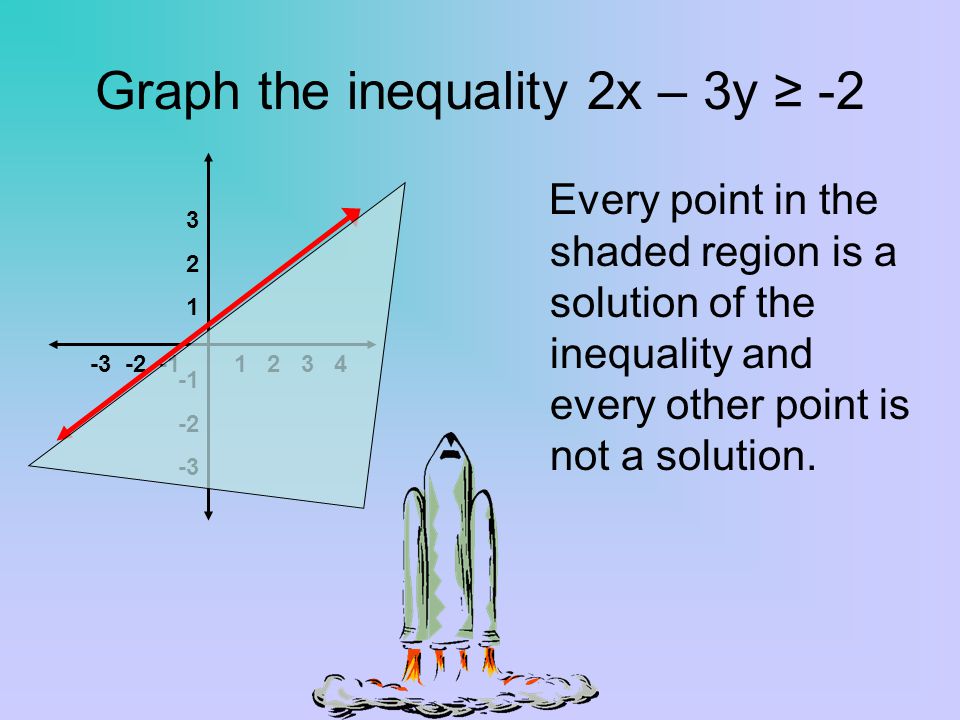
Graph the inequality 2x – 3y ≥ -2 Every point in the shaded region is a solution of the inequality and every other point is not a solution. 321321 -2 -3 1 2 3 4-3 -2 -1
6
Steps to graphing a linear inequality: 1.Sketch the graph of the corresponding linear equation. 1.Use a dashed line for inequalities with. 2.Use a solid line for inequalities with ≤ or ≥. 3.This separates the coordinate plane into two half planes.

7
2.Test a point in one of the half planes to find whether it is a solution of the inequality. 3.If the test point is a solution, shade its half plane. If not shade the other half plane.

8
Sketch the graph of 6x + 5y ≥ 30 1.Write in slope- intercept form: y ≥ - 6 / 5 x + 6 This will be a solid line. 2.Test a point. (0,0) 6(0) + 5(0) ≥ 30 0 ≥ 30 Not a solution. 3.Shade the side that doesn’t include (0,0). 642642 -2 -4 -6 2 4 6 8-6 -4 -2
 6(0) + 5(0) ≥ 30 0 ≥ 30 Not a solution. 3.Shade the side that doesn’t include (0,0)")
9
Sketch the graph y < 6. 1.This will be a dashed line at y = 6. 2.Test a point. (0,0) 0 < 6 This is a solution. 3.Shade the side that includes (0,0). 642642 -2 -4 -6 2 4 6 8-6 -4 -2
 0 < 6 This is a solution. 3.Shade the side that includes (0,0)")
10
Sketch the graph of 2x – y ≥ 1 1.Write in slope- intercept form: y = 2x – 1 This will be a solid line. 2.Test a point. (0,0) 2(0) - 0 ≥ 1 0 ≥ 1 Not a solution. 3.Shade the side that doesn’t include (0,0). 321321 -2 -3 1 2 3 4-3 -2 -1
 2(0) - 0 ≥ 1 0 ≥ 1 Not a solution. 3.Shade the side that doesn’t include (0,0)")
Similar presentations


 Warm-up 2.) Lesson: Graphing Linear Inequalities in Two Variables 3.) Class/Homework WS Graph Linear Inequalities 4.) STAY ON TASK!!!>")

 y < –3 and ( b ) x < 2 in a coordinate plane. Test the point (0,0). Because (0,0) is.>")


![Graphing Inequalities of Two Variables Recall… Solving inequalities of 1 variable: x + 4 ≥ 6 x ≥ 2 [all points greater than or equal to 2] Different from.](/18/6205026/big_thumb.jpg "Graphing Inequalities of Two Variables Recall… Solving inequalities of 1 variable: x + 4 ≥ 6 x ≥ 2 [all points greater than or equal to 2] Different from.>")


 B. (0,1) C. (2,-1)>")

 is a solution if it makes the inequality true. Are the following.>")