Download presentation
Presentation is loading. Please wait.

1
Hypothesis tests for slopes in multiple linear regression model Using the general linear test and sequential sums of squares

2
An example

3
Study on heart attacks in rabbits An experiment in 32 anesthetized rabbits subjected to an infarction (“heart attack”) Three experimental groups: –Hearts cooled to 6º C within 5 minutes of occluded artery (“early cooling”) –Hearts cooled to 6º C within 25 minutes of occluded artery (“late cooling”) –Hearts not cooled at all (“no cooling”)
 Three experimental groups: –Hearts cooled to 6º C within 5 minutes of occluded artery ( early cooling ) –Hearts cooled to 6º C within 25 minutes of occluded artery ( late cooling ) –Hearts not cooled at all ( no cooling )")
4
Study on heart attacks in rabbits Measurements made at end of experiment: –Size of the infarct area (in grams) –Size of region at risk for infarction (in grams) Primary research question: –Does the mean size of the infarcted area differ among the three treatment groups – no cooling, early cooling, late cooling – when controlling for the size of the region at risk for infarction?
 –Size of region at risk for infarction (in grams) Primary research question: –Does the mean size of the infarcted area differ among the three treatment groups – no cooling, early cooling, late cooling – when controlling for the size of the region at risk for infarction")
5
A potential regression model where … y i is size of infarcted area (in grams) of rabbit i x i1 is size of the region at risk (in grams) of rabbit i x i2 = 1 if early cooling of rabbit i, 0 if not x i3 = 1 if late cooling of rabbit i, 0 if not and … the independent error terms i follow a normal distribution with mean 0 and equal variance 2.
 of rabbit i x i1 is size of the region at risk (in grams) of rabbit i x i2 = 1 if early cooling of rabbit i, 0 if not x i3 = 1 if late cooling of rabbit i, 0 if not and … the independent error terms i follow a normal distribution with mean 0 and equal variance 2.")
6
The estimated regression function The regression equation is InfSize = - 0.135 + 0.613 AreaSize - 0.243 X2 - 0.0657 X3

7
Possible hypothesis tests for slopes #1. Is the regression model containing all three predictors useful in predicting the size of the infarct? #2. Is the size of the infarct significantly (linearly) related to the area of the region at risk?
 related to the area of the region at risk .")
8
Possible hypothesis tests for slopes #3. (Primary research question) Is the size of the infarct area significantly (linearly) related to the type of treatment after controlling for the size of the region at risk for infarction?
 Is the size of the infarct area significantly (linearly) related to the type of treatment after controlling for the size of the region at risk for infarction .")
9
Linear regression’s general linear test An aside

10
Three basic steps Define a (larger) full model. Define a (smaller) reduced model. Use an F statistic to decide whether or not to reject the smaller reduced model in favor of the larger full model.

11
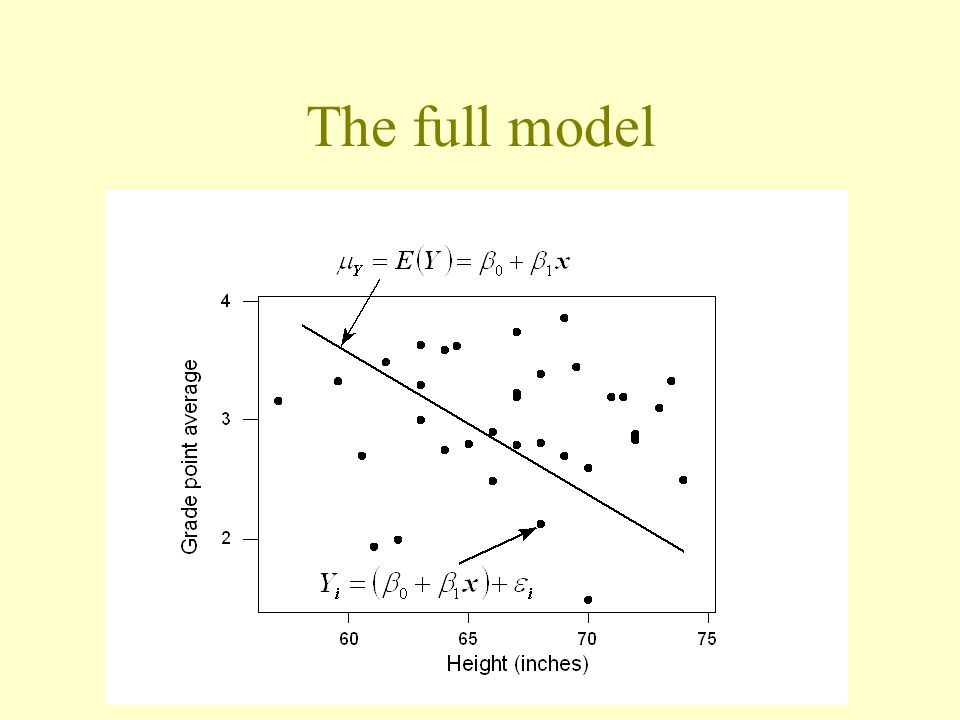
The full model For simple linear regression, the full model is: The full model (or unrestricted model) is the model thought to be most appropriate for the data.
 is the model thought to be most appropriate for the data.")
12
The full model

14
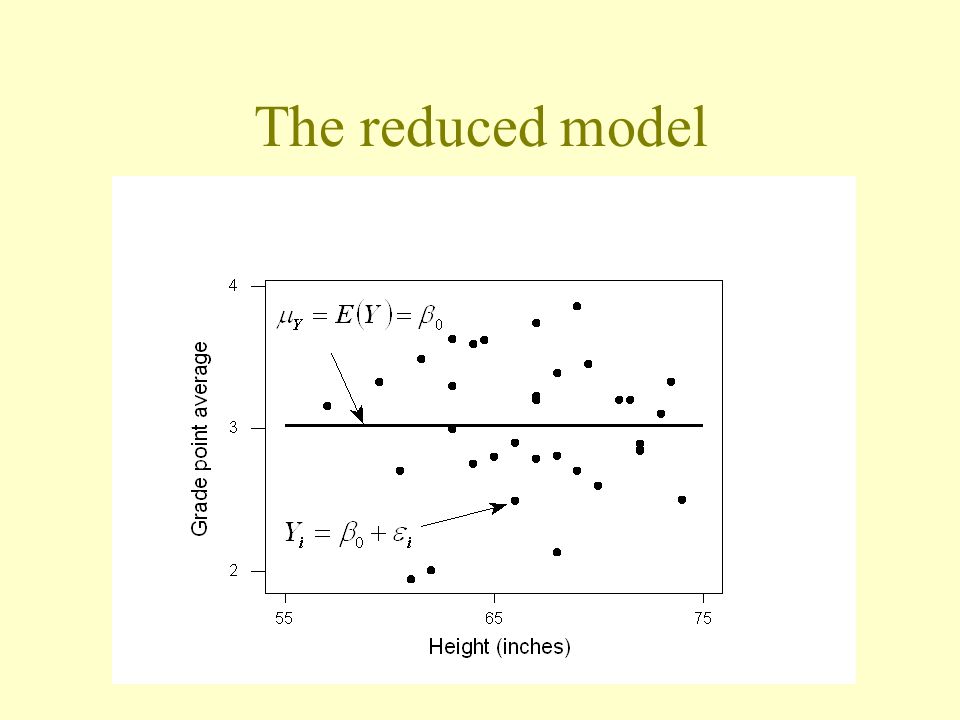
The reduced model The reduced model (or restricted model) is the model described by the null hypothesis H 0. For simple linear regression, the null hypothesis is H 0 : β 1 = 0. Therefore, the reduced model is:

15
The reduced model

17
The general linear test approach “Fit the full model” to the data. –Obtain least squares estimates of β 0 and β 1. –Determine error sum of squares – “SSE(F).” “Fit the reduced model” to the data. –Obtain least squares estimate of β 0. –Determine error sum of squares – “SSE(R).”
. Fit the reduced model to the data. –Obtain least squares estimate of β 0. –Determine error sum of squares – SSE(R). .")
18
The general linear test approach

20
Compare SSE(R) and SSE(F). SSE(R) is always larger than (or same as) SSE(F). –If SSE(F) is close to SSE(R), then variation around fitted full model regression function is almost as large as variation around fitted reduced model regression function. –If SSE(F) and SSE(R) differ greatly, then the additional parameter(s) in the full model substantially reduce the variation around the fitted regression function.
 is close to SSE(R), then variation around fitted full model regression function is almost as large as variation around fitted reduced model regression function. –If SSE(F) and SSE(R) differ greatly, then the additional parameter(s) in the full model substantially reduce the variation around the fitted regression function..")
21
How close is close? The test statistic is a function of SSE(R)-SSE(F): The degrees of freedom (df R and df F ) are those associated with the reduced and full model error sum of squares, respectively. Reject H 0 if F* is large (or if the P-value is small).
-SSE(F): The degrees of freedom (df R and df F ) are those associated with the reduced and full model error sum of squares, respectively. Reject H 0 if F* is large (or if the P-value is small)..")
22
But for simple linear regression, it’s just the same F test as before

23
The formal F-test for slope parameter β 1 Null hypothesis H 0 : β 1 = 0 Alternative hypothesis H A : β 1 ≠ 0 Test statistic P-value = What is the probability that we’d get an F* statistic as large as we did, if the null hypothesis is true? The P-value is determined by comparing F* to an F distribution with 1 numerator degree of freedom and n-2 denominator degrees of freedom.

24
Example: Alcoholism and muscle strength? Report on strength tests for a sample of 50 alcoholic men –x = total lifetime dose of alcohol (kg per kg of body weight) –y = strength of deltoid muscle in man’s non- dominant arm
 –y = strength of deltoid muscle in man’s non- dominant arm.")
25
Fit the reduced model

26
Fit the full model

27
The ANOVA table Analysis of Variance Source DF SS MS F P Regression 1 504.04 504.040 33.5899 0.000 Error 48 720.27 15.006 Total 49 1224.32 SSE(R)=SSTOSSE(F)=SSE There is a statistically significant linear association between alcoholism and arm strength.
=SSTOSSE(F)=SSE There is a statistically significant linear association between alcoholism and arm strength.")
28
Sequential (or extra) sums of squares Another aside
 sums of squares Another aside")
29
What is a sequential sum of squares? It can be viewed in either of two ways: –It is the reduction in the error sum of squares (SSE) when one or more predictor variables are added to the model. –Or, it is the increase in the regression sum of squares (SSR) when one or more predictor variables are added to the model.
 when one or more predictor variables are added to the model. –Or, it is the increase in the regression sum of squares (SSR) when one or more predictor variables are added to the model..")
30
Notation The error sum of squares (SSE) and regression sum of squares (SSR) depend on what predictors are in the model. So, note what variables are in the model. –SSE(X 1 ) denotes the error sum of squares when X 1 is the only predictor in the model –SSR(X 1, X 2 ) denotes the regression sum of squares when X 1 and X 2 are both in the model
 denotes the error sum of squares when X 1 is the only predictor in the model –SSR(X 1, X 2 ) denotes the regression sum of squares when X 1 and X 2 are both in the model.")
31
Notation The sequential sum of squares of adding: –X 2 to the model in which X 1 is the only predictor is denoted SSR(X 2 | X 1 ) –X 1 to the model in which X 2 is the only predictor is denoted SSR(X 1 | X 2 ) –X 1 to the model in which X 2 and X 3 are predictors is denoted SSR(X 1 | X 2, X 3 ) –X 1 and X 2 to the model in which X 3 is the only predictor is denoted SSR(X 1, X 2 | X 3 )
 –X 1 to the model in which X 2 is the only predictor is denoted SSR(X 1 | X 2 ) –X 1 to the model in which X 2 and X 3 are predictors is denoted SSR(X 1 | X 2, X 3 ) –X 1 and X 2 to the model in which X 3 is the only predictor is denoted SSR(X 1, X 2 | X 3 )")
32
Allen Cognitive Level (ACL) Study David and Riley (1990) investigated relationship of ACL test to level of psychopathology in a set of 69 patients in a hospital psychiatry unit: –Response y = ACL score –x 1 = vocabulary (Vocab) score on Shipley Institute of Living Scale –x 2 = abstraction (Abstract) score on Shipley Institute of Living Scale –x 3 = score on Symbol-Digit Modalities Test (SDMT)
 Study David and Riley (1990) investigated relationship of ACL test to level of psychopathology in a set of 69 patients in a hospital psychiatry unit: –Response y = ACL score –x 1 = vocabulary (Vocab) score on Shipley Institute of Living Scale –x 2 = abstraction (Abstract) score on Shipley Institute of Living Scale –x 3 = score on Symbol-Digit Modalities Test (SDMT)")
33
Regress y = ACL on x 1 = Vocab The regression equation is ACL = 4.23 + 0.0298 Vocab... Analysis of Variance Source DF SS MS F P Regression 1 2.6906 2.6906 4.47 0.038 Residual Error 67 40.3590 0.6024 Total 68 43.0496

34
Regress y = ACL on x 1 = Vocab and x 3 = SDMT The regression equation is ACL = 3.85 - 0.0068 Vocab + 0.0298 SDMT... Analysis of Variance Source DF SS MS F P Regression 2 11.7778 5.8889 12.43 0.000 Residual Error 66 31.2717 0.4738 Total 68 43.0496 Source DF Seq SS Vocab 1 2.6906 SDMT 1 9.0872

35
The sequential sum of squares SSR(X 3 | X 1 ) SSR(X 3 | X 1 ) is the reduction in the error sum of squares when X 3 is added to the model in which X 1 is the only predictor:
 SSR(X 3 | X 1 ) is the reduction in the error sum of squares when X 3 is added to the model in which X 1 is the only predictor:")
36
The sequential sum of squares SSR(X 3 | X 1 ) SSR(X 3 | X 1 ) is the increase in the regression sum of squares when X 3 is added to the model in which X 1 is the only predictor:
 SSR(X 3 | X 1 ) is the increase in the regression sum of squares when X 3 is added to the model in which X 1 is the only predictor:")
37
The sequential sum of squares SSR(X 3 | X 1 ) The regression equation is ACL = 3.85 - 0.0068 Vocab + 0.0298 SDMT... Analysis of Variance Source DF SS MS F P Regression 2 11.7778 5.8889 12.43 0.000 Residual Error 66 31.2717 0.4738 Total 68 43.0496 Source DF Seq SS Vocab 1 2.6906 SDMT 1 9.0872

38
Regress y = ACL on x 3 = SDMT (Order in which predictors are added determine the “Seq SS” you get.) The regression equation is ACL = 3.75 + 0.0281 SDMT... Analysis of Variance Source DF SS MS F P Regression 1 11.680 11.680 24.95 0.000 Residual Error 67 31.370 0.468 Total 68 43.050

39
Regress y = ACL on x 3 = SDMT and x 1 = Vocab (Order in which predictors are added determine the “Seq SS” you get.) The regression equation is ACL = 3.85 + 0.0298 SDMT - 0.0068 Vocab... Analysis of Variance Source DF SS MS F P Regression 2 11.7778 5.8889 12.43 0.000 Residual Error 66 31.2717 0.4738 Total 68 43.0496 Source DF Seq SS SDMT 1 11.6799 Vocab 1 0.0979

40
The sequential sum of squares SSR(X 1 | X 3 ) SSR(X 1 | X 3 ) is the reduction in the error sum of squares when X 1 is added to the model in which X 3 is the only predictor:
 SSR(X 1 | X 3 ) is the reduction in the error sum of squares when X 1 is added to the model in which X 3 is the only predictor:")
41
The sequential sum of squares SSR(X 1 | X 3 ) SSR(X 1 | X 3 ) is the increase in the regression sum of squares when X 1 is added to the model in which X 3 is the only predictor:
 SSR(X 1 | X 3 ) is the increase in the regression sum of squares when X 1 is added to the model in which X 3 is the only predictor:")
42
Regress y = ACL on x 3 = SDMT and x 1 = Vocab (Order in which predictors are added determine the “Seq SS” you get.) The regression equation is ACL = 3.85 + 0.0298 SDMT - 0.0068 Vocab... Analysis of Variance Source DF SS MS F P Regression 2 11.7778 5.8889 12.43 0.000 Residual Error 66 31.2717 0.4738 Total 68 43.0496 Source DF Seq SS SDMT 1 11.6799 Vocab 1 0.0979

43
More sequential sums of squares (Regress y on x 3, x 1, x 2 ) The regression equation is ACL = 3.95 + 0.0274 SDMT - 0.0174 Vocab + 0.0122 Abstract... Analysis of Variance Source DF SS MS F P Regression 3 12.3009 4.1003 8.67 0.000 Residual Error 65 30.7487 0.4731 Total 68 43.0496 Source DF Seq SS SDMT 1 11.6799 Vocab 1 0.0979 Abstract 1 0.5230

44
Two- (or three- or more-) degree of freedom sequential sums of squares The regression equation is ACL = 3.95 + 0.0274 SDMT - 0.0174 Vocab + 0.0122 Abstract... Analysis of Variance Source DF SS MS F P Regression 3 12.3009 4.1003 8.67 0.000 Residual Error 65 30.7487 0.4731 Total 68 43.0496 Source DF Seq SS SDMT 1 11.6799 Vocab 1 0.0979 Abstract 1 0.5230

45
The hypothesis tests for the slopes

46
Possible hypothesis tests for slopes #1. Is the regression model containing all three predictors useful in predicting the size of the infarct? #2. Is the size of the infarct significantly (linearly) related to the area of the region at risk?
 related to the area of the region at risk .")
47
Possible hypothesis tests for slopes #3. (Primary research question) Is the size of the infarct area significantly (linearly) related to the type of treatment upon controlling for the size of the region at risk for infarction?
 Is the size of the infarct area significantly (linearly) related to the type of treatment upon controlling for the size of the region at risk for infarction .")
48
Testing all slope parameters are 0 Full model Reduced model

49
Testing all slope parameters are 0 The general linear test statistic: becomes the usual overall F-test:

50
Testing all slope parameters are 0 Use overall F-test and P-value reported in ANOVA table. The regression equation is InfSize = - 0.135 + 0.613 AreaSize - 0.243 X2 - 0.0657 X3... Analysis of Variance Source DF SS MS F P Regression 3 0.95927 0.31976 16.43 0.000 Residual Error 28 0.54491 0.01946 Total 31 1.50418

51
Testing one slope is 0, say β 1 = 0 Full model Reduced model

52
Testing one slope is 0, say β 1 = 0 The general linear test statistic: becomes a partial F-test:

53
Equivalence of t-test to partial F-test for one slope Since there is only one numerator degree of freedom in the partial F-test for one slope, it is equivalent to the t-test. The t-test is a test for the marginal significance of the x 1 predictor after x 2 and x 3 have been taken into account.

54
The regression equation is InfSize = - 0.135 - 0.2430 X2 - 0.0657 X3 + 0.613 AreaSize Predictor Coef SE Coef T P Constant -0.1345 0.1040 -1.29 0.206 X2 -0.24348 0.06229 -3.91 0.001 X3 -0.06566 0.06507 -1.01 0.322 AreaSize 0.6127 0.1070 5.72 0.000 S = 0.1395 R-Sq = 63.8% R-Sq(adj) = 59.9% Analysis of Variance Source DF SS MS F P Regression 3 0.95927 0.31976 16.43 0.000 Residual Error 28 0.54491 0.01946 Total 31 1.50418 Source DF Seq SS X2 1 0.29994 X3 1 0.02191 AreaSize 1 0.63742
 = 59.9% Analysis of Variance Source DF SS MS F P Regression Residual Error Total Source DF Seq SS X X AreaSize")
55
Equivalence of the t-test to the partial F-test The t-test: and The partial F-test: F distribution with 1 DF in numerator and 28 DF in denominator x P( X <= x ) 32.7554 1.0000
")
56
The regression equation is InfSize = - 0.135 + 0.613 AreaSize - 0.243 X2 - 0.0657 X3 Predictor Coef SE Coef T P Constant -0.1345 0.1040 -1.29 0.206 AreaSize 0.6127 0.1070 5.72 0.000 X2 -0.24348 0.06229 -3.91 0.001 X3 -0.06566 0.06507 -1.01 0.322 S = 0.1395 R-Sq = 63.8% R-Sq(adj) = 59.9% Analysis of Variance Source DF SS MS F P Regression 3 0.95927 0.31976 16.43 0.000 Residual Error 28 0.54491 0.01946 Total 31 1.50418 Source DF Seq SS AreaSize 1 0.62492 X2 1 0.31453 X3 1 0.01981
 = 59.9% Analysis of Variance Source DF SS MS F P Regression Residual Error Total Source DF Seq SS AreaSize X X")
57
Testing whether two slopes are 0, say β 2 = β 3 = 0 Full model Reduced model

58
Testing whether two slopes are 0, say β 2 = β 3 = 0 The general linear test statistic: becomes a partial F-test:

59
The regression equation is InfSize = - 0.135 + 0.613 AreaSize - 0.243 X2 - 0.0657 X3 Predictor Coef SE Coef T P Constant -0.1345 0.1040 -1.29 0.206 AreaSize 0.6127 0.1070 5.72 0.000 X2 -0.24348 0.06229 -3.91 0.001 X3 -0.06566 0.06507 -1.01 0.322 S = 0.1395 R-Sq = 63.8% R-Sq(adj) = 59.9% Analysis of Variance Source DF SS MS F P Regression 3 0.95927 0.31976 16.43 0.000 Residual Error 28 0.54491 0.01946 Total 31 1.50418 Source DF Seq SS AreaSize 1 0.62492 X2 1 0.31453 X3 1 0.01981
 = 59.9% Analysis of Variance Source DF SS MS F P Regression Residual Error Total Source DF Seq SS AreaSize X X")
60
Testing whether β 2 = β 3 = 0 F distribution with 2 DF in numerator and 28 DF in denominator x P( X <= x ) 8.5900 0.9988
")
Similar presentations


>")


.>")


 correlation coefficient r.>")

 multiple regression model with interaction terms.>")
: E(Y) = + 1 X 1 + + k.>")


