Download presentation
Presentation is loading. Please wait.

1
Factors Affecting Population Numbers

2
Carrying capacity: the largest population of a species that an environment can support. 4 factors that determine the carrying capacity: 1. materials and energy (energy, water, carbon, and other essential nutrients 2. food chains: the population size is limited by the size of the populations at lower trophic levels. (Prey are limited by their predators and their food supply). 3. competition: each organism has the same need as any other. They compete for resources such as food, water, mates, space. 4. density: depending on their size, environment and way of life, different species have different needs for space.
. 3. competition: each organism has the same need as any other. They compete for resources such as food, water, mates, space. 4. density: depending on their size, environment and way of life, different species have different needs for space..")
3
Competition: Two types of competition: 1. intraspecific: among members of the same species 2. interspecific: between different species

4
Density: Two types of density factors can limit population sizes. 1. density-dependent factors: these are factors that increase as the population gets bigger and then eventually lead to a decrease in the population size by increasing death rate and lowering birth rate. * overcrowding *parasites/disease *aggression amongst members * neglect of offspring

5
2. density-independent factors: can limit a population regardless of its original size. * forest fire * flood * volcano

6
Population Growth Since all organisms reproduce, populations tend to grow over time If unlimited resources are present, growth will be exponential It will increase very quickly for rapidly reproducing organisms and more slowly for slowly reproducing ones The curve will be a “J” curve or an exponential growth curve

7
Generation# of bacteriatime 110110 2215min 3430min 4845min 5161hr 63275min 76490min 8128105min 92562hrs 10512 111024 122048 1340963hrs 148192 1516,384 1632,768 1765,5364hrs 18131,072 19262,144 20524,288 211,048,5765hrs 222,097,152 234,194,304 248,388,608 2516,777,2166hrs

8
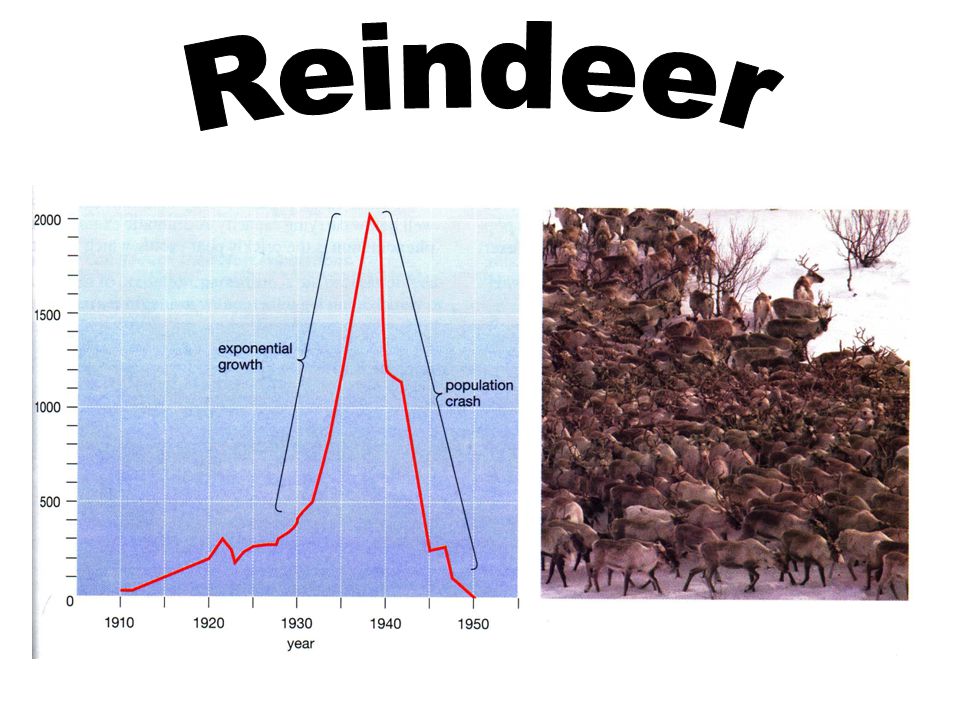
Population Growth 2 Resources are never unlimited in real life! As population rises, resources decline. If the growth is too rapid, resources are rapidly depleted and a population crash can occur This pattern occurs often with many populations (including humans) Gypsy moth caterpillar
 Gypsy moth caterpillar.")
10
Population Growth 3 More often what happens is that the resources slowly decrease, the growth rate slowly decreases, and they meet. This results in an S - shaped curve This sustainable population number that they keep returning to is the carrying capacity of the environment for that particular organism

11
Predator Prey Populations Predator Prey Populations means that the two populations are linked- a change in one population causes a change in the other population.

12
The Rabbit - Wolf Example Year 1- 3000 rabbit and 5 wolves- the wolves have lots of food so majority of their offspring survive Year 2- 2000 rabbits and 15 wolves- many rabbits were eaten by the wolves and more young wolves survive. (This is the closest we get to a perfect system- wolves are fed and keeping the rabbit population in check.) Year 3- 2000 rabbits and 25 wolves- not enough rabbits to feed the wolves. Rabbit population continues to drop and wolves begin to starve. Wolf population also drops. Year 4- Rabbit population begins to recover. Year 5- Whole process repeats again.
 Year rabbits and 25 wolves- not enough rabbits to feed the wolves. Rabbit population continues to drop and wolves begin to starve. Wolf population also drops. Year 4- Rabbit population begins to recover. Year 5- Whole process repeats again..")
13
Rabbit - Wolf Populations As the population of rabbits grows, so does the population of wolves, until there are so many wolves that they overeat the rabbits, whereupon the wolf population begins to diminish. But once the wolf population diminishes, the rabbit population is able to begin growing again, and of course as it does so does the wolf population, in a cycle that never ends.

14
Human Growth Patterns What are the causes of the rapid growth of human populations? What are some possible consequences of this growth pattern? What will our future look like? (Remember the Reindeer?)
.")
15
Succession… Changes in the structure of a community of organisms; the replacement of existing species by more recently arriving species.

16
Before After

17
Primary Succession : After a major disturbance such as an ice age, the rocks are bare, there isn’t even soil, so it is with great difficultly that the plants return and re-establish themselves.

18
Pioneer species: Pioneer species: the organisms that come first…they will establish themselves on bare rock and start to change the ecosystem!

20
Secondary Succession… This type of succession begins after a disturbance which doesn’t remove all of the vegetation. (Not down to the bare rocks) Examples: forest fires deforestation construction volcanos
 Examples: forest fires deforestation construction volcanos.")
Similar presentations