Download presentation
Presentation is loading. Please wait.

1
Measurement in Psychology

2
A construct is an idea or a concept that we wish to explore. More particularly we wish to make measurements of about this idea. Examples of constructs include Intelligence Aggression Maturity Depression

3
Measurement in Psychology Operationalisation is the process by which we translate the construct or idea into something we can measure. Thus we transform the idea of intelligence with the use of a standardised IQ test or we may measure depression using a depression index according to a standard test.

4
Measurement in Psychology These measures are divided into Objective and Subjective Measures.

5
Measurement in Psychology Objective quantitative measures include Standardised tests Physiological measures Heart rate Skin conductivity (lie detector) Heart rate Behaviour counts Eg counting aggressive acts or number of attempts to join a conversation
 Heart rate Behaviour counts Eg counting aggressive acts or number of attempts to join a conversation")
6
Measurement in Psychology Subjective measures include Questionnaires Rating scales Open-ended questions “How did you feel?” “What do you think?” eg Year 11 survey

7
Measurement in Psychology Describing data Quantitative Data – numbers Qualitative Data – descriptions, pictures

8
Measurement in Psychology Quantitative data We need to sort out and describe the data – Descriptive statistics Use the data to make decisions or inferences – Inferential statistics

9
Measurement in Psychology We must first understand to the type of data we are dealing with and then what methods are best used to deal with these data.

10
Measurement in Psychology Nominal data We classify according to category only. Sometimes called categorical data. Eg type of sport played Type of car owned Gender Favourite type of music

11
Measurement in Psychology We would often display these data as a bar graph and we would measure central tendency with the mode. The mode is the most popular value.

12
Measurement in Psychology Car Number of owners Toyundai11 Volksburu16 Mitsubenz3

13
Measurement in Psychology

14
Ordinal Scale Some sense of order, but the magnitude makes no sense. Eg classifying age as child, teen-ager, adult, elderly. There is a clear order but the magnitude makes no sense. We would use a bar graph and the median to determine central tendency.

15
Measurement in Psychology Age ClassPopulation in Hicksville Child120 Teen-age180 Adult400 Elderly100 Total = 800

16
Measurement in Psychology

17
Interval Scale Here, the magnitude of the numbers is relevant and the intervals between the numbers can be compared. Thus we can speak meaningfully of the difference between 15°C and 25° as being the same as the difference between 21°C and 31°C. However, the zero point is not really zero and so 20°C is not half as hot as 40°C Here we can use the mean and the median.

18
Measurement in Psychology Ratio Scale – same as the interval scale, except that the zero is now relevant and important. Eg distances from Adelaide to other major centres. Heights of buildings in a city. Here we use the mean or the median.

19
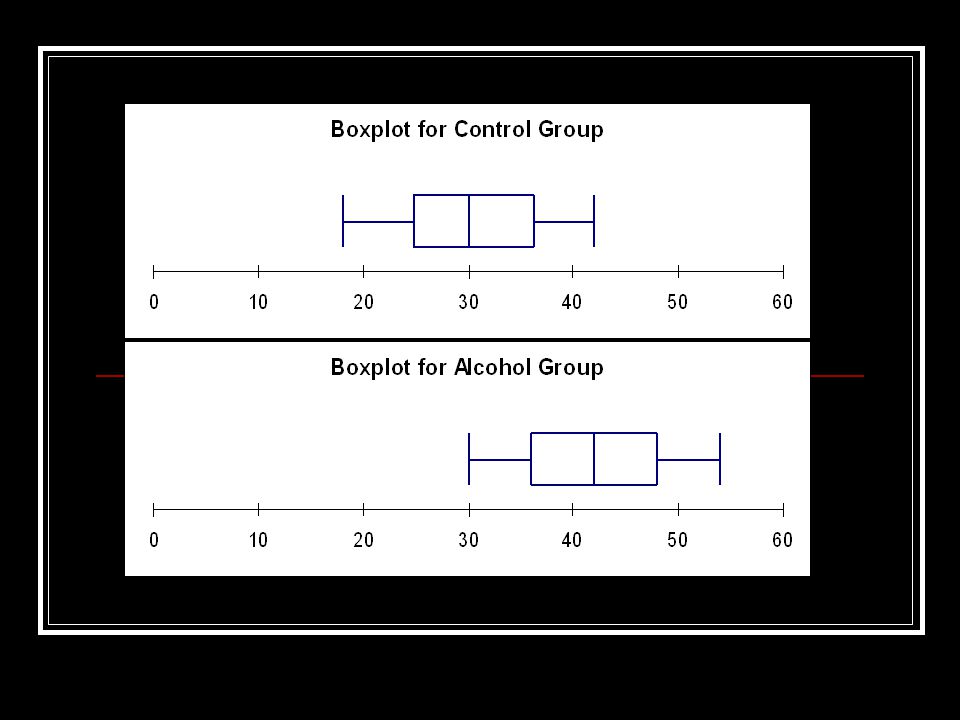
Measurement in Psychology We can use the information about a group of data to help determine the effect of a treatment. For example, imagine that a psychologist wished to measure the effect of alcohol on reaction times. Two groups of 28 participants are randomly selected into a treatment group and a control group.

20
Measurement in Psychology The control group are given orange juice and the treatment group are given orange juice with a measured amount of vodka added. After “treatment” both groups are given a reaction time test and the times are recorded.

21
Measurement in Psychology Within each group there is considerable variation and we need to make a reasonable measure of the effect of the alcohol. This variation comes about because of two main reasons. 1.The variation in the individual’s alertness and reaction. 2.The variation across the groups between the individuals.

22
Measurement in Psychology With all this potential “noise” in the system, how can we be sure that the effect is due to the treatment, or due to the chance factors associated with the other sources of variation.

23
Measurement in Psychology This is where we can make use of statistics to estimate how much of the effect is due to chance and how much can be attributed to the treatment.

24
Measurement in Psychology Five Number Summary Alcohol group Min.Q1MedQ3Max 3036424854 Five Number Summary Control group Min.Q1MedQ3Max 1824.753036.2542

25
Measurement in Psychology Mean Alcohol group = 42.1 Standard deviation = 7.1 Mean control group = 30.5 Standard deviation = 7.2 If we have normally distributed data, we expect that 95% of the data lies within two standard deviations of the mean, if the data are normally distributed. Thus we can get an idea of how much variation is brought about by chance.

27
Measurement in Psychology In this case, we can conclude that the difference is due to more than chance. In psychological research, we make use of a “test statistic” which determines the probability that the variation is due to chance.

28
Measurement in Psychology Thus, if the variation can be shown statistically to have a probability of less than 0.05 (p<0.05) to be due to chance alone, we generally accept that the treatment has had an effect. However, there is a 1 in 20 chance (0.05) that the effect may have been purely due to chance. Thus we can never be entirely sure and we must accept that our conclusion may be wrong.
 that the effect may have been purely due to chance. Thus we can never be entirely sure and we must accept that our conclusion may be wrong..")
29
Content analysis: We compress large amounts of data into a few categories. Become familiar with the transcripts – read and re- read Look for words, phrases and concepts central to the research question. Examine themes to find common ideas, differences and patterns Count how often these themes occur. Use more than one person to do the coding.

30
Measurement in Psychology Assignment for this week Page 38 Focus questions 1 – 12.

31
Measurement in Psychology

Similar presentations