Download presentation
Presentation is loading. Please wait.

1
Economics of Native America: The Current State and Basic Statistics

2
American Indian and Alaskan Native Population

3
Cities with Largest Number of Native Americans

4
Counties with Largest Percentage of Native Americans

5
American Indian Population by Residence

6
Largest Tribal Groups

7
19902000 Family Poverty Rate AIAN on Reservations47.3%35.6% AIAN in all Indian Areas38.1%28.7% AIAN U.S. wide27.0%21.8% All Races U.S. wide10.0%9.2% Child Poverty Rate AIAN on Reservations55.5%44.2% AIAN in all Indian Areas47.7%37.4% AIAN U.S. wide38.8%31.6% All Races U.S. wide18.3%16.6% Deep Poverty Rate (Proportion of people living at less than 75% of poverty level All races on Reservations18.7%16.8% All Races U.S. wide7.5%7.8% Source: U.S. Census Bureau, Census 1990 Summary Tape File 3

8
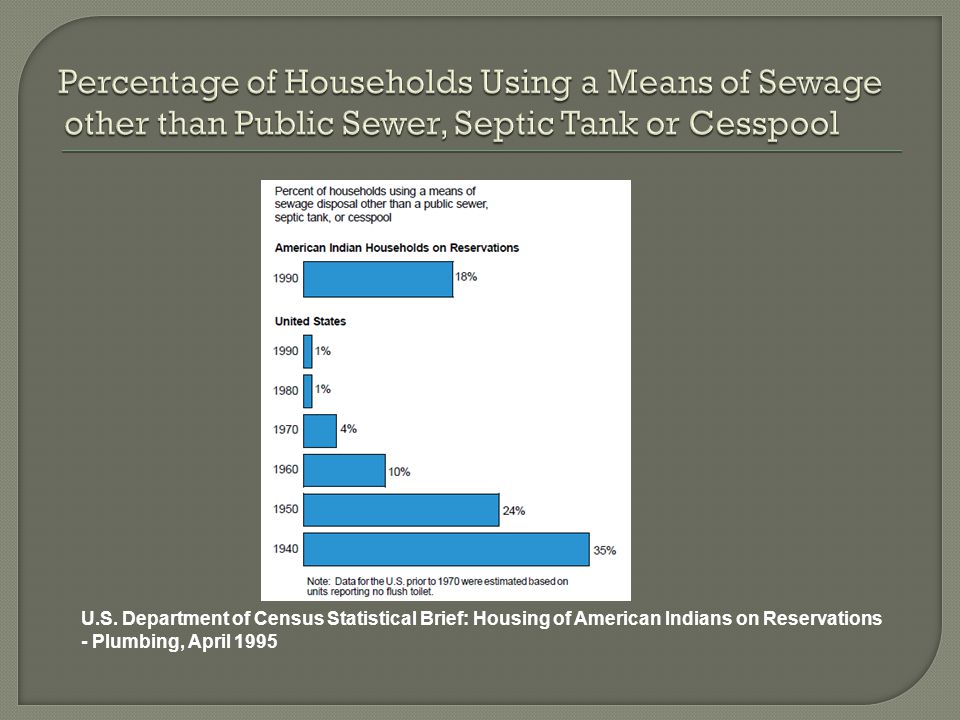
U.S. Department of Census Statistical Brief: Housing of American Indians on Reservations - Plumbing, April 1995

11
Percent Distribution of Population 25+ Source: Ogunwole, Stella “We the People: American Indians and Alaska Natives in the United States”, Census 2000 Special Reports February 2006

12
AI US Teen Birth Rate 8.4% 4.6% Low Birth Weights 6.8% 7.6% High Birth Weights 12.7% 10.3% Live Births Receiving Early Prenatal Care 68.8% 82.8% Infant Mortality Rate 95-97(#deaths under 1 yr/1,000 live births) 9.2 7.4 SIDS Death Rate 94-96(#deaths/100,000 live births) 204.0 87.1 Diabetes Mellitus (#/100,000 residential pop.) 29.6 13.6 Cirrohsis Deaths (#/100,000 residential pop.) 22.0 7.2 Suicide (#/100,000 residential pop.) 13.4 10.4 HIV Deaths (#/100,000 residential pop.) 2.2 4.6 Heart Disease (#/100,000 residential pop.) 97.1 126.6 Source: Piegan Institute, “Native America at the New Millenium” http://www.pieganinstitute.org/resources.html Public Health Stats 1998
 SIDS Death Rate 94-96(#deaths/100,000 live births) Diabetes Mellitus (#/100,000 residential pop.) Cirrohsis Deaths (#/100,000 residential pop.) Suicide (#/100,000 residential pop.) HIV Deaths (#/100,000 residential pop.) Heart Disease (#/100,000 residential pop.) Source: Piegan Institute, Native America at the New Millenium Public Health Stats 1998")
13
AI US Adult Incarceration 1997 (#in prison/1,000 resident pop) 8.7 6.3 Arrests 1998 (#/1,000 resident pop) 70.6 44.5 Juvenile Arrests 1998 (#/1,000 resident pop) 43.9 47.5 Teen Cigarette Use in Past Month (1999) 26.8% 14.9% Teen Alcohol Use in Past Month (1999) 21.0% 18.6% Teen Illicit Drug Use in Past Month (1999) 19.6% 10.9% Source: Piegan Institute, “Native America at the New Millenium” http://www.pieganinstitute.org/resources.html Crime/Drug Use Stats
 Arrests 1998 (#/1,000 resident pop) Juvenile Arrests 1998 (#/1,000 resident pop) Teen Cigarette Use in Past Month (1999) 26.8% 14.9% Teen Alcohol Use in Past Month (1999) 21.0% 18.6% Teen Illicit Drug Use in Past Month (1999) 19.6% 10.9% Source: Piegan Institute, Native America at the New Millenium Crime/Drug Use Stats")
14
Source: USDA, “Rural Poverty at a Glance” www.ers.usda.gov/publications/rdrr100/rdrr100.pdf Rural Areas & Poverty

15
Source: USDA, “Rural Poverty at a Glance” www.ers.usda.gov/publications/rdrr100/rdrr100.pdf Rural Vs. Urban

16
Source: USDA, “Rural Poverty at a Glance” www.ers.usda.gov/publications/rdrr100/rdrr100.pdf Poverty Rates by Race and Area

17
Source: USDA, “Rural Poverty at a Glance” www.ers.usda.gov/publications/rdrr100/rdrr100.pdf Poverty Rates by Household Type

18
Source: USDA, “Rural Poverty at a Glance” www.ers.usda.gov/publications/rdrr100/rdrr100.pdf Poverty Rates by County

19
Percentage of U.S. Coal Reserve30% Percentage of U.S. Uranium Deposits40% Percentage of U.S. Oil and Natural Gas Deposits4% Acres of Grazing Range 44,298,390 Number of natural lakes and ponds 5,770 Acres of developed oil, gas and mineral resources 765,706 Source: Patrick, Durham, “Snapshot of Indian Country” Native American Fish and Wildlife Society, June 18, 1999.

Similar presentations