Download presentation
Presentation is loading. Please wait.

1
Oregon Reading First Cohort B Regional Coaches’ Meeting October, 2005
Progress Monitoring Oregon Reading First Cohort B Regional Coaches’ Meeting October, 2005 © 2005 by the Oregon Reading First Center Center on Teaching and Learning

2
Cohort B, Regional Meeting Content Development
Content developed by: Carrie Thomas Beck Wayne Callender Rachell Katz Jeanie Mercier Smith Additional support: Katie Tate

3
Acknowledgments Oregon Department of Education Center for Teaching and Learning, College of Education, University of Oregon Early Childhood Research Institute on Measuring Growth and Development Select slides from this presentation were modified from the presentation entitled: Using DIBELS in an Outcomes Driven Model (Good, Kaminski, ReMillard, Ebmeyer, VanLoo, 2003) U.S. Department of Education, Office of Special Education Programs
 U.S. Department of Education, Office of Special Education Programs.")
4
Copyright All materials are protected by copyright and should not be reproduced or used without expressed permission of Dr. Carrie Thomas Beck, Oregon Reading First Center. Selected slides were reproduced from other sources and original references cited.

5
Reading First Initiative has Outlined Four Purposes for Assessment:
Outcome - Assessments that provide a bottom-line evaluation of the effectiveness of the reading program. Screening - Assessments that are administered to determine which children are at risk for reading difficulty and who will need additional intervention. Diagnosis - Assessments that help teachers plan instruction by providing in-depth information about students’ skills and instructional needs. Progress Monitoring - Assessments that determine if students are making adequate progress or need more intervention to achieve grade level reading outcomes.

6
DIBELS and the Purposes of Assessment
Diagnosis Not an objective of DIBELS May give direction for further assessment Progress Monitoring Sensitivity to growth and alternate forms allow frequent, ongoing monitoring Outcome DIBELS benchmark goals provide overall outcome criteria Screening Able to assess all children three times a year to identify at-risk students ** DIBELS is not the only assessment you need in reading. Schools/teachers should examine their current assessments and ask: What information do each of these assessments give us? How do we use the information? Is collecting the information easy and efficient? Can we modify it? Is the information redundant with another assessment? What information do we still need to know?

7
Progress Monitoring Repeated, formative assessment to evaluate progress toward important goals for the purpose of modifying instruction or intervention. Frequency of Progress Monitoring 3 times per year for students at low risk (All Students) Benchmark 1 per month for students with some risk Strategic 1 per every two weeks for students at risk Intensive
 Benchmark. 1 per month for students with some risk. Strategic. 1 per every two weeks for students at risk. Intensive.")
8
Effects of Progress Monitoring: Fuchs and Fuchs (1986)
Reading achievement was improved by… monitoring progress graphing progress adding decision rules setting ambitious goals

9
DIBELS Progress Monitoring Data Base Logistics

10
DIBELS Progress Monitoring Logistics
Progress Monitoring Materials Progress Monitoring Data System Selecting Students Selecting Measures (e.g., 1st Grade ORF for 3rd grade Student) Entering Scores Progress Monitoring Graphs/ Reports
 Entering Scores. Progress Monitoring Graphs/ Reports.")
11
Materials Materials for: 20 Alternate Forms per measure
ISF PSF NWF ORF (1st, 2nd, 3rd) (not LNF) 20 Alternate Forms per measure One booklet per measure One Student Materials per measure
 (not LNF) 20 Alternate Forms per measure. One booklet per measure. One Student Materials per measure.")
12
Progress Monitoring Data Base

13
Progress Monitoring Menu

14
Selecting Students

15
Selecting Students

16
Selecting Students

17
Entering Scores

18
Entering Scores

19
Selecting Out-of-Grade Measures
Two Methods of Entering “Out-of Grade” Measures When Selecting Class/Grade When Entering Data

20
Selecting Out-of-Grade Measures
Select Measure For ORF only: Choice of Grade Level

21
Viewing Graphs/ Reports

22
Viewing Graphs/ Reports
Select School, Year, Grade, and Type of Graph (Color or Black & White)
")
23
Progress Monitoring Graphs

24
DIBELS Progress Monitoring: Guidelines
Administer 2 measures at each time: 1. The measure for the goal that the student is currently working on, and 2. The measure for the next most difficult goal.

25
Guidelines: It is not necessary to progress monitor students on the Letter Naming Fluency (LNF) measure. LNF is primarily a measure of risk. Do not progress monitor first, second, or third graders on the Initial Sounds Fluency (ISF) measure unless the student bottoms out on the Phoneme Segmentation Fluency measure (e.g., scores less than 5).
 measure unless the student bottoms out on the Phoneme Segmentation Fluency measure (e.g., scores less than 5).")
26
Guidelines: Continue monitoring on ISF, PSF, and NWF until the student has met the benchmark goal for two consecutive data points. Once a student is progress monitored on ORF at his or her grade level, continue to monitor on ORF even after the student reaches the benchmark range.

27
Guidelines: When progress monitoring on ORF, select the grade level passages that will be sensitive to the instruction provided. It is only necessary to administer one passage each time a student is progress monitored on ORF. Once a student meets the benchmark range on a particular grade level passage (e.g., cwpm on first grade passages), then move the student up to the next grade level passages (e.g., second grade passages) and work on the corresponding benchmark goal (90 cwpm).
, then move the student up to the next grade level passages (e.g., second grade passages) and work on the corresponding benchmark goal (90 cwpm).")
28
Guidelines: Caution: If a student is being progress monitored using
ORF passages below grade level, it is critical to plan ahead to provide a schedule that will allow the student to close the gap as quickly as possible.

29
Guidelines: First Grade Example
First grade benchmark assessment in Fall measures LNF, PSF, and NWF (ORF will start in the Winter) On the Fall data collection, Fred scored 18 on PSF and 7 on NWF. Monitor on: PSF (goal he is currently working on) NWF (the next most difficult goal) As soon as Fred meets the goal for PSF (35 or more) on two consecutive data points, then monitor on NWF and ORF. Once Fred meets the NWF goal, then continue monitoring on ORF for the remainder of the year.
 On the Fall data collection, Fred scored 18 on PSF and 7 on NWF. Monitor on: PSF (goal he is currently working on) NWF (the next most difficult goal) As soon as Fred meets the goal for PSF (35 or more) on two consecutive data points, then monitor on NWF and ORF. Once Fred meets the NWF goal, then continue monitoring on ORF for the remainder of the year.")
30
Guidelines: Second Grade Example
In the Fall, Sarah scored 20 on NWF and 10 on ORF. Monitor on: 1. NWF (goal she is currently working on) 2. ORF* (next most difficult goal) *Monitor with first grade ORF passages so as to be sensitive to intervention. Note: It is probably a good idea to go back and check to see if your second graders made the benchmark for PSF. Look at Spring of first grade data. If student is not fluent on segmentation, you’ll want to provide some instruction on segmentation and thus monitor on PSF and NWF.
 2. ORF* (next most difficult goal) *Monitor with first grade ORF passages so as to be sensitive to intervention. Note: It is probably a good idea to go back and check to see if your second graders made the benchmark for PSF. Look at Spring of first grade data. If student is not fluent on segmentation, you’ll want to provide some instruction on segmentation and thus monitor on PSF and NWF.")
31
Guidelines: Third Grade Example
In the Fall DIBELS data collection, Kelsey scored 12 on ORF. Administer PSF and NWF to determine if Kelsey has met the benchmarks. Based on performance on PSF and NWF, select the two measures to monitor Kelsey on. Remember to begin with the first grade ORF passages if that is one of the goals you are monitoring her on. Place Kelsey in an intervention program that allows for acceleration and provide Kelsey with enough instructional time to make good lesson progress.

32
Guidelines: Third Grade Example
In the Fall DIBELS data collection, Les scored 50 on ORF. Administer NWF to determine if Les has met the benchmark. Progress monitor on NWF if necessary. If Les is placed in a second grade level of a decoding program, begin progress monitoring using second grade ORF passages.

33
Guidelines: Kindergarten Example
Kindergarten benchmark assessment in Fall measures LNF and ISF (PSF and NWF will start in the Winter) On the Fall data collection, Ginger scored 5 on ISF and has an intensive instructional recommendation. Monitor on: ISF (goal she is currently working on) PSF (the next most difficult goal) As soon as Ginger meets the goal for ISF (25 or more) on two consecutive data points, then monitor on PSF and NWF. Once Ginger meets the PSF goal, then continue monitoring on NWF for the remainder of the year.
 On the Fall data collection, Ginger scored 5 on ISF and has an intensive instructional recommendation. Monitor on: ISF (goal she is currently working on) PSF (the next most difficult goal) As soon as Ginger meets the goal for ISF (25 or more) on two consecutive data points, then monitor on PSF and NWF. Once Ginger meets the PSF goal, then continue monitoring on NWF for the remainder of the year.")
34
Let’s Try Some . . . Using the student data and grade level information on the DIBELS Progress Monitoring handout, determine which measures you would monitor each student on.

35
DIBELS Progress Monitoring Activity

36
“Easing In” to Progress Monitoring
With your ERT, develop a plan to begin progress monitoring students in October. It is not necessary to have a “full blown” progress monitoring system in place these first few months. Depending on the number of intensive students in your school, you may decide to monitor intensive students once a month to begin with. Similarly, you may decide to begin by monitoring strategic students once every 6 weeks. Depending on the numbers of intensive and strategic students in your school, you may decide to progress monitor on just one measure to begin with. Goal is to have a full progress monitoring system in place after the January DIBELS data collection.

37
Bringing Classroom Teachers and Specialists On Board
ORFC will be offering DIBELS administration training in the upcoming months (October, November, or December) to train classroom teachers and specialists to progress monitor. All teachers and specialists should be trained on DIBELS administration by January of 2006. Each classroom teacher should be progress monitoring at least 2-3 of the students in their reading group(s) to gain experience with the measures.
 to train classroom teachers and specialists to progress monitor. All teachers and specialists should be trained on DIBELS administration by January of Each classroom teacher should be progress monitoring at least 2-3 of the students in their reading group(s) to gain experience with the measures.")
38
How to Use Graphs to Summarize and Interpret Progress Monitoring Data
Why not use a Graph??! Wayne

39
Progress Monitoring Booklets

40
Benefits of Using a Graph
Creates a learning picture. Allows for decision making. Helps predict learning. Provides documentation. Makes data easier to interpret.

41
“What are major graphing conventions?”
vertical lines (dots) are week lines (Week 1, Week 2, Week 3, Week 4) thick vertical lines indicate a change in month horizontal lines (dots) are counting/data lines you must plot the junction of the week and the data on one dot shaded area indicates benchmark range baseline depicts performance before an intervention aimline tells you the expected rate of learning use a phase line when you make a change in the intervention of a goal The Y (vertical) axis depicts performance The X (horizontal) axis depicts time/categories/nominal data
 are week lines (Week 1, Week 2, Week 3, Week 4) thick vertical lines indicate a change in month. horizontal lines (dots) are counting/data lines. you must plot the junction of the week and the data on one dot. shaded area indicates benchmark range. baseline depicts performance before an intervention. aimline tells you the expected rate of learning. use a phase line when you make a change in the intervention of a goal. The Y (vertical) axis depicts performance. The X (horizontal) axis depicts time/categories/nominal data.")
42
Data Should Be: Stable Representative Three data points or more
Collected by a reliable assessment procedure Collected in a relatively short period of time Representative Teacher says it is “typical” Accurately reflects the student’s performance

43
Graphing the Baseline: Before Intervention

44
Validating Need for Support
Verify need for instructional support by retesting with alternate forms until we are reasonably confident. Phoneme Segmentation Fluency January cutoff Good, Kaminski, ReMillard, Ebmeyer & Van Loo, 2003

45
Exploring Support - What is an Aimline?
The aimline connects where you are to where you want to get to, and shows the course to follow to get there. Phoneme Segmentation Fluency Aimline Good, Kaminski, ReMillard, Ebmeyer & Van Loo, 2003

46
“What is a data decision rule?”
A decision rule is the systematic procedure by which patterns of data are analyzed. This data analysis assists in making a decision about the effectiveness of an intervention.

47
Why Decision Rules? How do you know when to continue or modify an intervention? Do you have unlimited time to continue with interventions that are not working? Are students growing at the necessary rate required to reach the DIBELS benchmark? Would you like to know which things work and which things don’t work for your students?

48
Applying the Decision Rule
Three data points are plotted and the number of data points above or below the aimline are used to determine if the individual is achieving as predicted. Administer 1 probe each week for 3 weeks or every other week until three data points are obtained. Each data collection period, plot your student’s newest score. This is a quick and easy method which reduces variability and eliminates the need for a trendline.

49
Data Decision Rules If three (3) consecutive data points are above the aimline, raise the criteria
 consecutive data points are above the aimline, raise the criteria")
50
Data Decision Rules If three (3) consecutive data points are below the aimline, change the intervention
 consecutive data points are below the aimline, change the intervention.")
51
Data Decision Rules If neither of the above rules apply, make no change

52
Things to consider in decision-making:
Focus on the question: “Will the individual reach his/her goal by the end of the goal period?” Decide to change an intervention whenever the rate of progress falls below the expectation. Think of changes to the intervention as fine tuning (alterable variables) rather than major reconstruction of interventions. Notes
 rather than major reconstruction of interventions. Notes.")
53
Changes in the intervention
Draw a phase line A phase line is drawn vertically on the graph to identify the beginning point where the intervention change occurs. Notes

54
Evaluating Support – Modify Instruction?
Whoops! Time to make a change! Phoneme Segmentation Fluency Aimline Good, Kaminski, ReMillard, Ebmeyer & Van Loo, 2003

55
Evaluating Support - Is Instructional Support Sufficient Now?
Phoneme Segmentation Fluency Aimline Good, Kaminski, ReMillard, Ebmeyer & Van Loo, 2003

56
DIBELS are the GPS for educators!
Phoneme Segmentation Fluency Aimline Good, Kaminski, ReMillard, Ebmeyer & Van Loo, 2003

57
Good, Kaminski, ReMillard, Ebmeyer & Van Loo, 2003
How am I doing? What course should I follow? Where is the port? Where are we? GPS On Port Desired Course You are Here Actual Course Good, Kaminski, ReMillard, Ebmeyer & Van Loo, 2003

58
Let’s Try One: Using the following information, set up a progress
monitoring graph for Tony (a second grader) on NWF: • Sept. Week 3 (DIBELS Baseline) = 12 • Draw in aimline. • Oct. Week 1 = 14 • Oct. Week 3 = 16 • Nov. Week 1 = 16 • Change Intervention? Add a phase line. • Nov. Week 3 = 20 • Dec. Week 1 = 28 • Dec. Week 3 = 40 • Is Tony on track now?
 on NWF: • Sept. Week 3 (DIBELS Baseline) = 12. • Draw in aimline. • Oct. Week 1 = 14. • Oct. Week 3 = 16. • Nov. Week 1 = 16. • Change Intervention Add a phase line. • Nov. Week 3 = 20. • Dec. Week 1 = 28. • Dec. Week 3 = 40. • Is Tony on track now")
59
Examples from Cohort A Coaches
What are some ways I can organize the progress monitoring data for my small groups? Examples from Cohort A Coaches

60
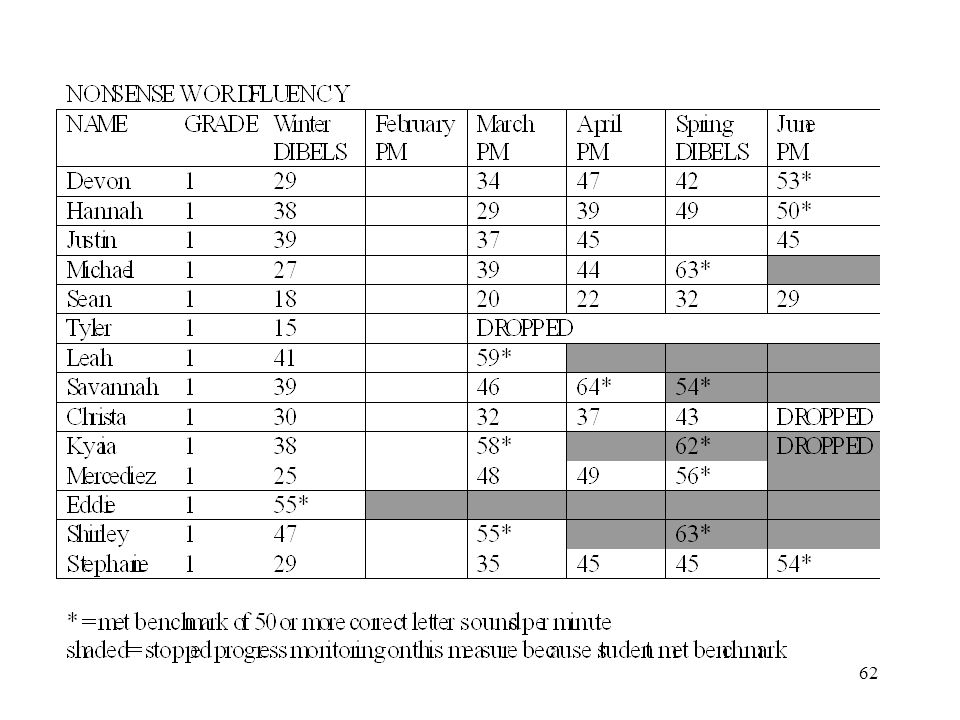
Third grade intensive progress monitoring
All in 1st grade HM last year. Sept to Jan this year in Read Well, now in 2nd grade HM. John being tested for sped.

64
Progress Monitoring - ORF and RTF
Oral Reading Fluency Progress Monitoring (with Retell Fluency) – Grades 1-3 Teacher: Progress Monitoring - ORF and RTF ORF RTF Name Who Monitor M 1 M 2 A 1 A 2
 – Grades 1-3. Teacher: Progress Monitoring - ORF and RTF. ORF. RTF. Name. Who Monitor. M 1. M 2. A 1. A 2.")
65
Kindergarten Progress Monitoring Example
Teacher: Progress Monitoring - ISF and PSF ISF PSF Name Who Monitor S 1 O 1 O 2 N 1 N 2 D 1 J 1 F 1 F 2 M 1 M 2 A 1 A 2

Similar presentations


>")


1 Oregon Reading First Webinar Data-based Action Planning Winter 2009.>")