Download presentation
Presentation is loading. Please wait.

1
RTI Data-based Decisions Marilyn Bechtel Psychologist/Elliott Elementary School Lincoln Public Schools July 30, 2007

2
LPS RTI Implementation Reading fluency K-2 Voluntary pilot schools – with principals’ approval 5 of 6 pilot schools had Title 1 services Central office leader is director of special education (now) Coordination through psychologists
 Coordination through psychologists")
3
Data-based decisions: Local norming Intervention planning Goal-setting Verification determination

4
Local Norms Establish local validity of DIBELS probes Determine local average rate of gain Provide local comparison with classroom assessments –DRA (Developmental Reading Assessment) –LRP (Leveled Reading Passages) –Report card rubrics
 –LRP (Leveled Reading Passages) –Report card rubrics")
5
Local Norms DIBELS – Dynamic Indicators of Early Literacy Skills: www.dibels.uoregon.eduwww.dibels.uoregon.edu Random sample 250 students/grade K-2 first year, then 3-5, then 6 Included all students in sample Established replacement protocol for students who moved Sampled 3 times/year during one-week window

6
1 st Grade DIBELS LPS Norms ScoreFall PercentileWinter PercentileSpring Percentile PSF NWFPSF NWF ORF 10 6 11 2 2 13 1 1 4 2013 31 4 6 36 1 4 17 3026 48 9 19 5110 14 25 4054 7032 40 6438 27 41 PSF = Phoneme Segmentation Fluency NWF = Nonsense Word Fluency ORF = Oral Reading Fluency

7
1 st Grade DIBELS LPS Norms ScoreFall PercentileWinter PercentileSpring Percentile PSF NWFPSF NWF ORF 10 6 11 2 2 13 1 1 4 2013 31 4 6 36 1 4 17 3026 48 9 19 5110 14 25 4054 7032 40 6438 27 41

8
First Grade Average Growth Fall to Winter –PSF =.58 phoneme/week –NWF = 1.20 grapheme/week Winter to Spring –PSF =.14 –NWF =.05 –ORF = 1.63 word/week Fall to Spring –PSF =.25 –NWF = 1.09

9
Intervention Planning Student A Percentiles: Winter PSF: 35 Winter NWF: 14 Winter ORF: 8 Intervention focus: Sound/symbol skills Student B Percentiles: Winter PSF: 35 Winter NWF: 35 Winter ORF: 8 Intervention focus: Sight words and fluency

10
Correspondence to Classroom Assessments – First Grade Proficiency 3 rd quarter report card: DRA 14-16 40 – 60 cwpm 4 th quarter report card: DRA 18 40 – 60 cwpm Winter benchmark: DIBELS graded probes 64 th – 73 rd percentile Spring benchmark: DIBELS graded probes 41 st – 54 th percentile

11
Correspondence to Classroom Assessments – Second Grade Proficiency 3 rd quarter report card: DRA 24 78 – 106 cwpm 4 th quarter report card: DRA 18 94 – 124 cwpm Winter benchmark: DIBELS graded probes 32 nd – 63 rd percentile Spring benchmark: DIBELS graded probes 35 th – 76 th percentile

12
So…who should receive RTI interventions? General guideline adopted by LPS: Consider those students at and below 20 th percentile. Example: a second grader who reads at or below 37 cwpm in the fall. Report card rubric: 53 – 82 cwpm at DRA 20 is proficient at first quarter. <40 cwpm at DRA 16 is “significantly below grade level”.

13
Things to consider: If resources are scarce, may limit interventions by grade (K-2) or other criteria. As resources grow, number of students in interventions may go up…criteria may change. Resources can grow. Spaghetti rule doesn’t apply.

14
Resource Continuum Individual Plans ---------------- Manualized Programs RTI Toolkit Sonday Flashcards Sound Partners Fluency practice Early Success Peer tutoring* Reading Mastery

15
Goal setting What do we want?

16
This?

17
Or this?

18
LPS Goal Rates RTI goal First grade: PSF1/week NWF2/week All grades: ORF2.5/week Average from Norms First grade: PSF.25/week NWF1.09/week 1 st grade winter/spring: ORF1.63/week 2 nd grade fall/spring: ORF1.02/week

19
What it takes…

20
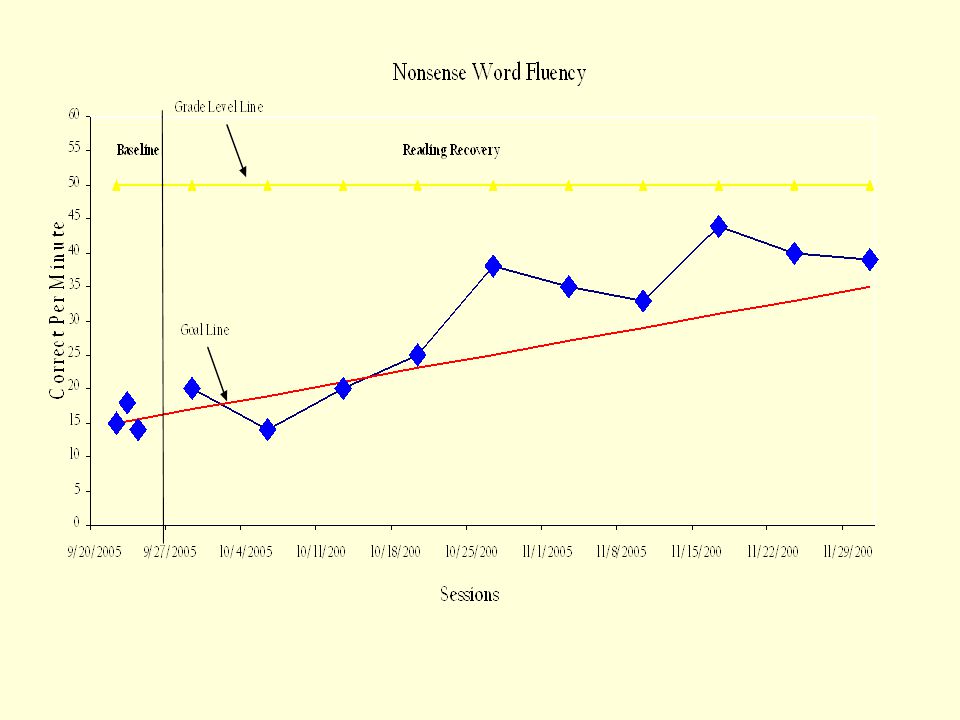
Individual student profile Individual Baseline – can be benchmark only if within 1 week Administer 3 probes. Use median score as baseline. Apply goal criteria to graph goal line. Monitor weekly with one probe. Can do manually or by using Excel, Chartdog on www.InterventionCentral.org.

23
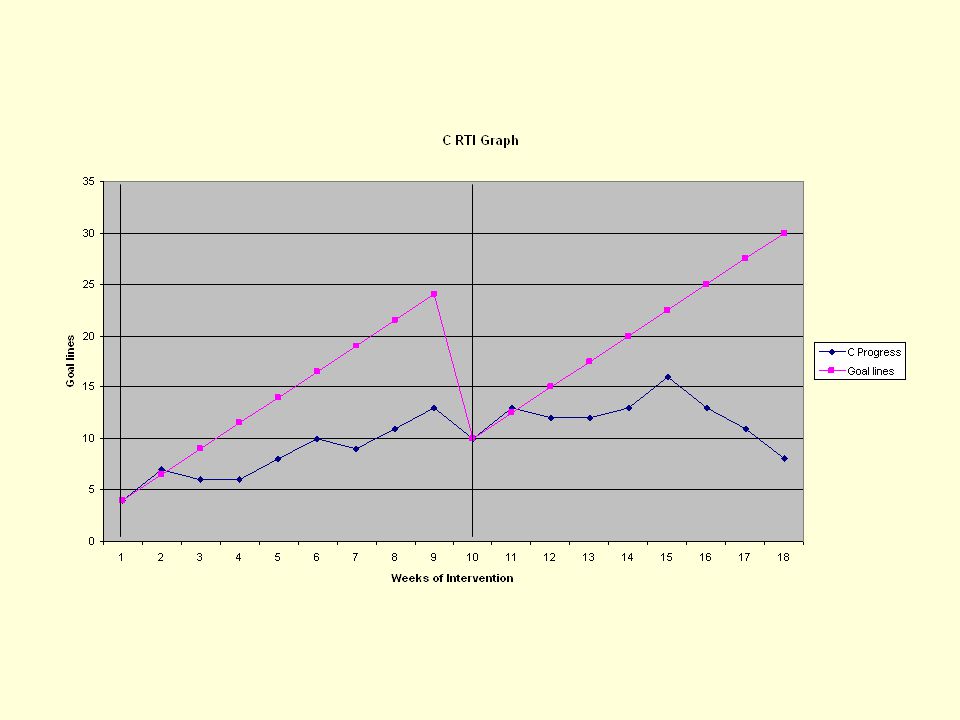
Verification Determination RTI method requires a dual discrepancy model for determining need. –Progress compared to self (meeting goal?) Students who complete at least two 8-week interventions and do not meet goals –Progress compared to peers Students who are at or below 12 th percentile
 Students who complete at least two 8-week interventions and do not meet goals –Progress compared to peers Students who are at or below 12 th percentile.")
24
Dual discrepancy Students who do not make adequate progress may: –Be considered for another intervention –Continue the intervention with or without modifications –Be considered for additional special services, including special education verification as a student with a learning disability in the area of reading fluency or basic reading skills

25
Case Example: Second grade student this year First grade: Reading Recovery*, computer-assisted learning program, volunteers who did individualized, integrated reading. *only RTI intervention Sonday this year for 15 weeks (small group), then Sound Partners (individual) for 12 weeks.
, then Sound Partners (individual) for 12 weeks..")
27
ELL Student Example: Enrolled in February from out of state with SLI verification: artic. and language goals Evaluated in first grade. Did not meet guidelines in any area. –UNIT SS = 108 –BVAT = 75 –CELF/Spanish = 90 Teacher very concerned about reading, DRA 3 (kindergarten level at end of first grade). Received services from SLP for rest of first grade.
. Received services from SLP for rest of first grade..")
28
ELL Example cont’d In second grade: Sonday from ELL teacher for 15 weeks. Sound Partners from 3 interventionists for 15 weeks. Extra practice in fluency and sight words from another ELL teacher (not considered separate RTI intervention).
..")
30
Verification decision Both these students were verified SLD/reading at the end of the year LPS’ RTI protocol was followed in addition to data management: –Parent permission at start of last intervention –Procedural checklist (available from website) –Integrity checks
 –Integrity checks")
31
RTI data pluses: Ongoing intervention system for students who need it…no need to fail over and over Data from multiple sources that is timely, relevant to local population, sensitive to small changes, easy to interpret, correlates to classroom and other assessments Parent and staff friendly Helps buildings/districts identify and strengthen need areas

32
Future plans Behavior – pilot this fall Math – small pilot in progress Writing – norming in progress, small pilot programs this year Reading comprehension – pilot in progress in elementary and middle schools…will help with norming issues ELL data analysis

Similar presentations


 Lindenhurst Schools>")


