Download presentation
Presentation is loading. Please wait.

1
Cross Validation of Thermal Infrared Remotely Sensed Data In-Flight Using Automated Validation Sites © 2010 California Institute of Technology. Government sponsorship acknowledged. Dr Simon J. Hook William Johnson, Robert Radocinski, Glynn Hulley Jet Propulsion Laboratory, California Institute of Technology.

2
Outline Location and Characteristics –Lake Tahoe, CA/NV –Salton Sea, CA Measurements and Field Radiometer Calibration Data Reduction Methodology and Error Budgets Results from various sensors –MODIS, ASTER, Landsat Summary and Conclusions

3
Why Lake Tahoe? Large 35 km x 16 km High 2 km Available year round (does not freeze in winter). Homogenous compared with land. Large annual temperature range 5-25 C. Freshwater (kind to instruments!) Good infrastructure and easy access.
 Good infrastructure and easy access..")
4
2000-09-20-D

5
Measurements Offshore –bulk temperature, skin temperature, air temperature, wind speed, wind direction, relative humidity, net radiation. Onshore –air temperature, wind speed, wind direction, relative humidity, short and longwave radiation (up and down), sky imager, aerosols, total column water.
, sky imager, aerosols, total column water..")
6
Site Layout and Measurement Stations

7
TB3 Installed 11-04-2002 Skin temperature Air temperature & Rel. Humidity Wind Speed & Direction Logging System Batteries Bulk Water Temperature 3m

8
8 Salton Sea, Platform Temperatures up to 35 C!

9
9 Radiometer Calibration and Cross-Cal

10
10 Cross Comparison of Radiometers at Miami JPL Rad

11
Data Reduction: Methodology For Radiance at Sensor Validation Extract the bulk temperatures. Extract the radiometric temperature. Correct the radiometric temperature to skin kinetic temperature. Propagate the skin temperature to the satellite using a radiative transfer model and interpolated atmospheric profile. Convolve the propagated at-sensor radiance to the instrument response function to obtain the Vicarious Radiance (VR). Extract the image radiance derived using the On Board calibrator (OBC). Compare and contrast the OBC and VR Radiance values.
. Extract the image radiance derived using the On Board calibrator (OBC). Compare and contrast the OBC and VR Radiance values..")
12
Error Budgets PerturbationKinetic Temperature (degrees C)Difference from no perturbation (degrees C) None5.63420.76200 90% Water Vapor5.64020.7670.0060.005 110% Water Vapor5.62820.758-0.006-0.005 -1 deg C5.64020.7670.0060.005 +1 deg C5.62820.758-0.006-0.005 Ozone Factor 50%5.64020.7670.0060.005 Ozone factor 150%5.62920.759-0.005-0.004 -0.5 um SRF shift5.56120.717-0.073-0.045 +0.5 um SRF shift5.67320.8150.0390.053 Change from Nominal Temperature in Kelvin Channel 14 (center 8.55 um) Channel 15 (center 10.763) Channel 16 (center 12.013) 90% Water Vapor0.1490.0940.159 110% Water Vapor-0.146-0.100-0.167 -1 deg C-0.062-0.028-0.049 +1 deg C0.0640.0280.049 50% Ozone0.2490.0470.012 150% Ozone-0.241-0.041-0.011 50% Visibility (11.5 km)-0.323-0.284-0.235 150% Visibility (34.5 km)0.1130.0950.080 -0.5 um SRF shift-0.041-0.043-0.042 +0.5 um SRF shift0.0480.0510.049
Difference from no perturbation (degrees C) None % Water Vapor % Water Vapor deg C deg C Ozone Factor 50% Ozone factor 150% um SRF shift um SRF shift Change from Nominal Temperature in Kelvin Channel 14 (center 8.55 um) Channel 15 (center ) Channel 16 (center ) 90% Water Vapor % Water Vapor deg C deg C % Ozone % Ozone % Visibility (11.5 km) % Visibility (34.5 km) um SRF shift um SRF shift")
13
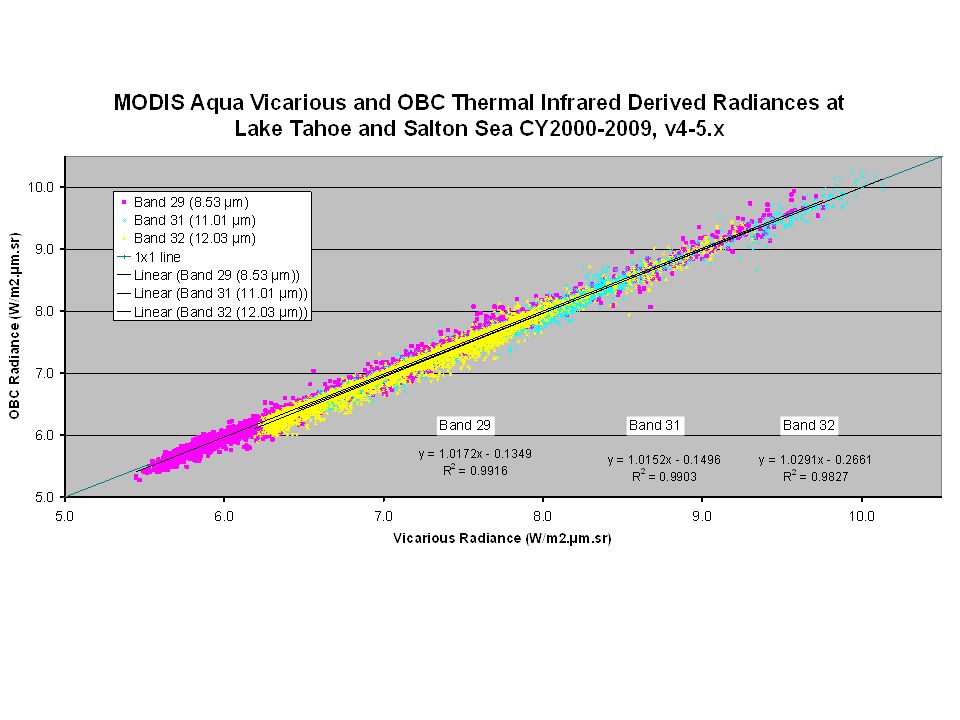
Several hundred matchups per year. MODIS OBC radiance agrees with Vicarious radiance in clear parts of spectrum

14
MODIS land and water bands show excellent agreement with vicarious radiance. R2 typically 0.99

15
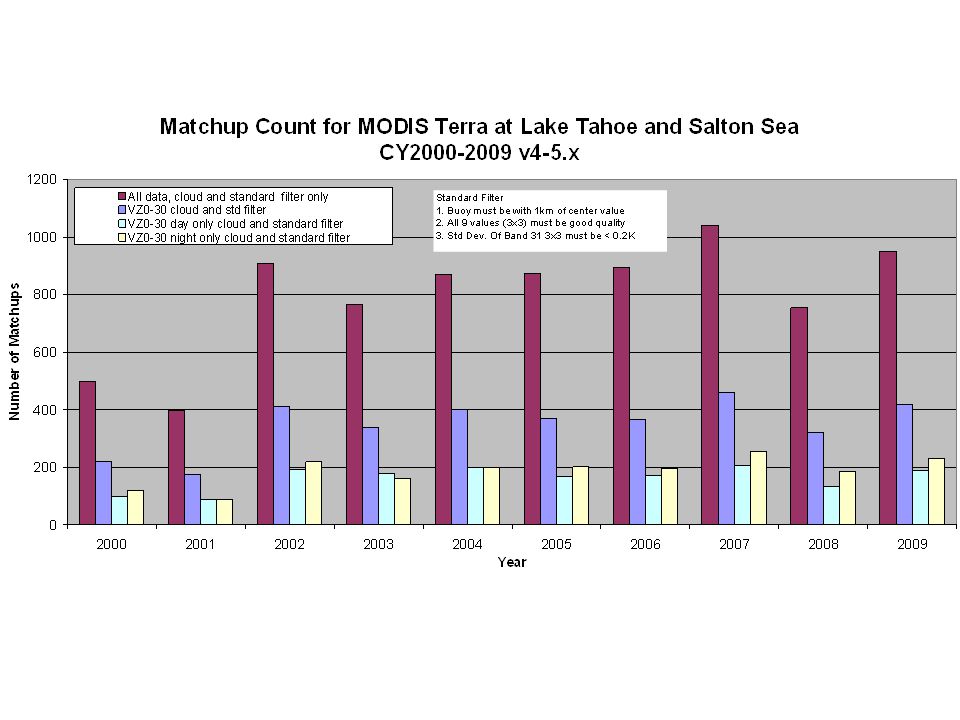
Validation process works well for angles up to 30 degrees off nadir

16
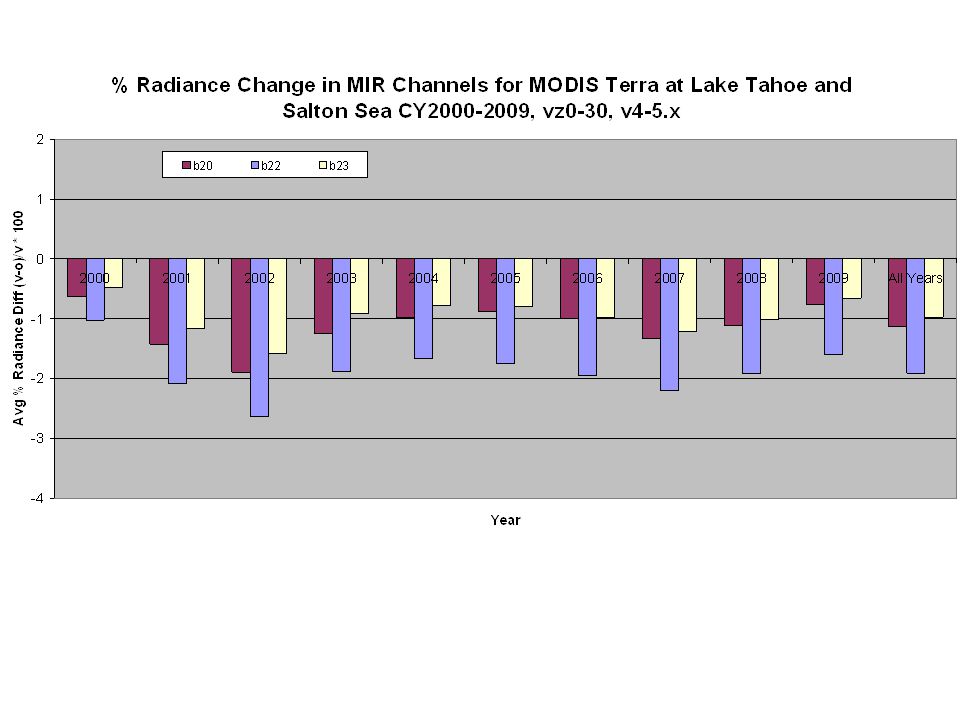
10 years of validation! Values for each year from several hundred matchups. MODIS-Terra has performed within specification for duration of mission. Proof necessary for climate change studies

17
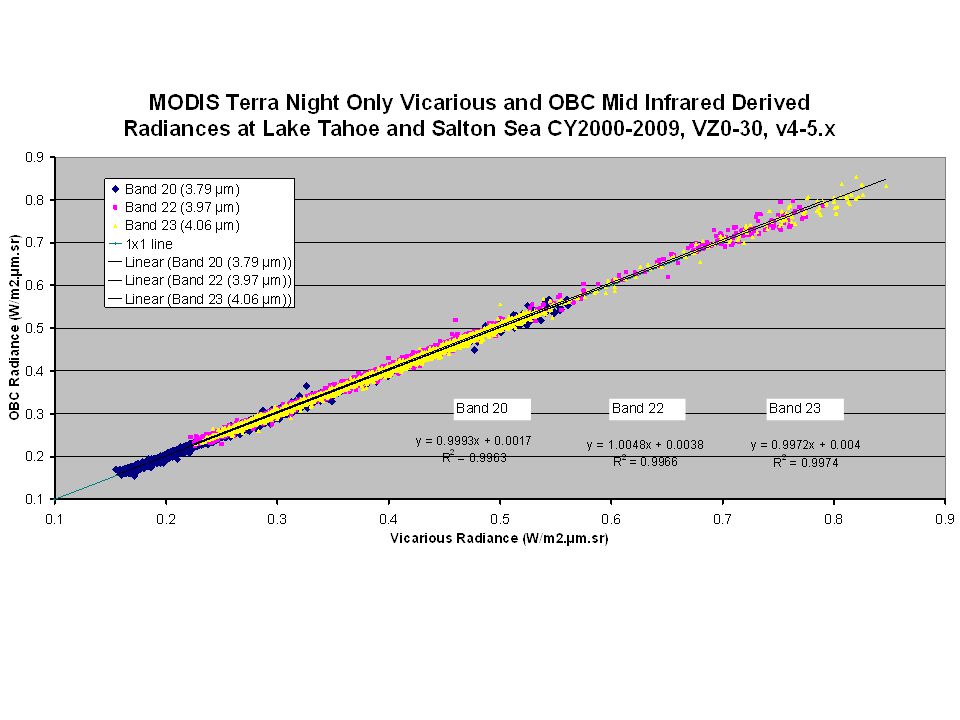
Validation measurements are made 24x7, validate mid infrared (3-5 um) at night to avoid reflected solar. Results shown for Aqua

18
Aqua MIR performance meets preflight specification

19
ASTER Short and Long-Term Calibration ASTER calibrates when instrument drifts. Introduces “sawtooth” appearance For much of mission predictable behavior but recently showed more rapid change

20
ASTER Short and Long-Term Calibration More frequent drift corrections now required and additional monitoring

21
If carefully monitor and correct can maintain instrument within specification, If look at mean radiance differences for each year they are typically less than 0.5% or 0.3K. 2005 and 2006 need more examination.

22
22 High temperature points from Salton Sea allow evaluation of gain and offset. Landsat required gain and offset adjustment

23
2009-12-0223 After adjustment Landsat 7 meets specification

24
Summary and Conclusions Established an automated site for validating thermal infrared data at Lake Tahoe CA/NV. Site has been operating since 1999. Second site established at Salton Sea CA in 2008. Salton Sea provides very high temperatures. Measurements made at the site include skin- bulk- air- temperature, wind speed, wind direction and net radiation at multiple locations every 2 minutes. Multiple locations (4 buoys) allow validation of several points within a scene at Lake Tahoe. Validated data from multiple instruments including, ATSR2, AATSR, ASTER, MODIS (Terra, Aqua), Landsat 5 and Landsat ETM+, MTI. Results so far indicate: –MODIS-Terra and Aqua LWIR meet specification (no bias, abs. acc. ± 0.2K) –MODIS-Aqua MIR meet specification (Terra MIR does not) –ASTER, Landsat require adjustment but perform to specification In-flight validation is a necessity for climate studies!
 allow validation of several points within a scene at Lake Tahoe. Validated data from multiple instruments including, ATSR2, AATSR, ASTER, MODIS (Terra, Aqua), Landsat 5 and Landsat ETM+, MTI. Results so far indicate: –MODIS-Terra and Aqua LWIR meet specification (no bias, abs. acc. ± 0.2K) –MODIS-Aqua MIR meet specification (Terra MIR does not) –ASTER, Landsat require adjustment but perform to specification In-flight validation is a necessity for climate studies!.")
25
http://calval.jpl.nasa.gov
26
Backup

27
Mirror AOI related to scan angle, validation process works well for angles up to 30 degrees off nadir

28
8 years of validation! Values for each year from several hundred matchups. MODIS-Aqua has performed within specification for duration of mission. Proof necessary for climate change studies

30
Skin Effect After Minnett et al. 2000 Water surface

35
2009-12-0235 Similar issue with Landsat 5. After adjustment Landsat 5 meets specification. Landsat 5 data are slightly noisier than Landsat 7

37
37 Cross Comparison of Radiometers at Miami

38
38 Means and standard deviations of the estimated skin SST differences between pairs of radiometers for the entire cruise period, and for each half of the cruise The Third International Infrared Radiometer Workshop to be held in Miami in the late spring of 2009

39
39 Variations in the bulk-, skin-, air-temperatures and wind speed on June 7, 2001 at L. Tahoe

40
40 Land Surface Temperature Results MODIS, ASTER, AATSR

41
BACKUP

Similar presentations


.>")
, Sherwin Ladner (2), Giulietta Fargion (3), Paul.>")


