Download presentation
Presentation is loading. Please wait.

1
Automated Financial Analysis Solvency Tools
David A. Vacca, CPA Assistant Director Insurance Analysis & Information Services Department For Regulators Only © 2009 The National Association of Insurance Commissioners All Rights Reserved

2
Presentation Overview
Overview of Financial Analysis Solvency Tools Databases Serving Other Purposes For Regulators Only © 2009 The National Association of Insurance Commissioners All Rights Reserved

3
Confidential - Regulator Only
NAIC Databases Financial Data Repository (FDR) Exam Tracking System (Financial and Market) Complaints Special Activities Producer database Change of Control (Form A) Regulator Actions Valuation of Securities Confidential - Regulator Only
 Exam Tracking System (Financial and Market) Complaints. Special Activities. Producer database. Change of Control (Form A) Regulator Actions. Valuation of Securities. Confidential - Regulator Only.")
4
Financial Analysis Solvency Tools
Collection of automated solvency tools designed to provide an integrated approach to screening and analyzing the financial condition of insurers Financial Analysis Solvency Tools (FAST) Navigation Tools Notification Tools Analytical Tools Prioritization Tools Adhoc Reporting For Regulators Only © 2009 The National Association of Insurance Commissioners All Rights Reserved
 Navigation Tools. Notification Tools. Analytical Tools. Prioritization Tools. Adhoc Reporting. For Regulators Only. © 2009 The National Association of Insurance Commissioners All Rights Reserved.")
5
Tools and Resources NAIC I-SITE & StateNet Prioritization Tools
Analytical Tools Summary Reports Databases

6
Navigation Tools For Regulators Only

7
Number of Insurers Filing to the NAIC
For Regulators Only © 2009 The National Association of Insurance Commissioners All Rights Reserved 7

9
Confidential - Regulator Only
Electronic Filing - PDFs Confidential - Regulator Only © 2009 The National Association of Insurance Commissioners All Rights Reserved

10
Confidential - Regulator Only
© 2009 The National Association of Insurance Commissioners All Rights Reserved

11
Confidential - Regulator Only
Pick-A-Page Selection and print capabilities of any financial or demographic information that comes from the annual/quarterly statements filed by insurance companies with the NAIC Confidential - Regulator Only

12
Confidential - Regulator Only
Pick-A-Page Confidential - Regulator Only

13
Confidential - Regulator Only

14
Confidential - Regulator Only
Line Reports Allow users to compare one line from the annual statement with a group of companies matching the selected criteria (w/ statement type) Confidential - Regulator Only
 Confidential - Regulator Only.")
15
Line Report Example

16
Line Report Example

17
Confidential - Regulator Only
Company Demographics Confidential - Regulator Only

18
Confidential - Regulator Only

19
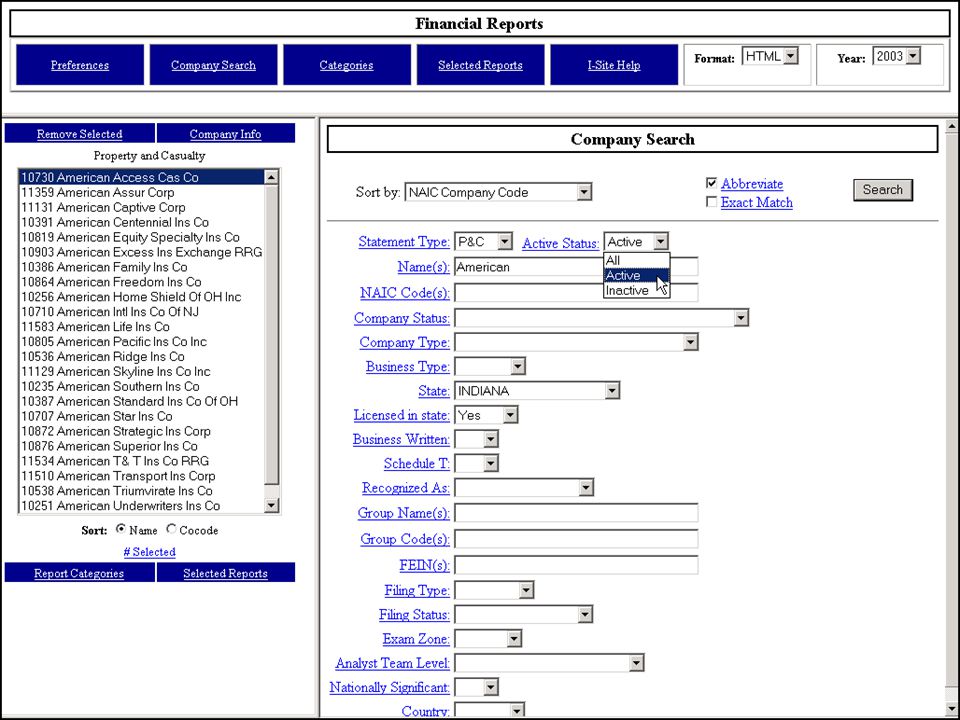
Preferences

20
Confidential - Regulator Only
Validation Exceptions Confidential - Regulator Only

21
Confidential - Regulator Only

22
MyNAIC Portal

23
Confidential - Regulator Only
Notification Tools Confidential - Regulator Only

24
Personalized Information Capture System (PICS)
Push technology Create profile Specify criteria s generated when data changes for companies/individuals that fit into the criteria specified Confidential - Regulator Only

25
Confidential - Regulator Only
Notification Tools Confidential - Regulator Only © 2009 The National Association of Insurance Commissioners All Rights Reserved

26
Confidential - Regulator Only
PICS notifications go directly to your mail inbox Confidential - Regulator Only

27
Confidential - Regulator Only

28
Analytical Tools For Regulators Only

29
NAIC Financial Analysis Handbook
Provides a uniform means for insurance departments to more diligently identify companies experiencing financial problems or that pose the greatest potential for developing financial problems Provides guidance for the insurance departments to define and evaluate particular areas of concern in troubled companies Updated annually Confidential – Regulator Only © 2009 The National Association of Insurance Commissioners All Rights Reserved

30
FAH

31
FAH

32
Financial Analysis Handbook Summary Report
For Regulators Only © 2009 The National Association of Insurance Commissioners All Rights Reserved

33
Financial Profile Reports
The Financial Profile Report is a summary of key financial information for a company over the last five years Includes a Financial Summary page There are also detailed sections for: Assets, Liabilities, Capital & Surplus, Loss & LAE Reserve Analysis, Income Statement, Cash Flow and Exhibit of Business and Profitability

34
Trend and Ratio Analysis by Insurer
For Regulators Only © 2009 The National Association of Insurance Commissioners All Rights Reserved

35
Automated Graphs by Insurer
For Regulators Only

36
Profile: Peer Analysis Report
Release for Annual 2007 – Life/Health Released for Annual 2009 – Property/Casualty Profile defines 10 peer companies based on: Line of Business Number of States Writing Business Geographic considerations Closest Asset or Premium Size Profile provides financial data and ratio analysis for 10 peer companies

37
P&C Peer Analysis Profile
For Regulators Only © 2009 The National Association of Insurance Commissioners All Rights Reserved

38
Loss Reserve Projection
For Regulators Only © 2009 The National Association of Insurance Commissioners All Rights Reserved

39
Exam Jumpstart Analyzes the investment schedules data as compared to SVO VOS database or NRSRO feeds and provides summary of potential errors CUSIPs Rates Designations / market value Assumed and Ceded Reinsurance

40
Percentage of Valuation Discrepancies Analysis

41
Prioritization Tools For Regulators Only

42
IRIS Ratio 13 ratios for Property/Casualty Overall Profitability
Liquidity Reserve 12 ratios for Life and Health 11 ratios for Fraternal Asterisks highlight ratios outside usual range

43
IRIS Ratios Ratio Analysis
Evaluate the ratio results by analyzing each component of the calculation Understand the industry average in relation to the company’s result Understand the company’s historical results and put them in context

44
IRIS Ratios (P&C) Gross Prem. Written/Surplus
Net Prem. Written/Surplus Chg. in Net Writings Surplus Aid/Surplus Two-Year Overall Operating Ratio Investment Yield Gross Chg. in Surplus Net Chg. in Surplus Liabilities to Liquid Assets Gross Agents’ Balances/Surplus One-Year Reserve Development/Surplus Two-Year Reserve Development/Surplus Estimated Current Reserve Deficiency/Surplus

45
IRIS Ratios (L&H) Net Change in C&S Gross Change in C&S
Net Income to Total Income Adequacy of Investment Income Non-Admitted to Admitted Assets Total Real Estate & Mortgages to Cash & Invested Assets Total Affiliated Investments to C&S Surplus Relief Change in Premiums Change in Product Mix Change in Asset Risk Change in Reserving Ratio

46
IRIS Ratios For Regulators Only
© 2009 The National Association of Insurance Commissioners All Rights Reserved

47
Prioritizations Tools - IRIS (Only public tool)
Confidential – Regulator Only © 2009 The National Association of Insurance Commissioners All Rights Reserved

48
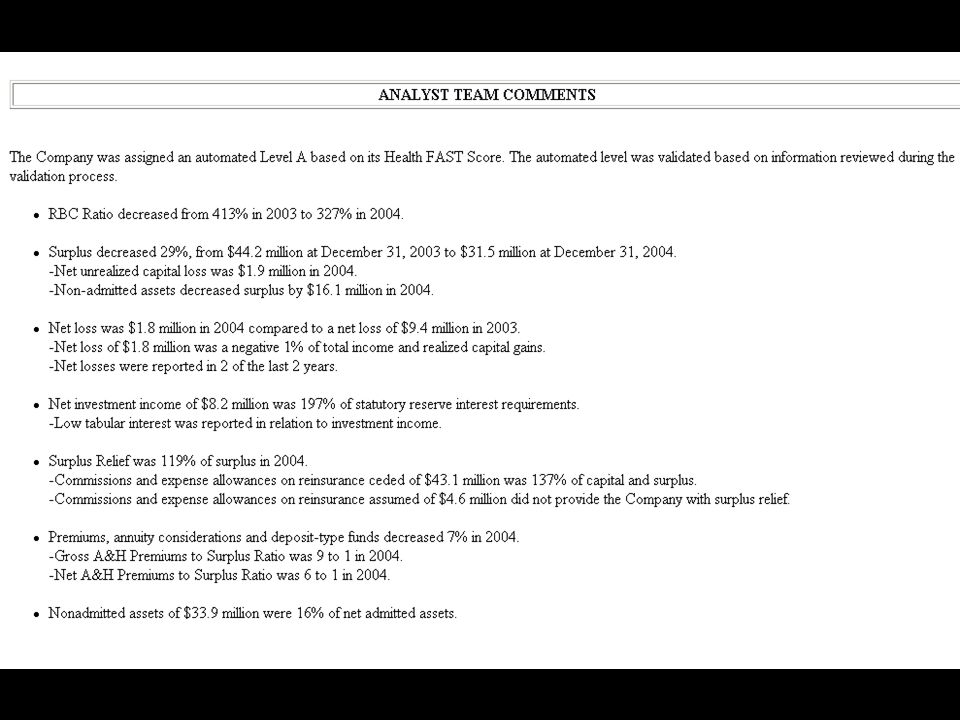
Analyst Team System (ATS)
Available for P&C, Life, Health and Fraternal Automated review system that uses statistical analysis, FAST Scores, RBC to assign review levels Level A – High level of concern Level B – Requires attention No level required Confirmed by team of State financial analysts and examiners ATS Reports Analyst Team Comments and Summary of Criteria

50
Adhoc Summary Tools For Regulators Only

51
Timely Industry Data

52
Market Share Data

53
Example of Lead State Report

54
Summary Reports Aggregate Line of Business by State
For Regulators Only

55
2010 Foreign Exposures Bonds Common Stock Preferred Stock Total Canada
107,258,924,947 2,797,033,029 102,720,957 110,158,678,933 United Kingdom 75,260,217,980 14,088,268,833 304,893,974 89,653,380,787 Australia 47,217,472,486 968,525,319 1,090,047 48,187,087,852 Japan 44,692,346,938 1,728,086,885 804,703 46,421,238,526 Netherlands 38,799,783,554 738,047,836 162,105,126 39,699,936,516 Cayman Islands 36,240,026,378 387,264,978 1,065,155,396 37,692,446,752 France 22,287,938,985 952,305,774 985,055 23,241,229,814 Luxembourg 19,801,806,241 350,112,961 786,744,995 20,938,664,197 Bermuda 13,224,942,328 6,244,860,443 419,553,675 19,889,356,446 Germany 12,728,799,616 537,539,479 60,627,058 13,326,966,153 Ten Largest 417,512,259,453 28,792,045,537 2,904,680,986 449,208,985,976 Pct of Total Foreign 78.3% 76.5% 93.3% 78.2%

56
Exposure to Portugal, Italy, Ireland, Greece and Spain
Bonds Common Stock Preferred Stock Total Portugal 820,986,517 10,128,159 831,114,676 Italy 2,299,649,997 127,709,987 2,427,359,984 Ireland 9,483,497,840 1,198,190,566 24,872,118 10,706,560,524 Greece 1,160,356,800 7,220,451 142,000 1, ,251 Spain 6.371,857,588 200,008,446 88,145,795 6,660,011,829 20,136,348,742 1,543,257,609 113,159,913 21,792,766,264

57
Databases Serving Other Purposes
For Regulators Only

58
Consumer Information Source - CIS
Consumer Information Source (CIS) provides information about insurance companies to the general public. Anyone can access key information about insurance companies, by entering the company name and state. Information provided: Closed insurance complaints Licensing information Key financial data Available via a link from the NAIC home page! For Regulators Only © 2009 The National Association of Insurance Commissioners All Rights Reserved
 provides information about insurance companies to the general public. Anyone can access key information about insurance companies, by entering the company name and state. Information provided: Closed insurance complaints. Licensing information. Key financial data. Available via a link from the NAIC home page! For Regulators Only. © 2009 The National Association of Insurance Commissioners All Rights Reserved.")
59
CIS – Financial Profile
Company Demographic Information Direct Premium Written By Line of Business Invested Asset Mix Three-Year Net Premiums Written Three-Year Policyholders’ Surplus Trend Three-Year Income/Loss Trend For Regulators Only © 2009 The National Association of Insurance Commissioners All Rights Reserved

60
Questions Please contact David Vacca at or for questions For Regulators Only

Similar presentations