Download presentation
Presentation is loading. Please wait.

1
AIR PRESSURE FORCES AND WIND

2
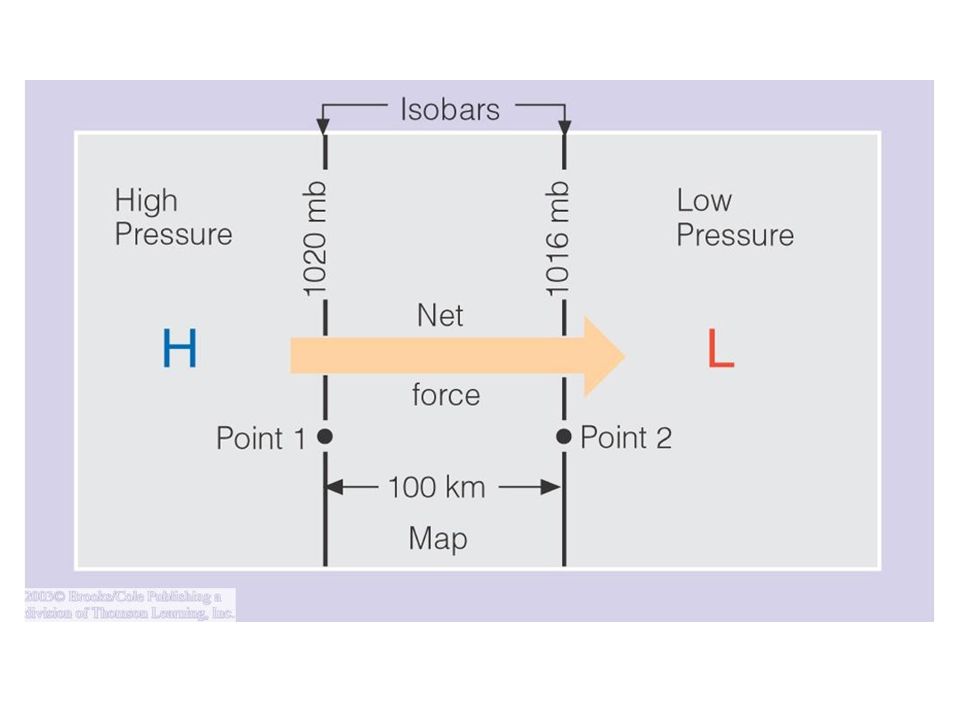
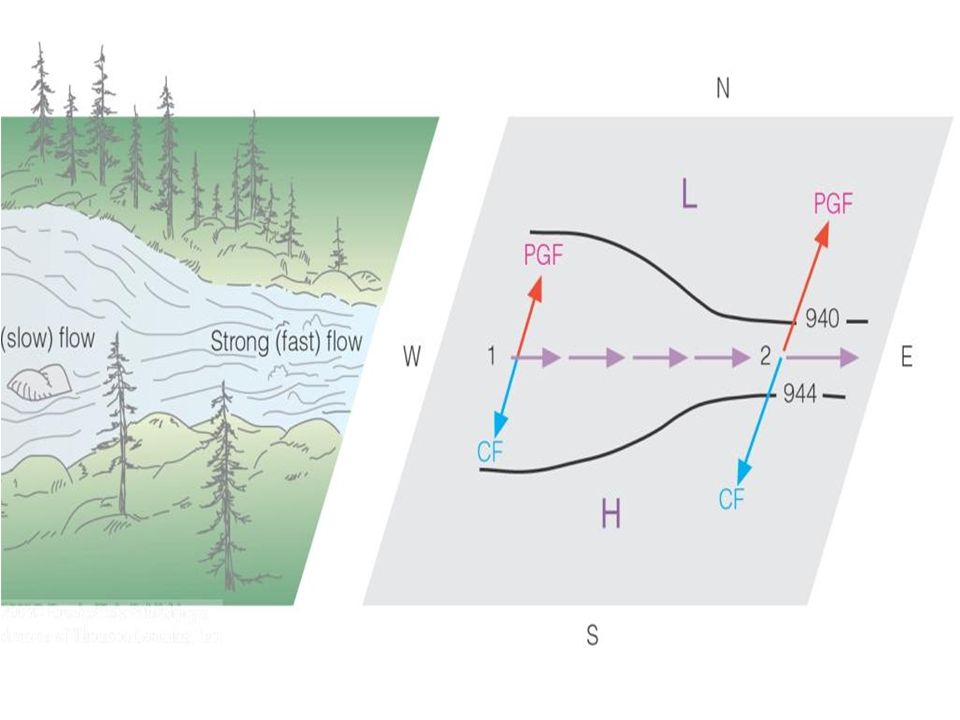
HL 102.299.8 101.4100.6 600 km Pressure Gradient Force= 2.4 kPa / 600 km = 0.4 kPa / 100 km Definition: The difference in atmospheric pressure per unit distance PGF acts at right angles to isobars of equal pressure

4
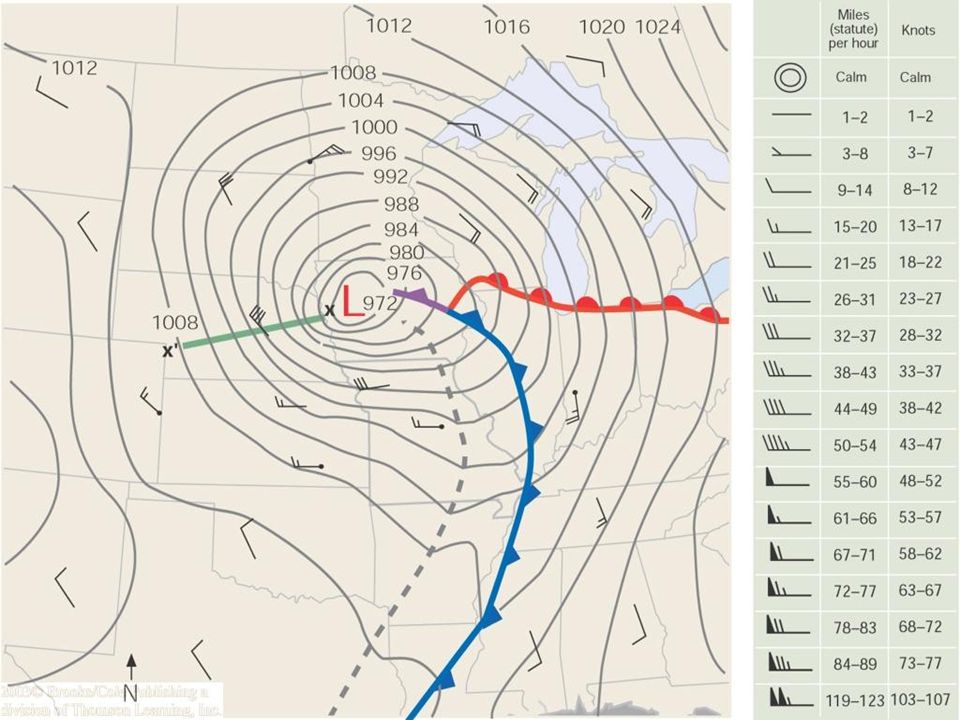
Where are winds strongest ? Oct 18, 2004 Solution: HUDSON BAY Check the spacing of the isobars of equal surface pressure

5
Source: NASA

6
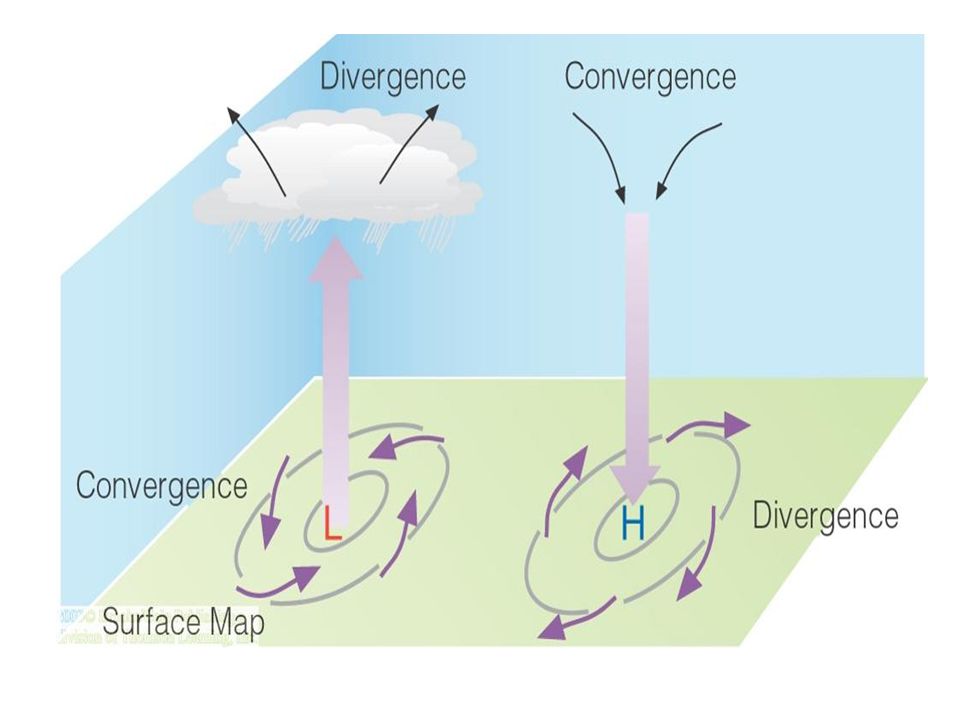
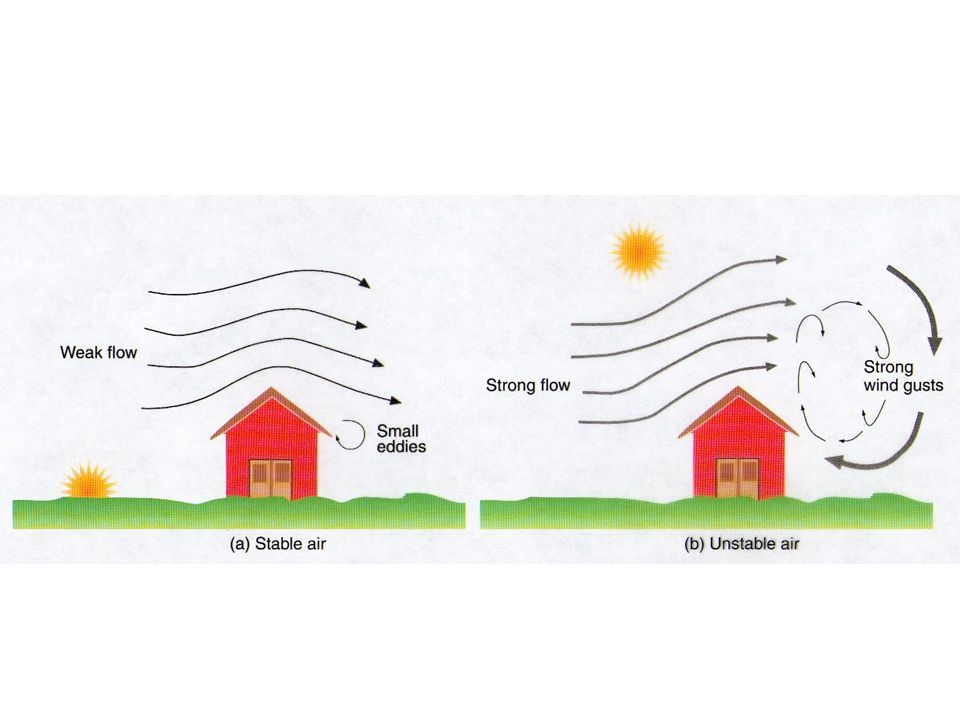
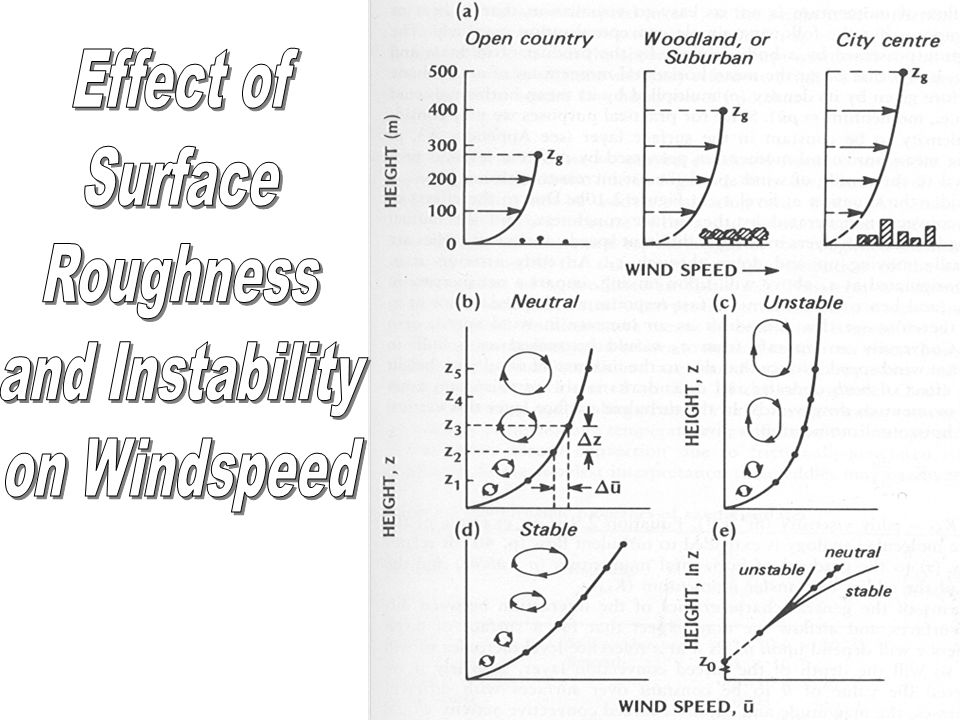
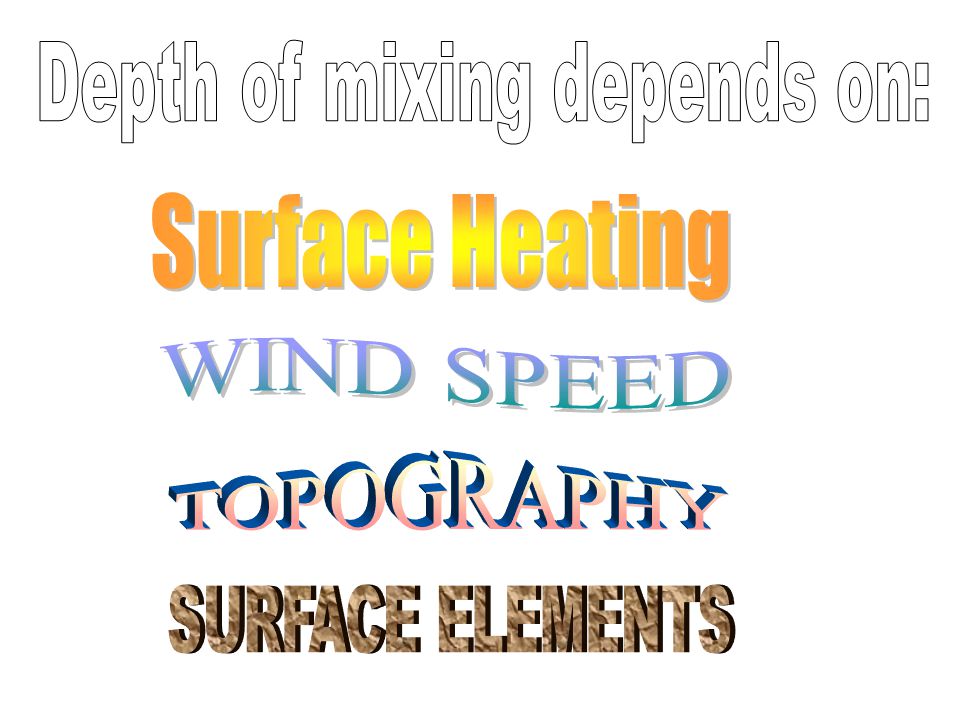
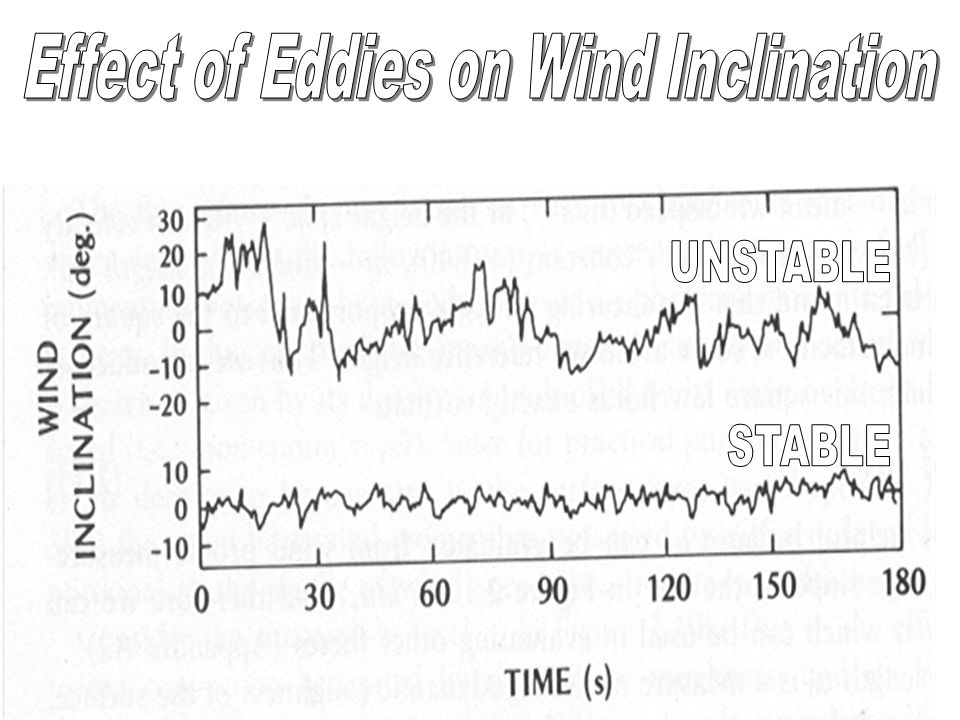
Surface roughness decreases wind speed Reduces impact of Inertial Coriolis Force Winds cross isobars, spiralling out of ANTICYCLONES (H), and into CYCLONES (L) H L
, and into CYCLONES (L) H L")
9
weather.unisys.com

11
H L Air tends to be unstable in low pressure (tendency to rise) Air tends to be stable in high pressure (tendency to fall)
 Air tends to be stable in high pressure (tendency to fall)")
15
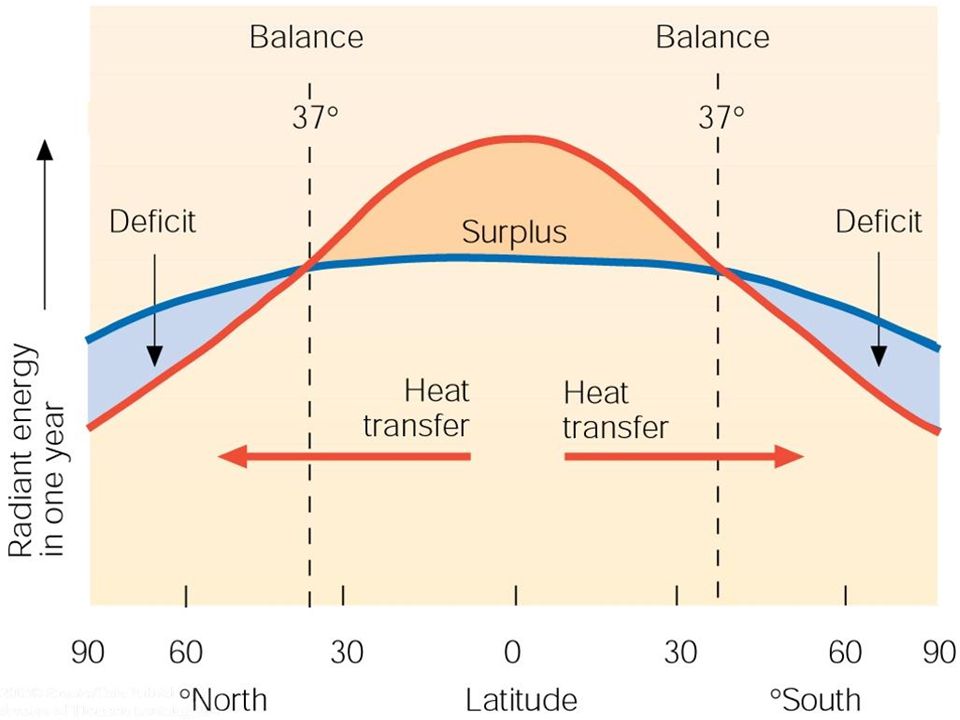
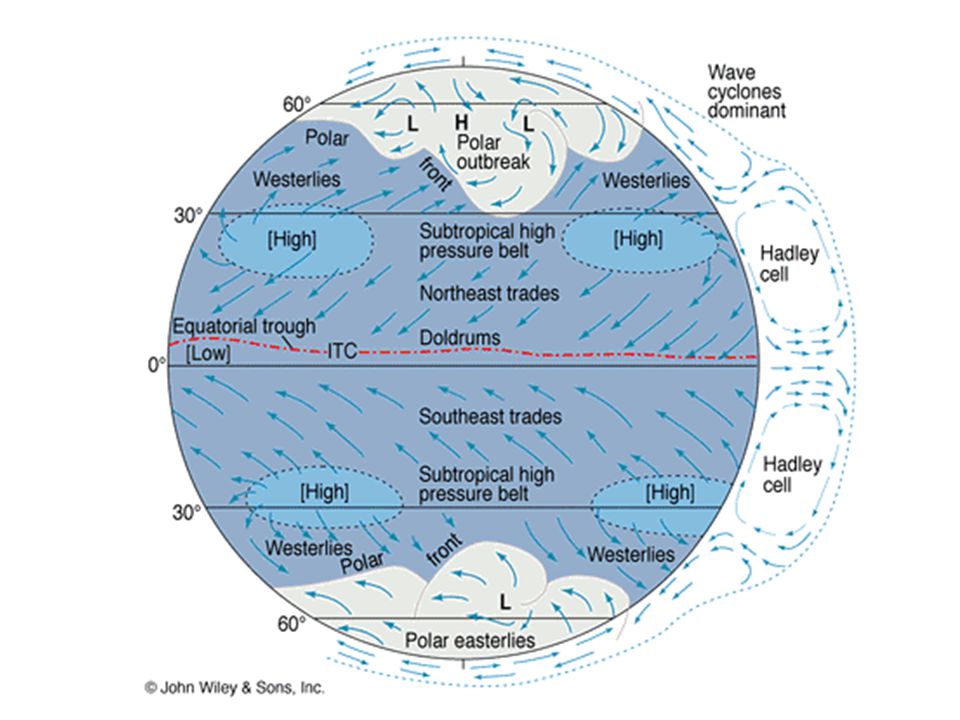
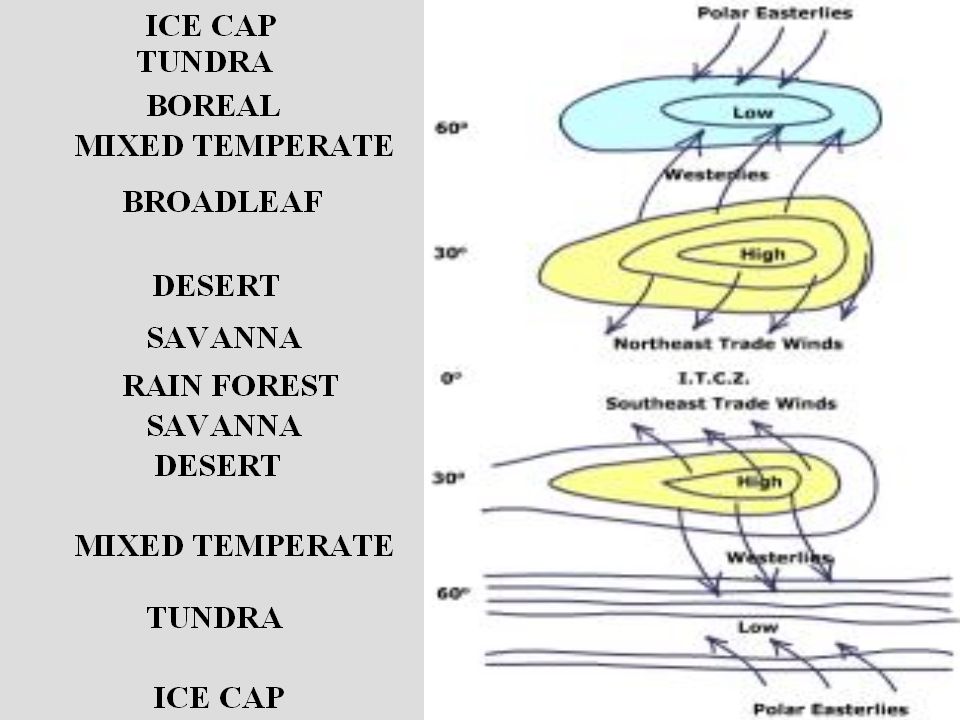
1.Equatorial Low Pressure Trough 2.Subtropical High Pressure Cells 3.Subpolar Low Pressure Cells 4.Weak Polar High Pressure Cells

27
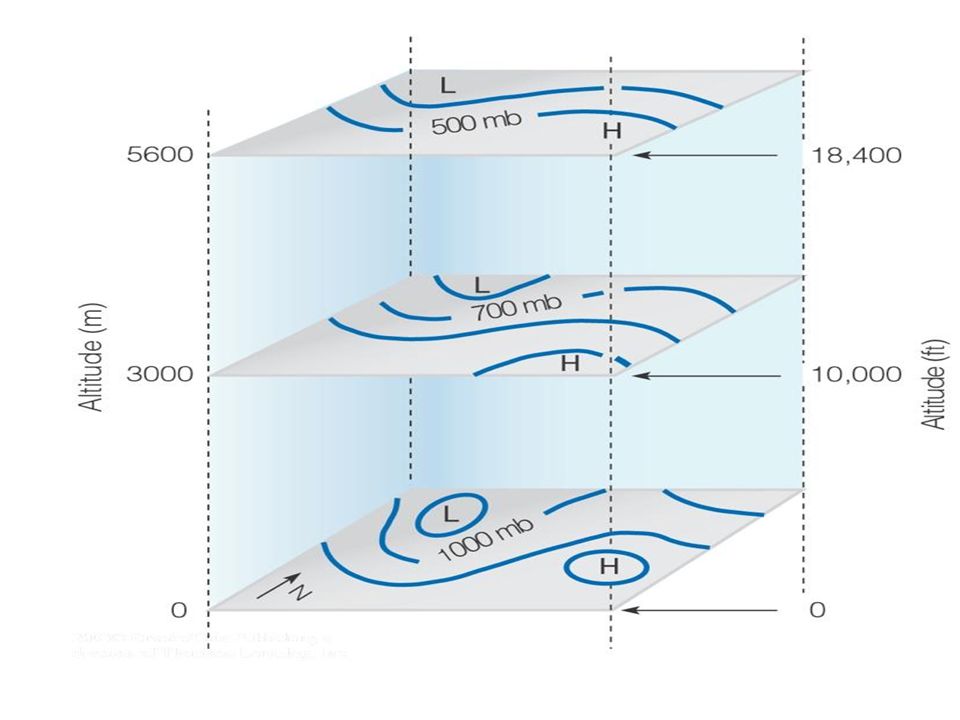
How does this relate to the “jet stream”?

28
Geostrophic wind (above strong influence of friction)
")
31
CHAPTER 10

35
Sonic transducers ULTRASONIC SOUND WAVES DETERMINE WIND SPEED, DIRECTION & TEMPERATURE

38
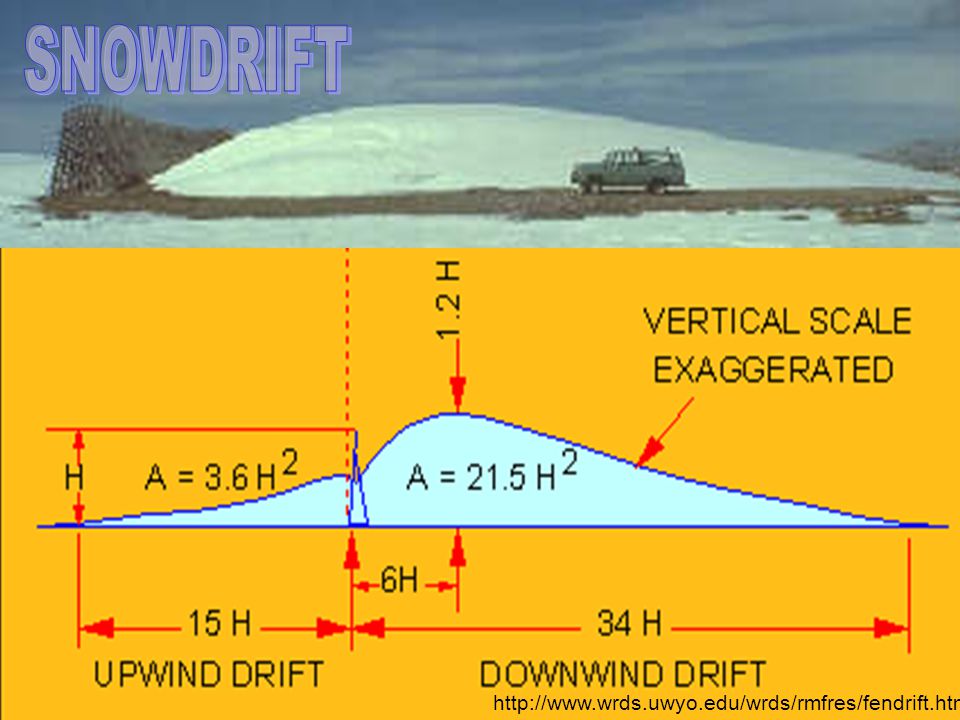
http://www.wrds.uwyo.edu/wrds/rmfres/fendrift.html
57
Also SW Ontario

62
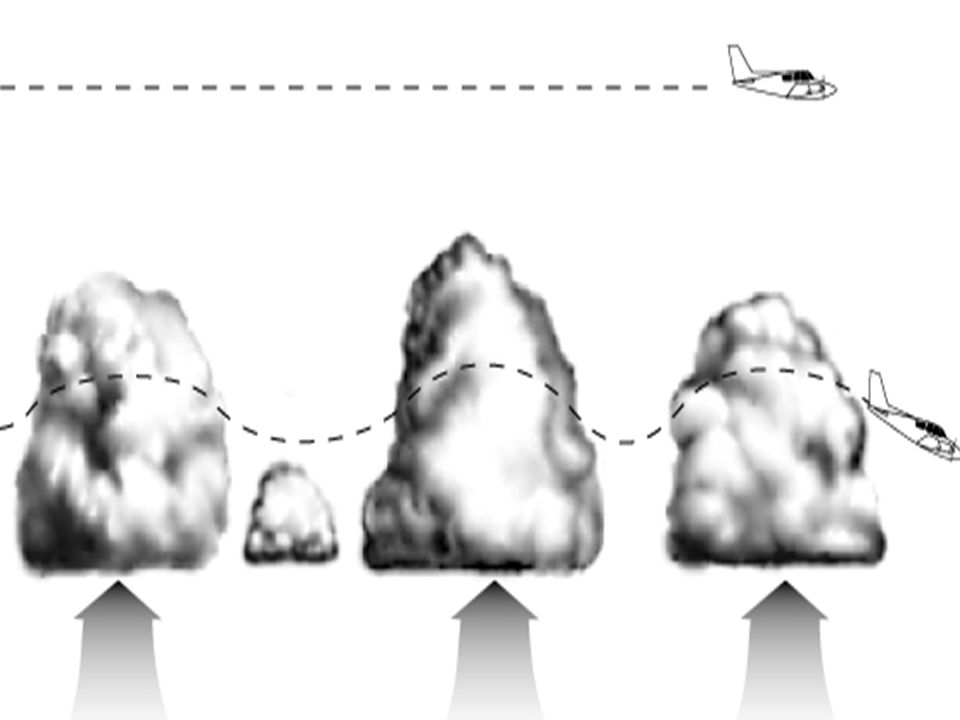
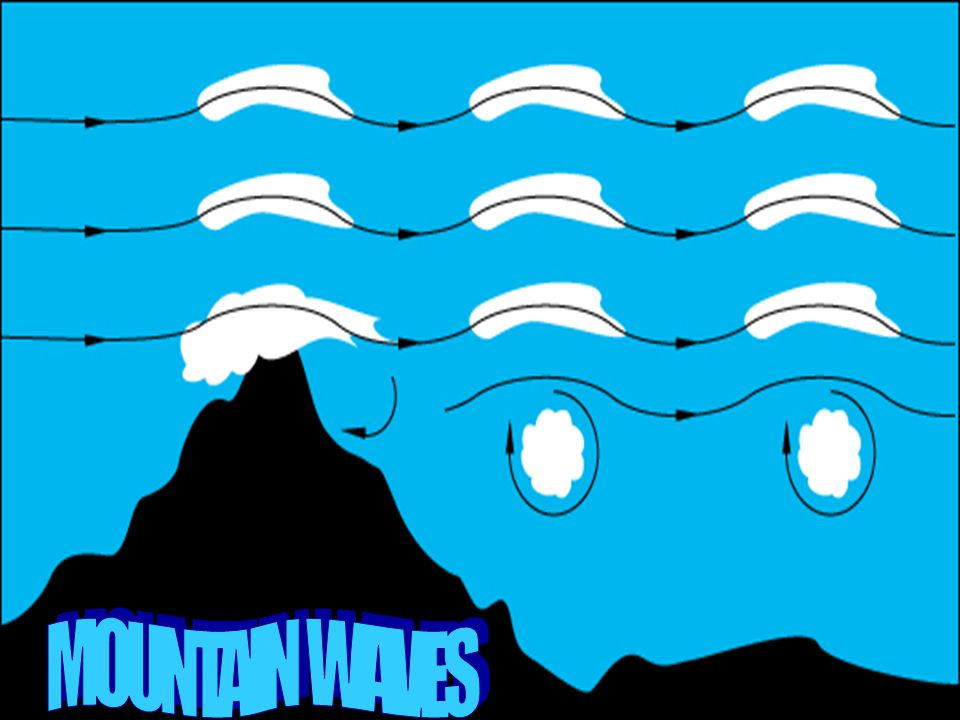
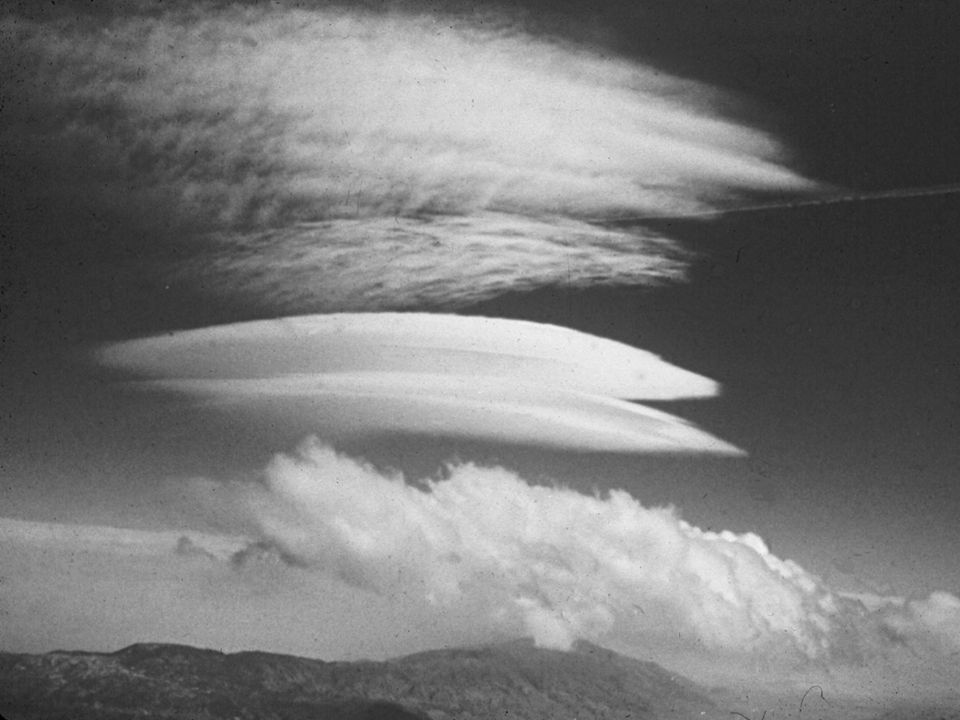
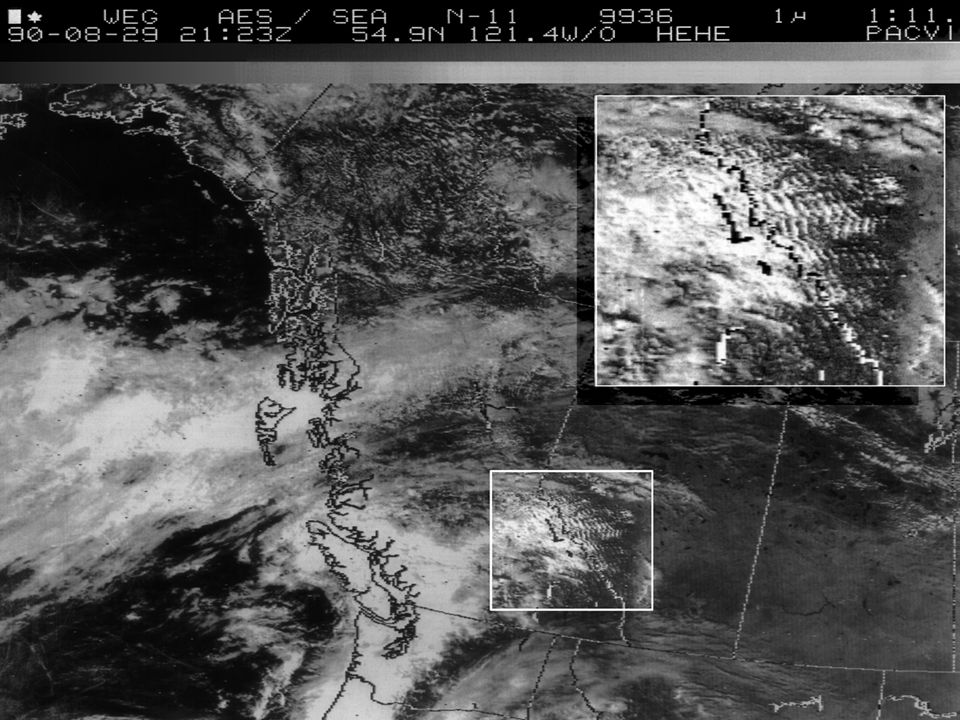
VANCOUVERLETHBRIDGE 8°C8°C 12°C X X Cooling At MALR 6°C/km Warming At DALR 10 °C/km Cooling At DALR 10 °C/km Cooling At MALR 6°C/km Warming At DALR 10 °C/km More sensible heat

65
Santa Ana Winds

69
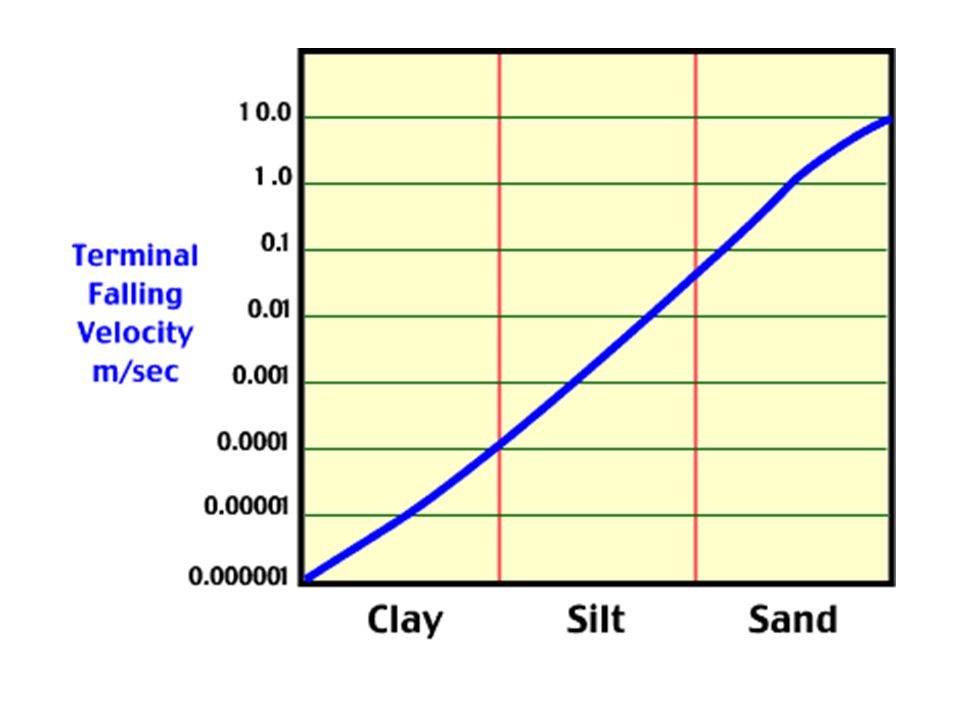
Buried Portion Exposed section Entrained Particle

72
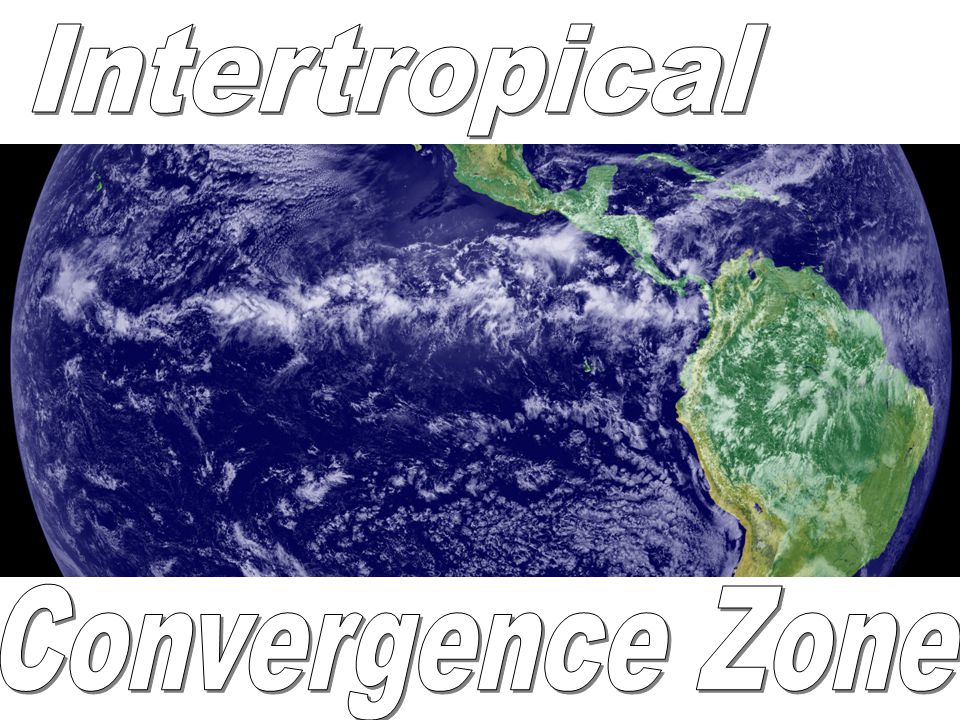
A. Polar cell B. Hadley cell C. ITCZ D. Ferrel cell Which circulation cell extends from the equator to the subtropics?

73
A. Polar cell B. Hadley cell C. ITCZ D. Ferrel cell Which circulation cell extends from the equator to the subtropics?

74
A. Polar cell B. Hadley cell C. ITCZ D. Ferrel cell Which circulation cell extends from the subpolar lows to the poles?

75
A. Polar cell B. Hadley cell C. ITCZ D. Ferrel cell Which circulation cell extends from the subpolar lows to the poles?

76
A. Polar cell B. Hadley cell C. ITCZ D. Ferrel cell Which circulation cell extends from the subtropics to the subpolar lows?

77
A. Polar cell B. Hadley cell C. ITCZ D. Ferrel cell Which circulation cell extends from the subtropics to the subpolar lows?

78
A. trade winds B. westerlies C. ITCZ D. easterlies Which global wind belt is between the subtropical highs and the subpolar lows?

79
A. trade winds B. westerlies C. ITCZ D. easterlies Which global wind belt is between the subtropical highs and the subpolar lows?

80
A. trade winds B. westerlies C. ITCZ D. easterlies Which global wind belt is between the ITCZ and the subtropical highs?

81
A. trade winds B. westerlies C. ITCZ D. easterlies Which global wind belt is between the ITCZ and the subtropical highs?

82
A. cyclone B. jet stream C. tornado D. semi permanent cell What occupies the region labeled “A”? A

83
A. cyclone B. jet stream C. tornado D. semi permanent cell What occupies the region labeled “A”? A

84
A. isotherms B. isobars C. pressure heights D. isohyets What are the dashed lines? A

85
A. isotherms B. isobars C. pressure heights D. isohyets What are the dashed lines? A

86
A. many isobars B. a cold front C. a middle latitude cyclone D. Rossby waves What do the lines on this map show?

87
A. many isobars B. a cold front C. a middle latitude cyclone D. Rossby waves What do the lines on this map show?

88
A. summer B. winter C. fall D. spring Which season is depicted in the photo?

89
A. summer B. winter C. fall D. spring Which season is depicted in the photo?

90
A. New York B. Florida C. Texas D. California Where will the Santa Ana winds likely occur?

91
A. New York B. Florida C. Texas D. California Where will the Santa Ana winds likely occur?

92
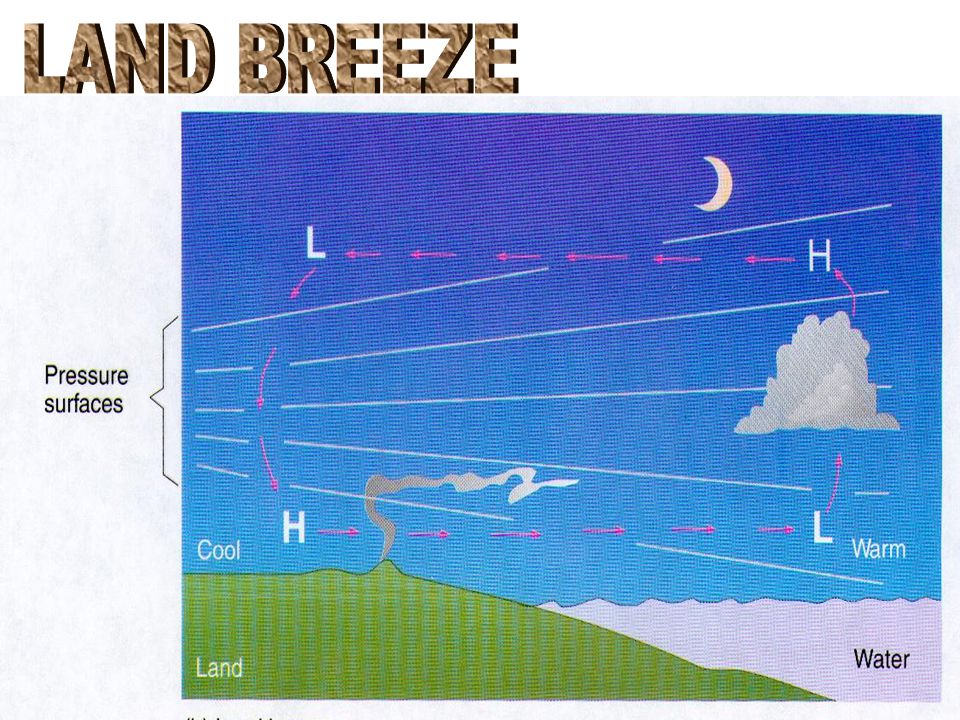
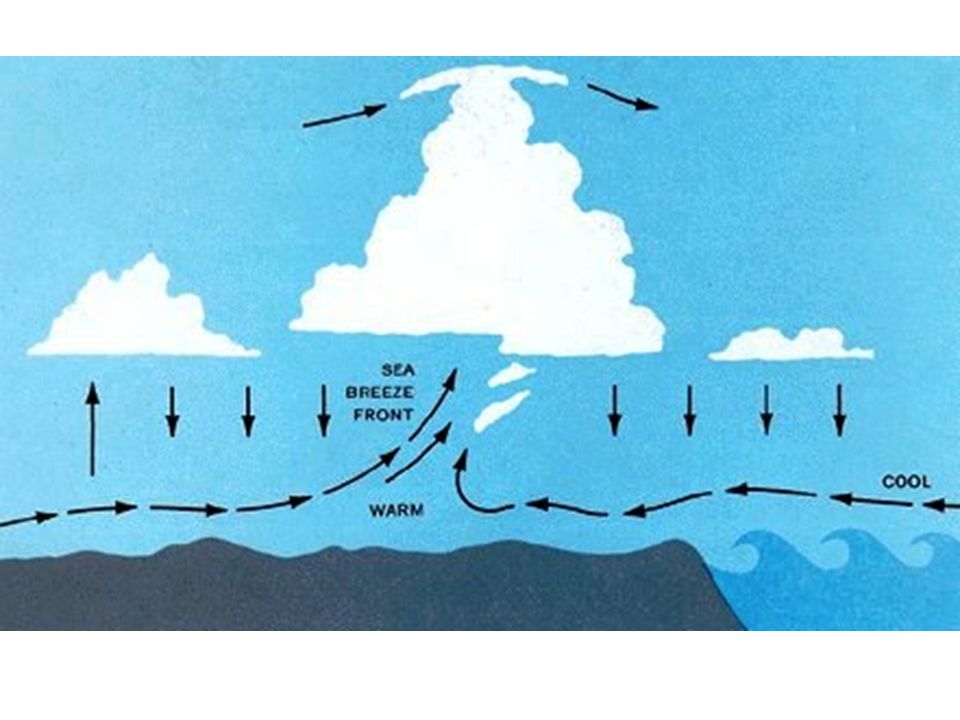
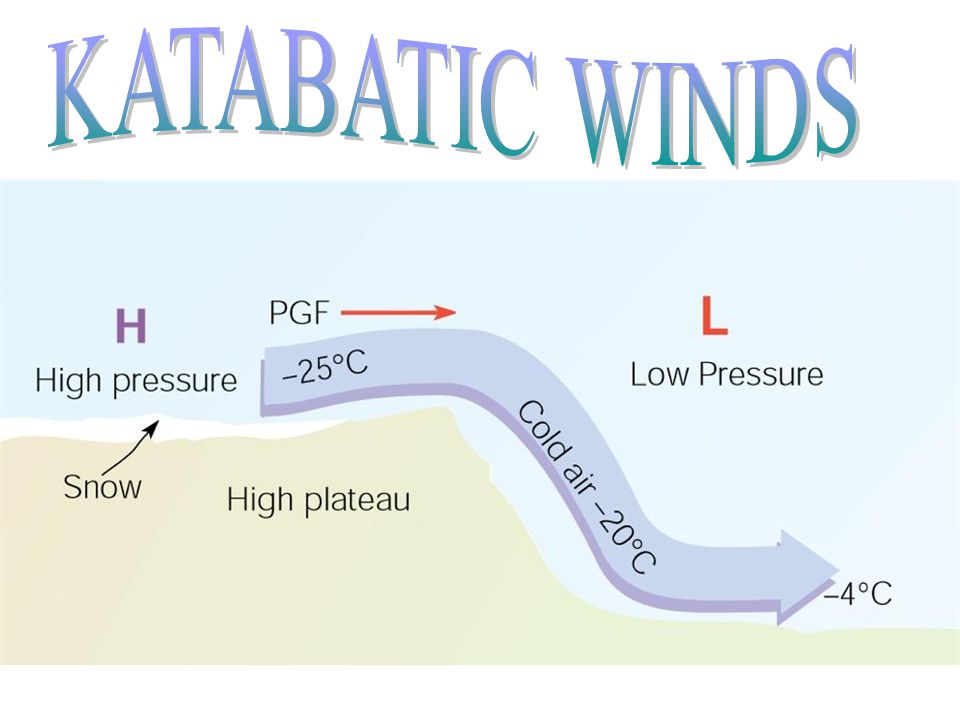
Which type wind is depicted? A. katabatic wind B. land breeze C. sea breeze D. Santa Ana wind

93
A. katabatic wind B. land breeze C. sea breeze D. Santa Ana wind Which type wind is depicted?

Similar presentations


>")


>")


>")

