Download presentation
Presentation is loading. Please wait.

1
The HIV/AIDS Epidemic © 2010 John B. Pryor Illinois State University

2
AIDS - Acquired Immune Deficiency Syndrome HIV - Human Immunodeficiency Virus

3
Ways HIV is Transmitted: 1) through unprotected sexual intercourse 2) through sharing needles 3) through exposure to contaminated blood 4) perinatal exposure 5) mother’s milk
 through unprotected sexual intercourse 2) through sharing needles 3) through exposure to contaminated blood 4) perinatal exposure 5) mother’s milk")
4
Ways you cannot transmit HIV: 1) mosquito bites 2) casual contact 3) toilet seats 4) sharing food
 mosquito bites 2) casual contact 3) toilet seats 4) sharing food")
5
Can I get HIV from oral sex? CDC says “yes.” Not as dangerous as vaginal sex or anal sex Actual risk level is unknown Oral sex is more dangerous if the person performing it has bleeding gums or cuts/abrasions in the mouth. Oral sex is more dangerous if the person who receives it has cuts, abrasions, or sores in the genital area.

6
Natural History of HIV/AIDS HIVInfection 3-6 Weeks AcuteHIVSyndrome 6 Months Positive HIV Test 9.8 Years 14.8 Years ClinicalAIDS Death May be extended by Anti-retroviral therapies

7
Advances in HIV-Testing OraQuick Rapid HIV Test A swab of the outer gums, upper and lower - collects oral fluid Test takes 20 minutes Accuracy - Correctly identified 99.3% of people who were infected with HIV (sensitivity) and 99.8 % of people who were not infected with HIV (specificity)
 and 99.8 % of people who were not infected with HIV (specificity)")
8
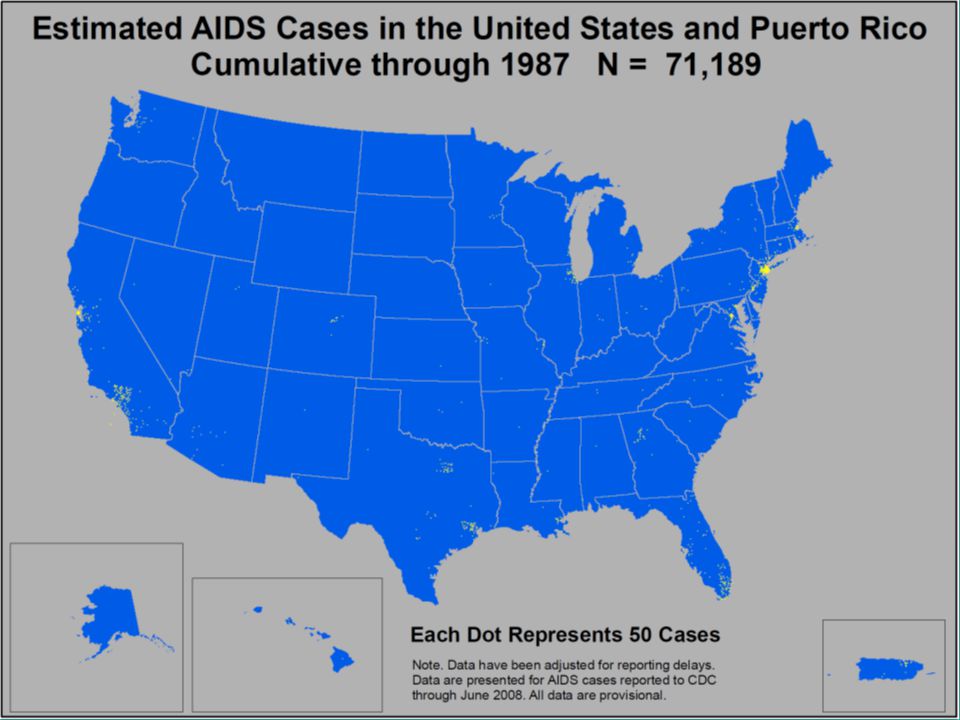
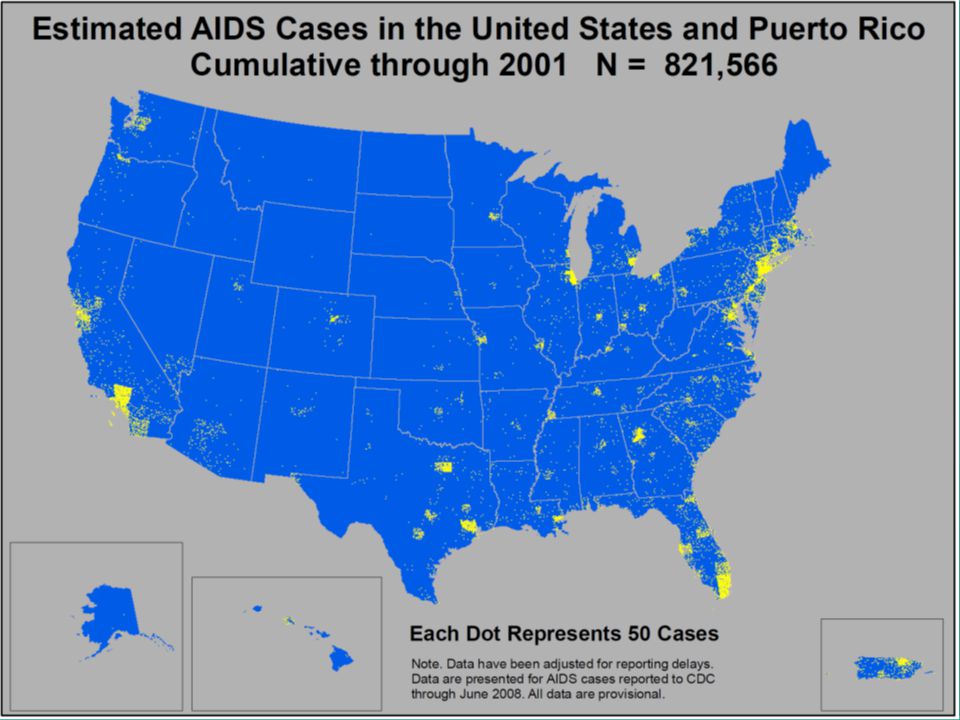
HIV/AIDS Trends in the USA

9
History of the Epidemic 1981 – 121 deaths – A disease was identified among men who have sex with men. It was first called “gay cancer” and later named Gay Related Immuno Deficiency (GRID) 1982 – 447 deaths – Institut Pasteur in France discovered Human Immunodeficiency Virus (HIV) the virus that causes Acquired Immunodeficiency Syndrome (AIDS). CDC in US announced that HIV can be spread through sexual contact or exposure to contaminated blood. 1983 – 1,476 deaths – CDC documented transmission of HIV from heterosexual contact. American Red Cross warned `high risk donors not to donate blood
 1982 – 447 deaths – Institut Pasteur in France discovered Human Immunodeficiency Virus (HIV) the virus that causes Acquired Immunodeficiency Syndrome (AIDS). CDC in US announced that HIV can be spread through sexual contact or exposure to contaminated blood – 1,476 deaths – CDC documented transmission of HIV from heterosexual contact. American Red Cross warned `high risk donors not to donate blood.")
25
Number of AIDS patients, AIDS deaths and patients on antiretroviral therapy among men who have sex with men (MSM), San Francisco, USA, 1980 to 1998 Source: San Francisco Department of Public Health (California), USA, 1999
, San Francisco, USA, 1980 to 1998 Source: San Francisco Department of Public Health (California), USA, 1999")
30
Why is the prevalence of HIV/AIDS higher in African Americans? POVERTY – Almost 1 in 4 African Americans live in poverty. Research by CDC shows that poverty is a strong predictor of HIV infection. IMPRISONMENT OF BLACK MALES – Black men are more than 6 times more likely than White men to have served in prison. 1 out of every 7 Black men 25-29 is in prison. Prison is a place where there are high risks for HIV infection: male- to-male unprotected sex, IV drug use, & prison tattoos. Black men are no more likely to perform risky behaviors than White men while in prison. They are just more likely to be there. When they get out they spread HIV to their communities. POVERTY also predicts IMPRISONMENT.

32
HIV/AIDS Trends in Illinois

33
Cumulative Male AIDS Cases in Illinois through December 2009

34
Cumulative Female AIDS Cases in Illinois through December 2009

35
Ages of HIV Cases in Illinois through December 2009 Percent

37
HIV/AIDS Global Trends

38
December 2009 Total: 33.4 million (31.1 – 35.8 million) Western & Central Europe 850 000 [710 000 – 970 000] Middle East & North Africa 310 000 [250 000 – 380 000] Sub-Saharan Africa 22.4 million [20.8 – 24.1 million] Eastern Europe & Central Asia 1.5 million [1.4 – 1.7 million] South & South-East Asia 3.8 million [3.4 – 4.3 million] Oceania 59 000 [51 000 – 68 000] North America 1.4 million [1.2 – 1.6 million] Latin America 2.0 million [1.8 – 2.2 million] East Asia 850 000 [700 000 – 1.0 million] Caribbean 240 000 [220 000 – 260 000] Adults and children estimated to be living with HIV, 2008
![December 2009 Total: 33.4 million (31.1 – 35.8 million) Western & Central Europe [ – ] Middle East & North Africa [ – ] Sub-Saharan Africa 22.4 million [20.8 – 24.1 million] Eastern Europe & Central Asia 1.5 million [1.4 – 1.7 million] South & South-East Asia 3.8 million [3.4 – 4.3 million] Oceania [ – ] North America 1.4 million [1.2 – 1.6 million] Latin America 2.0 million [1.8 – 2.2 million] East Asia [ – 1.0 million] Caribbean [ – ] Adults and children estimated to be living with HIV, 2008](http://images.slideplayer.com/16/5229907/slides/slide_38.jpg "December 2009 Total: 33.4 million (31.1 – 35.8 million) Western & Central Europe [ – ] Middle East & North Africa [ – ] Sub-Saharan Africa 22.4 million [20.8 – 24.1 million] Eastern Europe & Central Asia 1.5 million [1.4 – 1.7 million] South & South-East Asia 3.8 million [3.4 – 4.3 million] Oceania [ – ] North America 1.4 million [1.2 – 1.6 million] Latin America 2.0 million [1.8 – 2.2 million] East Asia [ – 1.0 million] Caribbean [ – ] Adults and children estimated to be living with HIV, 2008")
39
December 2009 Estimated number of adults and children newly infected with HIV, 2008 Western & Central Europe 30 000 [23 000 – 35 000] Middle East & North Africa 35 000 [24 000 – 46 000] Sub-Saharan Africa 1.9 million [1.6 – 2.2 million] Eastern Europe & Central Asia 110 000 [100 000 – 130 000] South & South-East Asia 280 000 [240 000 – 320 000] Oceania3900 [2900 – 5100] North America 55 000 [36 000 – 61 000] Latin America 170 000 [150 000 – 200 000] East Asia 75 000 [58 000 – 88 000] Caribbean 20 000 [16 000 – 24 000] Total: 2.7 million (2.4 – 3.0 million)
![December 2009 Estimated number of adults and children newly infected with HIV, 2008 Western & Central Europe [ – ] Middle East & North Africa [ – ] Sub-Saharan Africa 1.9 million [1.6 – 2.2 million] Eastern Europe & Central Asia [ – ] South & South-East Asia [ – ] Oceania3900 [2900 – 5100] North America [ – ] Latin America [ – ] East Asia [ – ] Caribbean [ – ] Total: 2.7 million (2.4 – 3.0 million)](http://images.slideplayer.com/16/5229907/slides/slide_39.jpg "December 2009 Estimated number of adults and children newly infected with HIV, 2008 Western & Central Europe [ – ] Middle East & North Africa [ – ] Sub-Saharan Africa 1.9 million [1.6 – 2.2 million] Eastern Europe & Central Asia [ – ] South & South-East Asia [ – ] Oceania3900 [2900 – 5100] North America [ – ] Latin America [ – ] East Asia [ – ] Caribbean [ – ] Total: 2.7 million (2.4 – 3.0 million)")
40
December 2009 Estimated adult and child deaths due to AIDS, 2008 Western & Central Europe 13 000 [10 000 – 15 000] Middle East & North Africa 20 000 [15 000 – 25 000] Sub-Saharan Africa 1.4 million [1.1 – 1.7 million] Eastern Europe & Central Asia 87 000 [72 000 – 110 000] South & South-East Asia 270 000 [220 000 – 310 000] Oceania2000 [1100 – 3100] North America 25 000 [20 000 – 31 000] Latin America 77 000 [66 000 – 89 000] East Asia 59 000 [46 000 – 71 000] Caribbean 12 000 [9300 – 14 000] Total: 2.0 million (1.7 – 2.4 million)
![December 2009 Estimated adult and child deaths due to AIDS, 2008 Western & Central Europe [ – ] Middle East & North Africa [ – ] Sub-Saharan Africa 1.4 million [1.1 – 1.7 million] Eastern Europe & Central Asia [ – ] South & South-East Asia [ – ] Oceania2000 [1100 – 3100] North America [ – ] Latin America [ – ] East Asia [ – ] Caribbean [9300 – ] Total: 2.0 million (1.7 – 2.4 million)](http://images.slideplayer.com/16/5229907/slides/slide_40.jpg "December 2009 Estimated adult and child deaths due to AIDS, 2008 Western & Central Europe [ – ] Middle East & North Africa [ – ] Sub-Saharan Africa 1.4 million [1.1 – 1.7 million] Eastern Europe & Central Asia [ – ] South & South-East Asia [ – ] Oceania2000 [1100 – 3100] North America [ – ] Latin America [ – ] East Asia [ – ] Caribbean [9300 – ] Total: 2.0 million (1.7 – 2.4 million)")
41
December 2009 Western & Central Europe <100[<100] Middle East & North Africa 15 000 [7600 – 24 000] Sub-Saharan Africa 1.8 million [1.0 – 2.5 million] Eastern Europe & Central Asia 20 000 [12 000 – 28 000] South & South-East Asia 140 000 [91 000 – 200 000] Oceania1500 [<1000 – 2600] North America <100[<100] Latin America 31 000 [22 000 – 40 000] East Asia 16 000 [11 000 – 23 000] Caribbean 11 000 [7400 – 16 000] Children (<15 years) estimated to be living with HIV, 2008 Total: 2.1 million (1.2 – 2.9 million)
![December 2009 Western & Central Europe <100[<100] Middle East & North Africa [7600 – ] Sub-Saharan Africa 1.8 million [1.0 – 2.5 million] Eastern Europe & Central Asia [ – ] South & South-East Asia [ – ] Oceania1500 [<1000 – 2600] North America <100[<100] Latin America [ – ] East Asia [ – ] Caribbean [7400 – ] Children (<15 years) estimated to be living with HIV, 2008 Total: 2.1 million (1.2 – 2.9 million)](http://images.slideplayer.com/16/5229907/slides/slide_41.jpg "December 2009 Western & Central Europe <100[<100] Middle East & North Africa [7600 – ] Sub-Saharan Africa 1.8 million [1.0 – 2.5 million] Eastern Europe & Central Asia [ – ] South & South-East Asia [ – ] Oceania1500 [<1000 – 2600] North America <100[<100] Latin America [ – ] East Asia [ – ] Caribbean [7400 – ] Children (<15 years) estimated to be living with HIV, 2008 Total: 2.1 million (1.2 – 2.9 million)")
42
December 2009 Western & Central Europe <100 [<100 – <200] Middle East & North Africa 4600 [2300 – 7500] Sub-Saharan Africa 390 000 [210 000 – 570 000] Eastern Europe & Central Asia 3700 [1700 – 6000] South & South-East Asia 18 000 [11 000 – 25 000] Oceania<500 [<500 – <1000] North America <100 [<100 – <200] Latin America 6900 [4200 – 9700] East Asia 3200 [2100 – 4500] Caribbean2300 [1400 – 3400] Estimated number of children (<15 years) newly infected with HIV, 2008 Total: 430 000 (240 000 – 610 000)
![December 2009 Western & Central Europe <100 [<100 – <200] Middle East & North Africa 4600 [2300 – 7500] Sub-Saharan Africa [ – ] Eastern Europe & Central Asia 3700 [1700 – 6000] South & South-East Asia [ – ] Oceania<500 [<500 – <1000] North America <100 [<100 – <200] Latin America 6900 [4200 – 9700] East Asia 3200 [2100 – 4500] Caribbean2300 [1400 – 3400] Estimated number of children (<15 years) newly infected with HIV, 2008 Total: ( – )](http://images.slideplayer.com/16/5229907/slides/slide_42.jpg "December 2009 Western & Central Europe <100 [<100 – <200] Middle East & North Africa 4600 [2300 – 7500] Sub-Saharan Africa [ – ] Eastern Europe & Central Asia 3700 [1700 – 6000] South & South-East Asia [ – ] Oceania<500 [<500 – <1000] North America <100 [<100 – <200] Latin America 6900 [4200 – 9700] East Asia 3200 [2100 – 4500] Caribbean2300 [1400 – 3400] Estimated number of children (<15 years) newly infected with HIV, 2008 Total: ( – )")
43
December 2009 Western & Central Europe <100 [<100 – <200] Middle East & North Africa 3300 [1600 – 5300] Sub-Saharan Africa 230 000 [120 000 – 350 000] Eastern Europe & Central Asia 1400 [<500 – 2700] South & South-East Asia 11 000 [4900 – 17 000] Oceania<100 [<100 – <500] North America <100 [<100 – <200] Latin America 3900 [2100 – 5700] East Asia 1500 [<1000 – 2300] Caribbean1300 [<1000 – 2100] Estimated deaths of children (<15 years) due to AIDS, 2008 Total: 280 000 (150 000 – 410 000)
![December 2009 Western & Central Europe <100 [<100 – <200] Middle East & North Africa 3300 [1600 – 5300] Sub-Saharan Africa [ – ] Eastern Europe & Central Asia 1400 [<500 – 2700] South & South-East Asia [4900 – ] Oceania<100 [<100 – <500] North America <100 [<100 – <200] Latin America 3900 [2100 – 5700] East Asia 1500 [<1000 – 2300] Caribbean1300 [<1000 – 2100] Estimated deaths of children (<15 years) due to AIDS, 2008 Total: ( – )](http://images.slideplayer.com/16/5229907/slides/slide_43.jpg "December 2009 Western & Central Europe <100 [<100 – <200] Middle East & North Africa 3300 [1600 – 5300] Sub-Saharan Africa [ – ] Eastern Europe & Central Asia 1400 [<500 – 2700] South & South-East Asia [4900 – ] Oceania<100 [<100 – <500] North America <100 [<100 – <200] Latin America 3900 [2100 – 5700] East Asia 1500 [<1000 – 2300] Caribbean1300 [<1000 – 2100] Estimated deaths of children (<15 years) due to AIDS, 2008 Total: ( – )")
44
How has the advent of anti-retroviral therapy affected mortality rates?

45
Estimated number of AIDS-related deaths with and without antiretroviral therapy, globally, 1996 – 2008 2.5 2.0 1.5 0.5 1.0 3.0 0 Number (millions) Year 1996199820002002200420062008199719992001200320052007 Figure V No antiretroviral therapy At current levels of antiretroviral prophylaxis
 Year Figure V No antiretroviral therapy At current levels of antiretroviral prophylaxis")
46
Estimated number of Life-years added due to antiretroviral therapy, by region, 1996 – 2008 8 7 6 4 5 3 (millions) 2 1 Sub-SaharanAfricaAsiaCaribbeanMiddleEast and North AfricaWesternEurope AmericaLatinAmericaEasternEurope and Central AsiaOceania 0 Figure VII 7.2 million 2.3 million 1.4 million 590 000 73 000 40 000 49 000 7500
 2 1 Sub-SaharanAfricaAsiaCaribbeanMiddleEast and North AfricaWesternEurope AmericaLatinAmericaEasternEurope and Central AsiaOceania 0 Figure VII 7.2 million 2.3 million 1.4 million")
47
HIV/AIDS Trends in Africa

48
HIV prevalence (%) in adults (15–49) in Africa, 2007 2.8 Namibia Botswana Zimbabwe Zambia
 in adults (15–49) in Africa, Namibia Botswana Zimbabwe Zambia")
49
HIV prevalence (%) among 15–24 years old, by sex, selected countries, 2005–2007 0510152025 % HIV prevalence Swaziland South Africa Zimbabwe Central African Republic Côte d'Ivoire Sierra Leone Rwanda Haiti Guinea Ethiopia Benin DR Congo Niger Senegal Cambodia India Uganda Chad Dominican Republic Mali Female Male 2.10 Source: Demographic and Health Surveys and other national population-based surveys with HIV testing.
 among 15–24 years old, by sex, selected countries, 2005– % HIV prevalence Swaziland South Africa Zimbabwe Central African Republic Côte d Ivoire Sierra Leone Rwanda Haiti Guinea Ethiopia Benin DR Congo Niger Senegal Cambodia India Uganda Chad Dominican Republic Mali Female Male 2.10 Source: Demographic and Health Surveys and other national population-based surveys with HIV testing.")
50
Age at first sexual intercourse by education status in Swaziland, 2007 Sources: Central Statistical Office & Macro International (2008). Figure 5 0 20 40 60 80 100 Women < 15 yrs Women < 18 yrs Men < 15 yrs Men < 18 yrs No education Lower primary Higher primary Secondary High School Tertiary %

51
Life expectancy at birth, selected regions, 1950–1955 to 2005–2010 2.11 Source: Population Division of the Department of Economic and Social Affairs of the United Nations Secretariat, World Population Prospects: The 2006 Revision, http://esa.un.org/unpp

52
Changes in population structure: Ghana and Lesotho 2.12 Source: Population Division of the Department of Economic and Social Affairs of the United Nations Secretariat, World Population Prospects: The 2006 Revision, http://esa.un.org/unpp

53
HIV/AIDS Trends in Eastern Europe & Asia

54
HIV prevalence (%) in adults in Eastern Europe and Central Asia, 2007
 in adults in Eastern Europe and Central Asia, 2007")
55
HIV/AIDS Trends in

56
Most-affected regions in the Russian Federation Source: Russian Federal AIDS Centre, based on registered number of people living with HIV through 22 March 2004. Compiled by AIDS Foundation East-West. The designations employed and the presentation of material on this map do not imply the expression of any opinion whatsoever on the part of UNAIDS/WHO concerning the legal status of any country, territory, city or area or of its authority, or concerning the delimitation of its frontiers or boundaries. AIDS epidemic update, December 2004. Fig. 18.

57
33.3 63.5 34.1 40.0 0 20 40 60 80 100 % HIV prevalence 15-1920-2425-2930-34 Age-group HIV prevalence among female sex workers, by age-group, St. Petersburg, Russian Federation, 2003 Source: T. Smolskaya, et al., XV International AIDS Conference, 11-16 July 2004. Abstract No. ThOrC1371. AIDS epidemic update, December 2004. Fig.1 9.

58
0.0 30.8 40.0 53.8 66.7 0 20 40 60 80 100 % HIV prevalence 0-1 partner 2-4 partners 5-9 partners 10-19 partners 20 or more partners HIV prevalence among sex workers, by number of commercial partners in past seven days, St. Petersburg, Russian Federation, 2003 Source: T. Smolskaya, et al., XV International AIDS Conference, 11-16 July 2004. Abstract No. ThOrC1371. AIDS epidemic update, December 2004. Fig 20.

59
Newly diagnosed HIV infections per million population in Eastern European and Central Asian countries, 1996—2003 Source: (1) HIV /AIDS Surveillance in Europe, EuroHIV mid-year report 2003, no. 69. (2) AIDS Foundation East West 0 200 400 600 800 1,000 1,200 19931994199519961997199819992000200120022003 New HIV infection per million population Estonia Russian Federation Ukraine Belarus Moldova, Republic of Latvia Kazakhstan Uzbekistan Kyrgyzstan 2004 Report on the Global AIDS Epidemic (Fig 9)
 AIDS Foundation East West ,000 1, New HIV infection per million population Estonia Russian Federation Ukraine Belarus Moldova, Republic of Latvia Kazakhstan Uzbekistan Kyrgyzstan 2004 Report on the Global AIDS Epidemic (Fig 9).")
Similar presentations