Download presentation
Presentation is loading. Please wait.

1
AP Environmental Science
Human Population: Growth, Demography and Carrying Capacity “Can we stabilize population by reducing fertility before nature takes over and stabilizes our numbers by raising mortality?” Lester Brown © Brooks/Cole Publishing Company / ITP

2
1. Factors Affecting Human Population Size
World Population Clock Human population is currently growing exponentially. -Earth History -What will be the ultimate size of the human population? -What is Earth's carrying capacity? © Brooks/Cole Publishing Company / ITP

3
Factors Affecting Human Population Size
Population change is calculated as the difference between individuals entering and leaving a population: Population Change Births + Immigration Deaths + Emigration – = -Birth rate- the number of births per year -Death rate- the number of deaths per year -Zero population growth (ZPG)- occurs when factors that increase and decrease population size balance. -NOTE: when considering world population growth rates, immigration and emigration play no part (YET!) © Brooks/Cole Publishing Company / ITP
- occurs when factors that increase and decrease population size balance. -NOTE: when considering world population growth rates, immigration and emigration play no part (YET!) © Brooks/Cole Publishing Company / ITP.")
4
Demography Demography- the study of changes in size, composition and distribution of human populations. Demographers study these trends, as well as their causes and consequences.

5
Birth Rates Birth rates are the numbers of births/year.
Seems equal, right? But what if Country A has 1000 people and Country B has 10,000? Which country is potentially growing faster? 45 BIRTHS/YEAR 45 BIRTHS/YEAR BIRTH RATE BIRTH RATE Country A Country B

6
Crude Birth and Death Rates
Crude birth rate- number of births per year/1000 people. Crude death rates calculated in the same way. LDC’s typically have higher crude birth and death rates—Africa #1 Birth rates in LDC’s: 1.5% Birth rates in MDC’s: 0.1%

7
Crude Rates Crude birth rates take into account the population size and shows a better picture of what is actually happening. 45 BIRTHS/YEAR/1000 4.5 BIRTHS/YEAR/1000 CRUDE BIRTH RATE: CRUDE BIRTH RATE: Country A Country B

8
World 21 9 All developed countries 11 10 All developing countries 24 8
Average crude birth rate Average crude death rate World 21 9 All developed countries 11 10 All developing countries 24 8 Developing countries (w/o China) 27 9 © 2004 Brooks/Cole – Thomson Learning
 © 2004 Brooks/Cole – Thomson Learning.")
9
© 2004 Brooks/Cole – Thomson Learning
Africa 38 14 Latin America 22 © 2004 Brooks/Cole – Thomson Learning 6 Asia 20 7 Oceania 18 7 United States 14 8 North America 14 8 Europe 10 12

10
Population Growth Rates
-The annual rate of population growth is generally expressed as a percentage that is representative of the growth per year. Note the distribution of growth rates in 1998. -To figure the % rate: (Popfinal - Popinitial) / Popinitial X 100 OR use the rule of 70! © Brooks/Cole Publishing Company / ITP
 / Popinitial X 100. OR use the rule of 70! © Brooks/Cole Publishing Company / ITP.")
11
Population Change Between 1963 and 2004 the world’s annual population growth dropped 41% from 2.2% to 1.25%. In this same time, the world population doubled to 6.4 billion. A small, exponential population growth rate can still have large effects, especially if the population base is large. The world is currently adding another New York City every month.

12
The Most Populous Countries
The world’s top five most populated countries : #1 China1.3 billion #2 India1.1 billion -These two countries together make up 37% of the world’s total population #3 United States #4 Indonesia #5 Brazil © Brooks/Cole Publishing Company / ITP

13
© 2004 Brooks/Cole – Thomson Learning
China © 2004 Brooks/Cole – Thomson Learning 1.3 billion 1.4 billion India 1.1 billion 1.4 billion USA 294 million 349 million Indonesia 219 million 308 million Brazil 179 million 211 million Pakistan 159 million 229 million Russia 144 million 137 million Bangladesh 141 million 205 million Japan 128 million 121 million Nigeria 137 million 206 million 2004 2025

14
Population Size and Fertility
Fertility- the number of births that occur to an individual woman or in a population. Two types of fertility rates that affect a country’s population size and growth rate: 1)Replacement-level fertility rate 2)Total fertility rate (TFR) © Brooks/Cole Publishing Company / ITP
Replacement-level fertility rate. 2)Total fertility rate (TFR) © Brooks/Cole Publishing Company / ITP.")
15
Replacement-Level Fertility vs. Total Fertility Rate
Replacement-level fertility: the number of kids a couple must have to replace themselves. 2.1 developed, 2.5 developing due to fact that some females die before reproducing Reaching replacement levels does not mean immediate halt in population growth b/c many future parents are still alive.

16
Replacement-Level Fertility vs. TFR
Total fertility rate: the average number of kids a woman typically has during her reproductive years. These have dropped sharply since 1950’s Developed: 2.51.5 Developing 6.53.1 ** Highest currently in Africa

17
© 2004 Brooks/Cole – Thomson Learning
World 5 children per woman 2.8 Developed countries 2.5 1.6 © 2004 Brooks/Cole – Thomson Learning Developing countries 6.5 3.1 Africa 6.6 5.1 Latin America 5.9 2.6 Asia 5.9 2.6 Oceania 3.8 2.1 North America 3.5 2.0 Europe 2.6 1.4 1950 2004

18
Total Fertility Rate The expected population in future years depends on the world’s projected average TFR (high:2.5, medium:2.0, low:1.5) 97% of the growth in all three estimates is projected to take place in developing countries. 2008 TFR for world 2.5 Interactive TFR graph

19
Population (billions)
12 11 High High 10.6 billion people 10 Medium Low 9 Medium 8.9 billion people 8 Population (billions) 7 6 Low 7.2 billion people 5 4 3 2 1950 1960 1970 1980 1990 2000 2010 2020 2030 2040 2050 Year
 Low. 7.2 billion people Year.")
20
Total Fertility in the United States
-In the U.S. the time of the highest TFR was in the 1950’s after WWII. This was called the “Baby Boom.” -Total fertility in the United States had a major increase during the "baby boom" (1946–64) and is now hovering just below replacement level. Fig.11–9 © Brooks/Cole Publishing Company / ITP
 and is now hovering just below replacement level. Fig.11–9. © Brooks/Cole Publishing Company / ITP.")
21
Factors Affecting Fertility Rates
Education and affluence Importance of child labor Urbanization—access to family planning Availability of reliable birth control Availability of legal abortions Cost of raising and educating children Educational and employment opportunities for women Decreased infant mortality Average age of marriage Availability of pensions Religious beliefs, traditions, and cultural norms

22
Birth Control Typical effectiveness of birth control methods in the United States The US is the #1 industrialized country for teen pregnancy rate © Brooks/Cole Publishing Company / ITP

23
Birth Control Typical effectiveness of birth control methods in the United States (continued): © Brooks/Cole Publishing Company / ITP
: © Brooks/Cole Publishing Company / ITP.")
24
Death Rates Infant death rates are lower in developed countries than developing countries. Fig.11–12 © Brooks/Cole Publishing Company / ITP

25
Death Rates Infant mortality- the number of babies of every 1,000 born who die before their first birthday. At least 8 million infants (most in developing) die of preventable causes during their first year of life22,000 per day = 55 jumbo jet crashes with no survivors. **Life expectancy and infant mortality rates (deaths/1000 before first birthday) determine health of people in a country.
 die of preventable causes during their first year of life22,000 per day = 55 jumbo jet crashes with no survivors. **Life expectancy and infant mortality rates (deaths/1000 before first birthday) determine health of people in a country.")
26
Birth and Death Rates Over Time
The rapid growth in the world's population has not resulted from an ↑ in birth rates, but a ↓ in death rates. Death rates have ↓ markedly during past 100 years Birth rates have also ↓, but not as fast as death rates The increasing difference between birth and death rates is what has lead to exponential population growth Patterns of change in birth and death rates are different for developed vs. developing countries. © Brooks/Cole Publishing Company / ITP

27
Birth and Death Rates Over Time
In developed countries decreases in death rates are being accompanied by decreases in birth rates over time. Fig.11–11a © Brooks/Cole Publishing Company / ITP

28
Birth and Death Rates Over Time
In developing countries decreases in death rates have not been accompanied by as large of decreases in birth rates over time, leading to major population increase. Fig.11–11b © Brooks/Cole Publishing Company / ITP

29
2. Population Age Structure
Age structure- refers to the proportion of the population in each age class: Prereproductive (0–14 years) Reproductive (15–44 years) Postreproductive (45 and up)
 Reproductive (15–44 years) Postreproductive (45 and up)")
30
Population Age Structure
Age structure of a rapidly growing vs. a slower growing population. Rapidly growing populations have pyramid–shaped age structures, with large numbers of prereproductive individuals. Slower growing populations have a more even age distribution. Fig.11–13a © Brooks/Cole Publishing Company / ITP

31
Population Age Structure
Age structure of populations with zero growth vs. negative growth. -Populations with zero population growth have nearly equal proportions of prereproductive and reproductive individuals; -Populations with negative growth have a greater proportion of reproductive than prereproductive individuals. Fig.11–13b © Brooks/Cole Publishing Company / ITP

32
Population Age Structure
Developing countries are expected to continue to have a pyramid shape through the year 2025, although the age structure will become somewhat more evenly distributed. Fig.11–14a © Brooks/Cole Publishing Company / ITP

33
Population Age Structure
Populations of developed countries are expected to have an increasingly even age distribution through the year 2025. Age Structure Video Clip from hippocampus.org Fig.11–14b © Brooks/Cole Publishing Company / ITP

34
Population (2004) Population projected (2025) Infant mortality rate
United States (highly developed) 294 million 179 million Brazil (moderately developed) 137 million Nigeria (less developed) Population projected (2025) 349 million 211 million 206 million Infant mortality rate 6.7 33 100 Life expectancy 77 years 71 years 52 years Fertility rate (TFR) 2.0 2.2 5.7 %Population under age 15 21% 30% 44% % Population over age 65 12% 6% 3% Per capita GDP $36,110 $7,450 $800 © 2004 Brooks/Cole – Thomson Learning
 294 million. 179 million. Brazil (moderately developed) 137 million. Nigeria (less developed) Population. projected. (2025) 349 million. 211 million. 206 million. Infant. mortality. rate Life. expectancy. 77 years. 71 years. 52 years. Fertility. rate (TFR) %Population. under. age % 30% 44% % Population. over. age % 6% 3% Per capita. GDP. $36,110. $7,450. $800. © 2004 Brooks/Cole – Thomson Learning.")
35
Population Age Structure
Population age structure of the United States continues to show a bulge as the baby boom generation ages. This has been compared to watching a boa constrictor swallow a pig. Fig.11–15 © Brooks/Cole Publishing Company / ITP

36
3. Solutions: Stabilizing Human Population
In 1972 the projections of a model, published in The Limits to Growth, indicated that if current economic, resource use and population trends continue then we can expect economic and ecological collapse in the next century. -The results of this admittedly crude model challenged basic assumptions of industrial societies that there are no limits to industrial and population growth -20 later the authors updated their work in Beyond the Limits: Confronting Global Collapse, Envisioning a Sustainable Future (Donella Meadows et al. 1992) -Despite limitations, computer models are an effective means for exploring possible future scenarios. © Brooks/Cole Publishing Company / ITP
 -Despite limitations, computer models are an effective means for exploring possible future scenarios. © Brooks/Cole Publishing Company / ITP.")
37
Computer Models of Human Population
This computer model projects what might happen if the world's population and economy continue to grow exponentially at 1990 levels. Fig.11–18 © Brooks/Cole Publishing Company / ITP

38
Computer Models of Human Population
This computer model projects how we can avoid overshoot and collapse to make a fairly smooth transition to a sustainable future by stabilizing fertility at two children per couple. Fig.11–19 © Brooks/Cole Publishing Company / ITP

39
Demographic Transition
Demographic transition- a generalized model that explains how death rates fall before birth rates when a country becomes industrialized. Fig.11–20 © Brooks/Cole Publishing Company / ITP

40
Demographic Transition
1) Preindustrial Stage: both birth and death rates are relatively high (harsh living conditions) and approximately equal, such that the population does not increase, and the population size is small. Fig.11–20 © Brooks/Cole Publishing Company / ITP
 Preindustrial Stage: both birth and death rates are relatively high (harsh living conditions) and approximately equal, such that the population does not increase, and the population size is small. Fig.11–20. © Brooks/Cole Publishing Company / ITP.")
41
Demographic Transition
2) Transitional Stage: The population grows rapidly b/c death rate decreases markedly due to industrialization, increased food production, and improved health care. Birth rates remain relatively high, so the population grows rapidly. Fig.11–20 © Brooks/Cole Publishing Company / ITP
 Transitional Stage: The population grows rapidly b/c death rate decreases markedly due to industrialization, increased food production, and improved health care. Birth rates remain relatively high, so the population grows rapidly. Fig.11–20. © Brooks/Cole Publishing Company / ITP.")
42
Demographic Transition
3) Industrial Stage: Birth rate drops and eventually approaches a balance with death rate, leading to a slowing of population growth. Fig.11–20 © Brooks/Cole Publishing Company / ITP
 Industrial Stage: Birth rate drops and eventually approaches a balance with death rate, leading to a slowing of population growth. Fig.11–20. © Brooks/Cole Publishing Company / ITP.")
43
Demographic Transition
4) Postindustrial Stage: Birth rate and death rates approximately balance, zero population growth (ZPG) is attained, and the population stabilizes at a size much higher than the preindustrial size. If birth rate declines below death rate negative population growth may even be attained. Fig.11–20 © Brooks/Cole Publishing Company / ITP
 Postindustrial Stage: Birth rate and death rates approximately balance, zero population growth (ZPG) is attained, and the population stabilizes at a size much higher than the preindustrial size. If birth rate declines below death rate negative population growth may even be attained. Fig.11–20. © Brooks/Cole Publishing Company / ITP.")
44
Demographic Transition
Most developing countries are in the transitional stage because death rates have fallen. Some analysts believe that some of the conditions needed the developing countries to develop are no longer available. Skilled workers to compete in today’s economy Capital and resources for economic development Some have a sharp rise in debt to other countries, leaving little for improvement Receive less economic assistance since 1980’s Demographic transition at hippocampus.org

45
Pre-industrial Transitional Industrial Post-industrial

46
4. Case Studies Immigration in the U.S.
As TFR decreases, immigration has become a major source of population increase In 1998 we received about 935,000 legal immigrants and 400,000 illegal--40% of our annual population growth! Working immigrants boost the economy in the long run Increasing levels of legal and illegal are expected. The TFR of immigrants in the U.S. is greatly higher than those of the rest of the population

47
Case Studies: India Population control in India
In 1952 India began the first national family planning program The program has been disappointing because of poor planning, inefficiency, low status of women, extreme poverty, and lack of funds Couples still have an average of 3.5 children because of the belief that they need children to work and care for them in old age. TFR 2.74 in 2008

48
Case Studies: China Population control in China:
Since 1970, with the world's largest population, has initiated efforts to better feed its people and control population growth Family planning successful Strict population control measures prevent couples from having more than one child Although considered coercive, the policy is significantly slowing population growth. TFR 1.77 in 2008

49
India China Percentage of world 17% population 20% Population
1.1 billion 1.3 billion Population (2025) (estimated) 1.4 billion 1.4 billion Illiteracy (%of adults) 47% 17% Population under age 15(%) 36% 22% Population growth rate (%) 1.7% 0.6% Total fertility rate 3.1 children per woman (down from 5.3 in 1970) 1.7 children per woman (down from 5.7 in 1972) Infant mortality rate 64 32 Life expectancy 62 years 71 years GDP PPP per capita $2,650 $4,520
 (estimated) 1.4 billion. 1.4 billion. Illiteracy (%of adults) 47% 17% Population under age 15(%) 36% 22% Population growth rate (%) 1.7% 0.6% Total fertility rate. 3.1 children per woman (down from 5.3 in 1970) 1.7 children per woman (down from 5.7 in 1972) Infant mortality rate Life expectancy. 62 years. 71 years. GDP PPP per capita. $2,650. $4,520.")
50
Family Planning Worldwide
Provide info about prenatal care Help parents space births Help parents regulate family size Globally family planning: Raised the use of modern contraception by married women in LDC’s from 10% in 1960’s to 50% in 2004 Responsible for at least 55% of the drop in TFR’s in LDC’s from 6 in 1960 to 3.1 in 2004

51
5. Human Population and Sustainability
How can governments reduce population growth? -Improve access to family planning -Improve heath care for infants, children, and pregnant women -Encourage development of national population policies -Improve equality between men and women -Increase access to education, especially for girls -Increase the involvement of men in child rearing and family planning -Reduce poverty -Reduce and eliminate unsustainable patterns of production and consumption. © Brooks/Cole Publishing Company / ITP

52
Women Empowerment and Sustainability
Three factors that lead to women having fewer, healthier children Education Job outside home Equal rights Women do 60-80% of the work associated with growing food, gathering fuel and hauling water in rural areas

53
Women Empowerment and Sustainability
Globally women account for 2/3 of all hours worked but…. Receive only 10% of the world’s income Own 2% of the world’s land Receive a low status of care…. Approximately 39,000 BABY girls in China die EVERY YEAR (3250/month) due to lack of treatment that their male counterparts normally receive. Girls in India from 1 to 5 years old die more often than 50% of their male counterparts. Equality would slow population growth, promote freedom, reduce poverty and slow environmental degradation. Women in India
 due to lack of treatment that their male counterparts normally receive. Girls in India from 1 to 5 years old die more often than 50% of their male counterparts. Equality would slow population growth, promote freedom, reduce poverty and slow environmental degradation. Women in India.")
54
6. Risks and Hazards Risk- the possibility of suffering harm from a hazard that can cause injury, disease, economic loss or environmental damage. -Risk expressed as a probability (1 in 250) -Risk assessment- using data, hypotheses and models to estimate the probability of harm to human health, society, or the environment that may result from exposure to specific hazards -Risk management- deciding how or whether to reduce a possible risk to a certain level and at what cost. © Brooks/Cole Publishing Company / ITP
 -Risk assessment- using data, hypotheses and models to estimate the probability of harm to human health, society, or the environment that may result from exposure to specific hazards. -Risk management- deciding how or whether to reduce a possible risk to a certain level and at what cost. © Brooks/Cole Publishing Company / ITP.")
55
Major Hazards There are four major types of hazards:
-Chemical hazards from harmful chemicals in air, water, soil and food…already discussed in Ch 3 -Cultural hazards, such as unsafe working conditions, smoking, poor diet, drugs, drinking, driving, criminal assault, unsafe sex and poverty. -Physical hazards, such as noise, fire, tornadoes, hurricanes, earthquakes, volcanic eruptions, floods and ionizing radiation. -Biological hazards from pathogens, pollen and other allergens and animals, such as bees and poisonous snakes. © Brooks/Cole Publishing Company / ITP

56
Cultural Hazards Tobacco use is the leading cause of preventable death (data from 1993). © Brooks/Cole Publishing Company / ITP

57
Physical Hazards Map of expected damage from earthquakes.
Preventing loss: -Understand where risk is high -Establish building codes to regulate placement and design of buildings in high risk areas -Determine if prediction is feasible. © Brooks/Cole Publishing Company / ITP

58
Physical Hazards Ionizing radiation has enough energy to damage body tissues.

59
Biological Hazards Biological hazards include both non-transmissible and transmissible diseases. -Non-transmissible diseases- those not passed from one person to another (diabetes, emphysema and malnutrition) -Transmissible diseases- caused by bacteria, viruses, protozoa, or parasites, and can be passed from one person to another (colds, flus, hepatitis, STD’s, malaria) -Globalization is increasing the spread of some transmissible diseases (Lyme disease carried by ticks and spread by people is now widespread over North America) © Brooks/Cole Publishing Company / ITP
 -Transmissible diseases- caused by bacteria, viruses, protozoa, or parasites, and can be passed from one person to another (colds, flus, hepatitis, STD’s, malaria) -Globalization is increasing the spread of some transmissible diseases (Lyme disease carried by ticks and spread by people is now widespread over North America) © Brooks/Cole Publishing Company / ITP.")
60
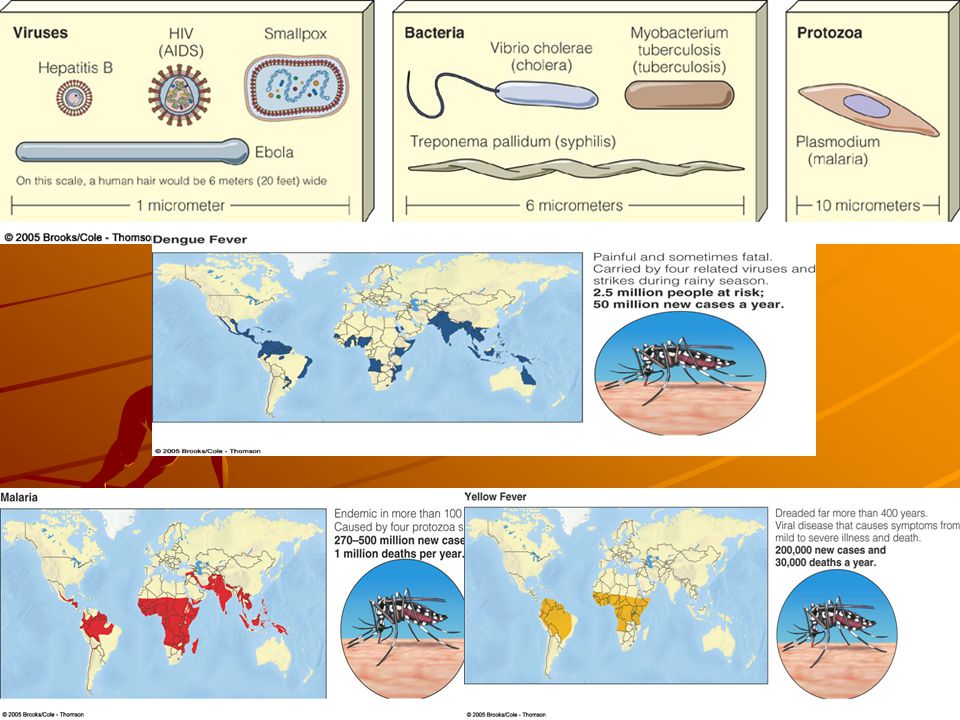
7 Deadliest Infectious Diseases

62
Biological Hazards The complex life cycle of Plasmodium, a 500,000 year old protist that causes malaria, involves transmission between infected individuals by Anopheles mosquitoes . Malaria Video © Brooks/Cole Publishing Company / ITP

63
Biological Hazards Worldwide distribution of malaria today (red) and its projected distribution in 2046 (orange). If the world becomes warmer, as projected by current climate models, by 2046 malaria could affect 60% of the world’s population. © Brooks/Cole Publishing Company / ITP
 and its projected distribution in 2046 (orange). If the world becomes warmer, as projected by current climate models, by 2046 malaria could affect 60% of the world’s population. © Brooks/Cole Publishing Company / ITP.")
64
Case Study: Growing Germ Resistance to Antibiotics
1 bacteria can produce 16,777,216 offspring in 24 hours This allows them to become genetically resistant to antibiotics through natural selection Other factors that play a role in the increase in serious infectious bacterial diseases Globalization Overuse of pesticides Overuse of antibiotics

65
Case Study: Growing Germ Resistance to Antibiotics
Overuse of antibiotics 50% prescribed unnecessarily Available in some countries without a prescription In U.S., 75% are fed to livestock. Resistant strains can spread to humans through contact with infected animals Every major disease-causing bacterium now has strains that resist at least one of the roughly 160 existing antibiotics. Antibiotic Resistance Video

66
Case Study: The Global Tuberculosis Threat
TB bacterium kills about 1.7 million people a year and could kill 28 million by 2020 It is an airborne pathogen It has infected 1 in 3 people in the world May be in the body, whether you are sick or not Over ½ the infected people do not know they are infected and do not feel sick Silent global epidemic

67
Case Study: The Global Tuberculosis Threat
Increase in TB caused by Lack of screening and control programs Antibiotic resistance Population growth and urbanization AIDS weakens immune system and allows TB to multiply Can be cured by a combination of 4 inexpensive drugs Must be taken daily for 6-8 months Symptoms disappear, people think they are cured and stop taking their medicine causing disease to recur in more resistant form TB Evolution Movie

68
Viruses HIV (human immunodeficiency virus) transmitted by
Unsafe sex, sharing of needles, infected mother to offspring before or after birth, and exposure to infected blood. Influenza (flu) is transmitted by body fluids and airborne emissions of infected persons 1918 Swine Flu killed 500 million worldwide (20-30 million in U.S.) Today flu kills 1 million per year worldwide (20,000 in the U.S.)
 is transmitted by body fluids and airborne emissions of infected persons Swine Flu killed 500 million worldwide (20-30 million in U.S.) Today flu kills 1 million per year worldwide (20,000 in the U.S.)")
69
Viruses Hepatitis B virus (HBV) damages the liver and is transmitted same way as HIV--vaccine West Nile virus transmitted by mosquitoes that have been feeding on infected birds 2002 Severe Acute Respiratory Syndrome virus (SARS) emerged in China and is easily transmitted. Human Papillomavirus (HPV) causes venereal warts and several types of cancer—50% of all sexually active people will get it in their lifetimes—vaccine Uganda: Out of the Wild HBV Risk Areas
 emerged in China and is easily transmitted. Human Papillomavirus (HPV) causes venereal warts and several types of cancer—50% of all sexually active people will get it in their lifetimes—vaccine. Uganda: Out of the Wild. HBV. Risk Areas.")
70
Viruses Viral infections are harder to fight than infections caused by bacteria and protozoa. Drugs that kill viruses harm the cells of the host Antibiotics are useless and increase genetic resistance in body’s bacteria Main issue is prevention!!!! Vaccines stimulate the immune system to produce antibodies to ward off viral infections and help reduce the spread of viral diseases Polio, influenza, measles, smallpox, rabies, and hep B. Many viral diseases do not have vaccines like HIV

71
Biological Hazards Generalized model of the epidemiological transition that may take place as countries become more industrialized. © Brooks/Cole Publishing Company / ITP

72
Biological Hazards What are some ways we reduce infectious diseases?
-Reduce overcrowding, unsafe drinking water, poor sanitation, inadequate health care systems, malnutrition and poverty -Increase funding for disease monitoring -Reduce antibiotic use to prevent evolution of resistant organisms -Protect biodiversity as a means of reducing disease spread -Increase research. -Careful hand washing

Similar presentations


 Estimated 2.4 billion more people by 2050 Are there.>")
 G. Tyler Miller’s.>")


