Download presentation
Presentation is loading. Please wait.

1
Fitting

2
Choose a parametric object/some objects to represent a set of tokens Most interesting case is when criterion is not local –can’t tell whether a set of points lies on a line by looking only at each point and the next. Three main questions: –what object represents this set of tokens best? –which of several objects gets which token? –how many objects are there? (you could read line for object here, or circle, or ellipse or...)
.")
3
Line fitting can be max. likelihood - but choice of model is important

4
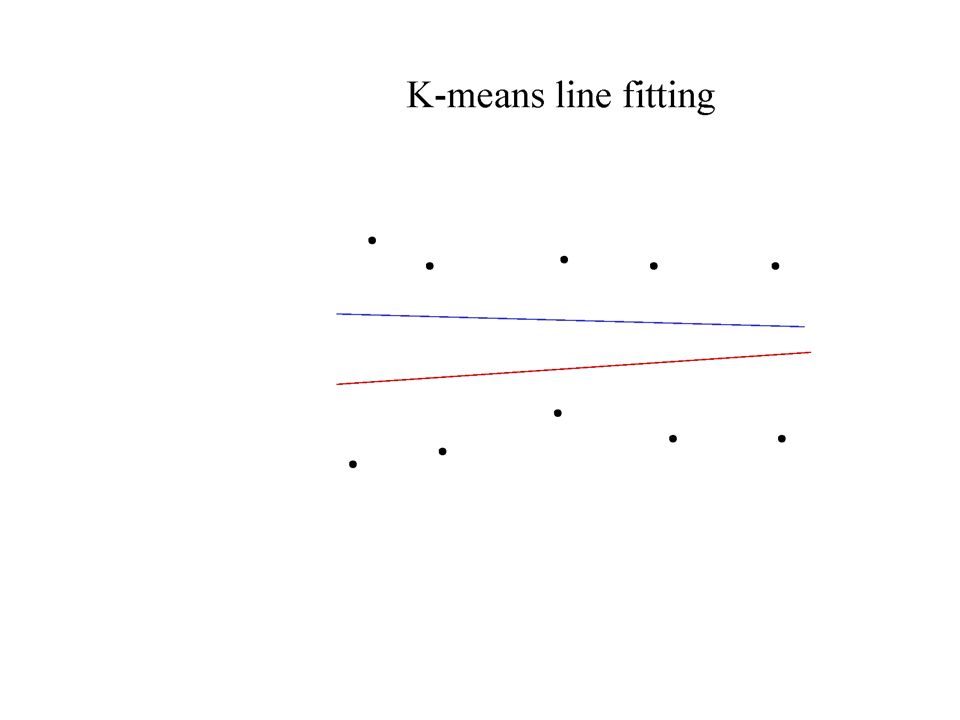
Who came from which line? Assume we know how many lines there are - but which lines are they? –easy, if we know who came from which line Three strategies –Incremental line fitting –K-means –Probabilistic (later!)
.")
19
Robustness As we have seen, squared error can be a source of bias in the presence of noise points –One fix is EM - we’ll do this shortly –Another is an M-estimator Square nearby, threshold far away –A third is RANSAC Search for good points

24
M-estimators Generally, minimize whereis the residual

28
Too small

29
Too large

31
RANSAC Choose a small subset uniformly at random Fit to that Anything that is close to result is signal; all others are noise Refit Do this many times and choose the best Issues –How many times? Often enough that we are likely to have a good line –How big a subset? Smallest possible –What does close mean? Depends on the problem –What is a good line? One where the number of nearby points is so big it is unlikely to be all outliers

33
Distance threshold Choose t so probability for inlier is α (e.g. 0.95) Often empirically Zero-mean Gaussian noise σ then follows distribution with m =codimension of model (dimension+codimension=dimension space) CodimensionModelt 2 1line,F3.84σ 2 2H,P5.99σ 2 3T7.81σ 2
 Often empirically Zero-mean Gaussian noise σ then follows distribution with m =codimension of model (dimension+codimension=dimension space) CodimensionModelt 2 1line,F3.84σ 2 2H,P5.99σ 2 3T7.81σ 2.")
34
How many samples? Choose N so that, with probability p, at least one random sample is free from outliers. e.g. p=0.99 proportion of outliers e s5%10%20%25%30%40%50% 2235671117 33479111935 435913173472 54612172657146 64716243797293 748203354163588 8592644782721177

35
Acceptable consensus set? Typically, terminate when inlier ratio reaches expected ratio of inliers

36
Adaptively determining the number of samples e is often unknown a priori, so pick worst case, e.g. 50%, and adapt if more inliers are found, e.g. 80% would yield e =0.2 –N=∞, sample_count =0 –While N >sample_count repeat Choose a sample and count the number of inliers Set e=1-(number of inliers)/(total number of points) Recompute N from e Increment the sample_count by 1 –Terminate
/(total number of points) Recompute N from e Increment the sample_count by 1 –Terminate.")
37
Step 1. Extract features Step 2. Compute a set of potential matches Step 3. do Step 3.1 select minimal sample (i.e. 7 matches) Step 3.2 compute solution(s) for F Step 3.3 determine inliers until (#inliers,#samples)<95% #inliers90%80%70%60%50% #samples51335106382 Step 4. Compute F based on all inliers Step 5. Look for additional matches Step 6. Refine F based on all correct matches (generate hypothesis) (verify hypothesis) RANSAC for Fundamental Matrix
 Step 3.2 compute solution(s) for F Step 3.3 determine inliers until (#inliers,#samples)<95% #inliers90%80%70%60%50% #samples Step 4. Compute F based on all inliers Step 5. Look for additional matches Step 6. Refine F based on all correct matches (generate hypothesis) (verify hypothesis) RANSAC for Fundamental Matrix.")
38
Step 1. Extract features Step 2. Compute a set of potential matches Step 3. do Step 3.1 select minimal sample (i.e. 7 matches) Step 3.2 compute solution(s) for F Step 3.3 Randomize verification 3.3.1 verify if inlier while hypothesis is still promising while (#inliers,#samples)<95% Step 4. Compute F based on all inliers Step 5. Look for additional matches Step 6. Refine F based on all correct matches (generate hypothesis) (verify hypothesis) Randomized RANSAC for Fundamental Matrix
 Step 3.2 compute solution(s) for F Step 3.3 Randomize verification verify if inlier while hypothesis is still promising while (#inliers,#samples)<95% Step 4. Compute F based on all inliers Step 5. Look for additional matches Step 6. Refine F based on all correct matches (generate hypothesis) (verify hypothesis) Randomized RANSAC for Fundamental Matrix.")
39
Example: robust computation Interest points (500/image) (640x480) Putative correspondences (268) (Best match,SSD<20,±320) Outliers (117) (t=1.25 pixel; 43 iterations) Inliers (151) Final inliers (262) (2 MLE-inlier cycles; d =0.23→d =0.19; Iter Lev-Mar =10) #in 1-e adapt. N 62%20M 103%2.5M 4416%6,922 5821%2,291 7326%911 15156%43 from H&Z

40
More on robust estimation LMedS, an alternative to RANSAC (minimize Median residual in stead of maximizing inlier count) Enhancements to RANSAC –Randomized RANSAC –Sample ‘good’ matches more frequently –… RANSAC is also somewhat robust to bugs, sometimes it just takes a bit longer…
 Enhancements to RANSAC –Randomized RANSAC –Sample ‘good’ matches more frequently –… RANSAC is also somewhat robust to bugs, sometimes it just takes a bit longer…")
41
Fitting curves other than lines In principle, an easy generalisation –The probability of obtaining a point, given a curve, is given by a negative exponential of distance squared In practice, rather hard –It is generally difficult to compute the distance between a point and a curve

Similar presentations


>")


 1.Computable from corresponding points.>")


