Download presentation
Presentation is loading. Please wait.

1
THE HEART

2
Anatomy In pericardial sac –w/in mediastinum Four muscular chambers (Fig.22-1) –Walls (Fig.22-2) Myocardium -- thickest layer –Muscle fibers Endocardium –Internal lining –Continuous with internal tissue layer of vessels
 –Walls (Fig.22-2) Myocardium -- thickest layer –Muscle fibers Endocardium –Internal lining –Continuous with internal tissue layer of vessels")
3
Anatomy – cont’d –L, R ventricles – pumping At bottom About 60% of heart volume Left ventricle (LV) largest chamber –L, R atria - "priming" At top Thinner muscle layer than ventricles
 largest chamber –L, R atria - priming At top Thinner muscle layer than ventricles")
5
Anatomy – cont’d Path of blood flow (Fig.22-3) –Vena cava RA RV lungs LA LV aorta systemic circulation vena cava (and repeat) KNOW THIS!!!
 –Vena cava RA RV lungs LA LV aorta systemic circulation vena cava (and repeat) KNOW THIS!!!")
6
Anatomy – cont’d Valves (Fig.22-4) –Connective tissue covered in endothelium –Continuous with endothelium of heart –Open, close passively in response to ventricular contraction
 –Connective tissue covered in endothelium –Continuous with endothelium of heart –Open, close passively in response to ventricular contraction")
7
Anatomy – cont’d Valves – cont’d –Two types: Atrioventricular – between atria, ventricles –Tricuspid right –Bicuspid (mitral) left Semilunar between ventricles, vessels –Pulmonary right –Aortic left Cardiac Cycle (Fig.22-5) –Ventricular contraction during systole and diastole
 left Semilunar between ventricles, vessels –Pulmonary right –Aortic left Cardiac Cycle (Fig.22-5) –Ventricular contraction during systole and diastole")
10
Factors Affecting Cardiac Performance Cardiac output (C.O.) = heart rate x stroke volume –OR: amount of blood pumped from the ventricle with each contraction (in L/min) Heart rate (h.r.) measured in beats/min –Controlled by ANS Dually innervated Incr’d sympathetic signals incr’d h.r. Parasymp signals decr’d h.r. –In control in resting heart

11
Stroke volume (S.V.) measured in L/beat Dependent on –Contractility Defined – ability of heart muscle to contract –Force of contraction of heart –Afterload Defined – force that opposes ejection of blood For LV, this is aortic blood pressure If afterload incr’d decr’d stroke volume, so decr’d C.O.
 measured in L/beat Dependent on –Contractility Defined – ability of heart muscle to contract –Force of contraction of heart –Afterload Defined – force that opposes ejection of blood For LV, this is aortic blood pressure If afterload incr’d decr’d stroke volume, so decr’d C.O.")
12
–Preload Amount of filling of ventricle during relaxation By Starling’s law: incr’d preload (within limits) incr’d force of contraction incr’d C.O. (Fig.22- 17)
.")
13
Myocytes (cells of heart) -- there are two types: Contractile Fibers (“usual” cardiac muscle cells) –Contract during systole –Have actin and myosin proteins (Fig.22-15) –Contraction w/ sodium, calcium into and w/in muscle cells incr’d Ca +2 inside cell –Ca +2 binds to actin/myosin shift in actin w/ respect to myosin shortening of muscle fiber and contraction (Fig. 22-16)
.")
15
Myocytes – cont’d Conduction system cells –VERY SIMPLISTICALLY: a hybrid of contractile fibers + neuronal cells –Depolarize quickly –Specialized to coordinate and conduct impulses proper timing of contractile fiber contraction in different heart areas

16
Conduction System – cont’d Parts of the conduction system (Fig. 22-11): –SinoAtrial Node (SA) In atrium Receives autonomic input When stimulated, signals atrial contractile fibers atria depolarization and contraction
: –SinoAtrial Node (SA) In atrium Receives autonomic input When stimulated, signals atrial contractile fibers atria depolarization and contraction.")
18
Conduction System – cont’d –AtrioVentricular Node (AV) Between atrium/ventricle Receives signal from SA node –His Bundle (= AV Bundle) Receives signal from AV node Sends signal from top to bottom of heart, between ventricles to:
 Between atrium/ventricle Receives signal from SA node –His Bundle (= AV Bundle) Receives signal from AV node Sends signal from top to bottom of heart, between ventricles to:")
19
Conduction System – cont’d –Bundle Branches Receive signal from His Bundle Branch along sides of ventricles on both sides of heart, sending signal to: –Purkinje Fibers Branch out into ventricles Carry depol’n signal to ventricular contractile fibers ventricledepol’n, contraction

20
ECG measures electrical activity of the heart Sum of electrical impulses in heart (Fig.22-12) P wave – rep’s atrial contraction –Electrical activity = atrial depolarization QRS complex– rep’s ventricular contraction –Electrical activity = ventricular depolarization T wave – rep’s ventricular relaxation –Electrical activity = ventricular repolarization Also impt: times between waves –Rep’s problems with conduction system times –May indicate problems w/ signal coordination, or need for pacemaker
 P wave – rep’s atrial contraction –Electrical activity = atrial depolarization QRS complex– rep’s ventricular contraction –Electrical activity = ventricular depolarization T wave – rep’s ventricular relaxation –Electrical activity = ventricular repolarization Also impt: times between waves –Rep’s problems with conduction system times –May indicate problems w/ signal coordination, or need for pacemaker")
23
Heart Failure Defined: heart as pump is insufficient to meet metabolic requirements of tissues Acute – develops quickly –Approx 65% survival rate Chronic – gradual burden on heart –Most common cause: ischemic heart disease

24
Disorders of Heart Wall Pericarditis –Acute – inflammation of pericardial membrane(s) Caused by –Infection –Diseases of connective tissue –Radiotherapy toughening of membrane
 Caused by –Infection –Diseases of connective tissue –Radiotherapy toughening of membrane")
25
Disorders of Heart Wall – cont’d –Chronic -- may scarring and fibrotic lesions encasing heart (membranes no longer compliant) Also causes incr’d back pressures at veins entering heart, enlargement of liver and/or spleen
 Also causes incr’d back pressures at veins entering heart, enlargement of liver and/or spleen")
26
This is the pericardium separated from the rest of the heart. Note the pinkinsh color of the pericardium. That is a sign of pericarditis. ©www-medlib.med.utah.edu

27
Disorders of Myocardium = Cardiomyopathies REMEMBER: myocardium = heart’s muscle layer Most cases, cause unknown All cases, heart loses ability as pump (because muscle fibers are dysfunctional)
")
28
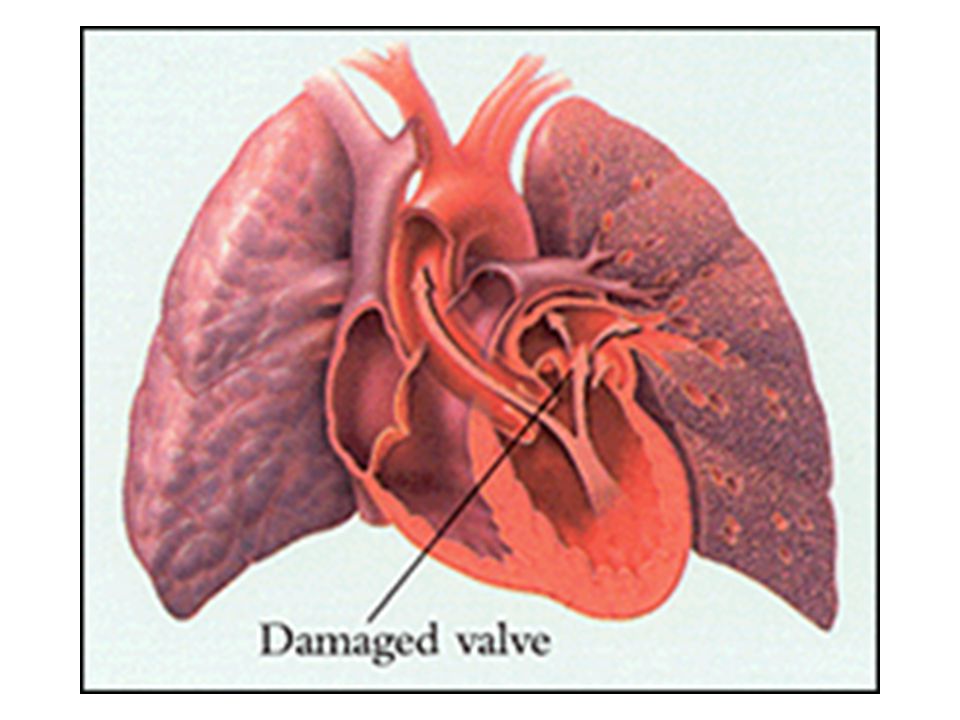
Disorders of Endocardium (Valvular Disease)(Table 23-8) Causes abnormal blood flow across valves and through heart Two types (Fig.23-28): –Too narrow = stenosis –Too leaky = regurgitation (Murmur = turbulent blood flow due to valvular lesions)
(Table 23-8) Causes abnormal blood flow across valves and through heart Two types (Fig.23-28): –Too narrow = stenosis –Too leaky = regurgitation (Murmur = turbulent blood flow due to valvular lesions)")
29
Valvular Diseases – cont’d Overall both types cause –Incr’d cardiac work –Incr’d volume & pressures in heart chambers Leads to –Chamber dilation –Hypertrophy of contractile fibers Compensations to incr heart’s pumping capacity

30
Valvular Diseases – cont’d Once believed due only to rheumatic fever –Strep infection damage of valve tissue by strep microorganism Also, strep antigens appear similar to valve cell proteins autoimmune response

31
Valvular Diseases – cont’d –Results in Adhesions on valves, or Fusion of valve tissues, or Calcification/fibrosis –Other causes now known Congenital disorders Degenerative disorders

32
Valvular Diseases – cont’d Mitral stenosis (Fig.23-29) –Impedes blood flow from LA to LV Most common of valve diseases Decr’d flow from LA to LV during filling LA must pump (hard) to move blood LV Results in hypertrophy of LA –Also, decr’d preload at LV
 –Impedes blood flow from LA to LV Most common of valve diseases Decr’d flow from LA to LV during filling LA must pump (hard) to move blood LV Results in hypertrophy of LA –Also, decr’d preload at LV")
33
Mitral Stenosis – cont’d –Change in pressure between chambers By causing LA to become pump: –Get incr’d pulmonary vascular pressures »So pressures increase through LA into lung – pulmonary congestion – lung tissue changes to accommodate incr’d pressures – increased pressure in pulmonary artery – increased pressure in right heart – right heart failure

34
Mitral stenosis as viewed from the left atrium. The lumen of the valve is markedly narrowed significantly decreasing the amount of blood that can be passed. The yellow and tan vegetations on the valve are secondary calcium and lipid deposits that form in the scar tissue. The surrounding endocardium is white and fibrotic.

35
Mitral Stenosis – cont’d –Clinical Dyspnea = difficulty breathing Tachycardia = increased heart rate –Compensation for lowered C.O. LA pressure

36
Valvular Diseases – cont’d Mitral regurgitation (now same valve but too leaky) –As ventricle contracts, blood goes in two directions: –Get both LA LV and retrograde flow (LV to LA) Blood simultaneously to aorta and back to LA both LV and LA pump harder (move same blood twice) LV hypertrophy and dilation as compensation Compensation works awhile, then decr’d C.O. heart failure

37
Mitral regurgitation – cont’d Also LA hypertrophy –LA can’t protect lungs from incr’d fluid pressures in heart chambers (blood not moved through chambers effectively) increased pressures through lungs incr’d pressures in right heart right heart failure Can see edema, shock
 increased pressures through lungs incr’d pressures in right heart right heart failure Can see edema, shock")
39
Mitral regurgitation – cont’d –Clinical Weakness, fatigue –Why? Dyspnea –Why? Palpitations –If acute, heart can't compensate –Mitral valve prolapse -- common valve disorder (Fig.23-30) Cusps of valve “billow” into atrium Can mitral regurgitation
 Cusps of valve billow into atrium Can mitral regurgitation.")
40
Valvular Diseases – cont’d Aortic stenosis –Blood flow obstructed from LV into aorta during systole Causes incr'd work of LV LV hypertrophy as compensation Results in LV wall stiffening pressure changes between LV, aorta prolonged contractions as compensation Finally heart overwhelmed increased pressures in LA, then lungs, then right heart

41
Aortic stenosis – cont’d –Clinical Angina Syncope LV failure

42
Valvular Diseases – cont’d Aortic regurgitation –Reflux blood from aorta to LV during ventricular relaxation Causes LV to pump more blood w/ each contraction LV hypertrophy –“Globular shape” incr’d pressures in LA, lung, right heart

43
Aortic regurgitation – cont’d –Clinical Palpitations Fatigue Dyspnea Angina

45
Valvular Diseases – cont’d Treatment for all valve disorders: –Antibiotics for strep –Antiinflammatories for autoimmune disorder –Analgesics for pain –Restrict physical activity –Valve replacement surgery

Similar presentations


 Transport O 2, nutrients, hormones, cell wastes, etc…>")

