Download presentation
Presentation is loading. Please wait.

1
National Oceanic and Atmospheric Administration Geophysical Fluid Dynamics Laboratory Princeton, NJ 08542 http://www.gfdl.noaa.gov Evolution of Stratospheric Temperature in Climate Model Simulations John Austin

2
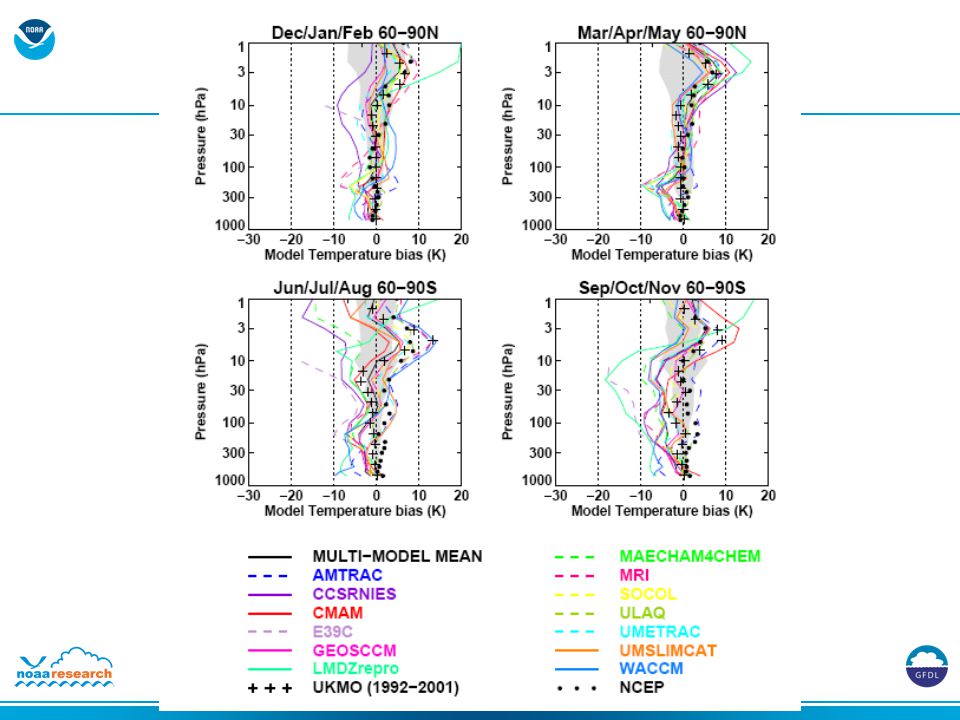
Coupled chemistry-climate model simulations Uniform, observed forcings (solar, GHGs, aerosols, SSTs/sea ice). 12 different models: complete climate models with reasonably complete stratospheric chemistry. Some runs have simplified tropospheric chemistry Some runs include several ensembles Period covered 1960-2050 mostly. Eyring et al. JGR, submitted. CCMval: Description and runs

4
Climatology of the final warming (S)
")
5
Monthly mean 50 hPa T

6
100 hPa seasonal variation

7
GFDL climate model, coupled chemistry 48L model, upper boundary ~ 0.002 hPa Horizontal resolution 2 x 2.5 deg. Finite Volume dynamical core Comprehensive stratospheric chemistry; simplified tropospheric chemistry 3 member ensemble (1) 1960-2005 with observed forcings (2) 1990-2100 with A1B etc. forcings and SSTs from GFDL IPCC runs. AMTRAC: Description and runs
 with observed forcings (2) with A1B etc. forcings and SSTs from GFDL IPCC runs. AMTRAC: Description and runs.")
8
Mean Ozone trend 1980-1999

9
Observed ozone trends 1980-1999 (Randel pers. comm., 2005) Observed ozone trend
 Observed ozone trend")
13
Temperature solar cycle

14
Ozone solar cycle

17
AMTRAC polar spring lower stratosphere temperature evolution 1960-1999

18
AMTRAC polar lower stratospheric temperature evolution, 12-month running mean

19
AMTRAC (colored lines) and observed (black line) global average temperature for 1960 to 2005 weighted in the vertical by the MSU4 weighting function.
 and observed (black line) global average temperature for 1960 to 2005 weighted in the vertical by the MSU4 weighting function.")
20
SOCOL MSU-4 equivalent temperature (25 months running mean) courtesy Schnadt et al.
 courtesy Schnadt et al.")
21
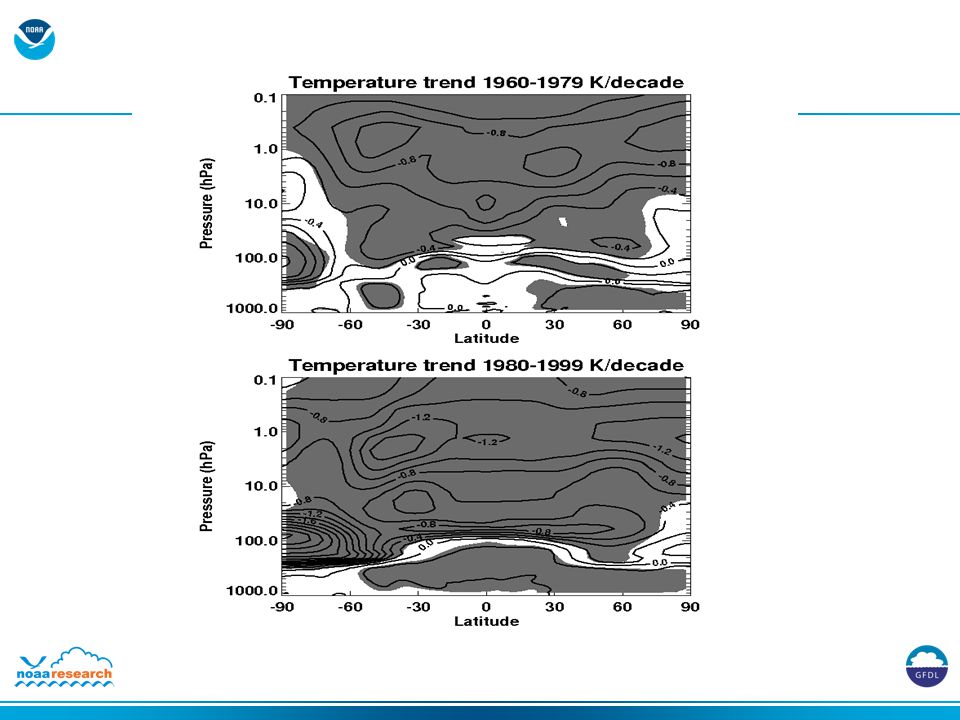
Conclusions Past T trends are in reasonable agreement with observations for the period 1980-2000 in the lower and upper stratosphere. A solar cycle in T occurs in model results, but is smaller than the SSU solar cycle. In the global average, the lower stratosphere temperature evolution agrees well with observations. Tropopause T decreases 1960-2005 (0.16 K/decade) and increases thereafter (not shown) at 0.23 K/decade. Much work is yet to be done within CCMval and on individual models.
 and increases thereafter (not shown) at 0.23 K/decade. Much work is yet to be done within CCMval and on individual models..")
Similar presentations


 2. Weighting functions.>")

; disentangling solar and volcanic signals.>")


>")


, Gus Correa (LDEO), Larry Horowitz (NOAA/GFDL), Vaishali Naik (UCAR/GFDL)>")
>")


