Download presentation
Presentation is loading. Please wait.

1
Tropical storms Classification Development Trajectories Forecasting Hazards Future prospects

2
Tropical disturbances, etc.

3
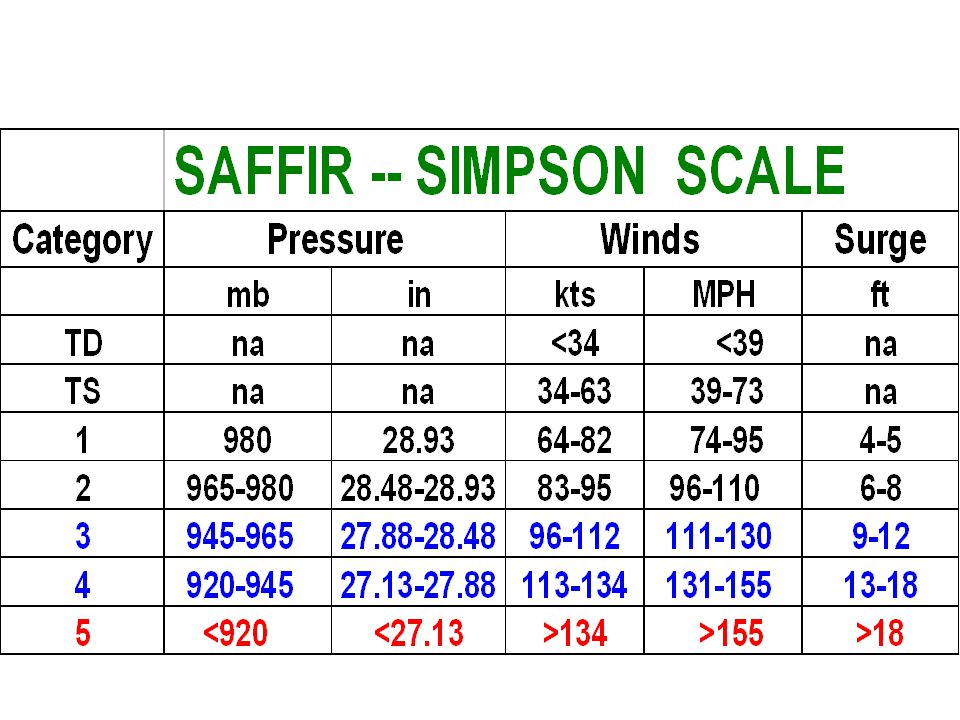
Saffir-Simpson scale

4
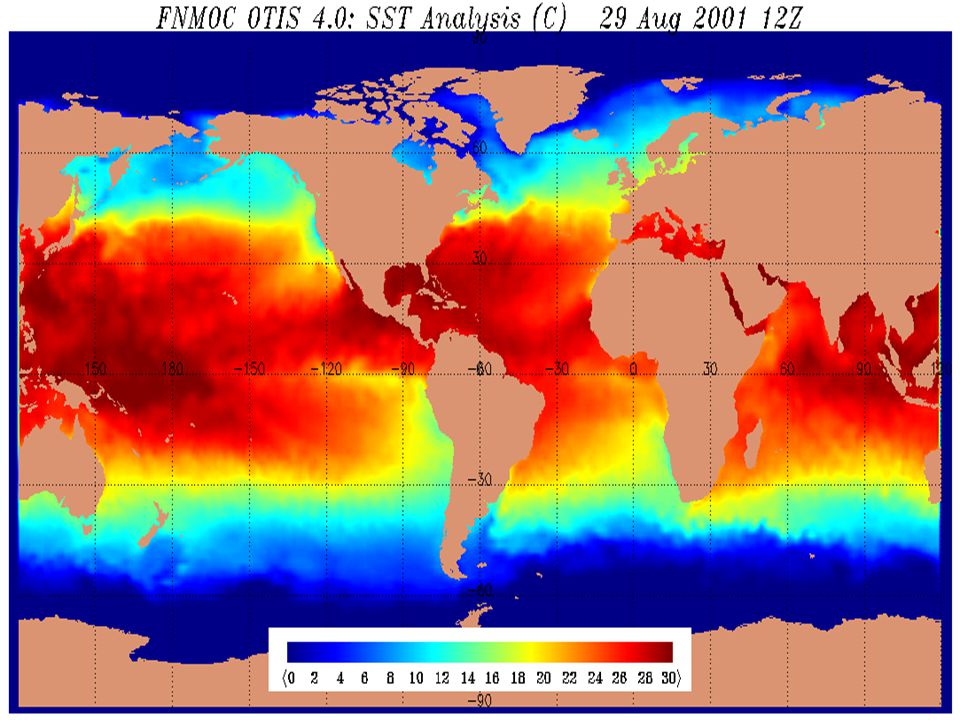
Spawning areas for tropical storms (SST >27°C)
")
5
Tropical storm genesis: convergence behind an easterly wave In a typical hurricane season some 60 easterly waves develop in the North Atlantic. Only about 1 wave in 5 becomes a tropical depression. Strong upper level troughs and westerly winds commonly suppress hurricane formation

6
Mature hurricane Development fostered by release of heat from condensed water in bands of clouds around the tropical storm centre more rapid convergence and updrafts. This +ve feedback leads to intensification and hurricane formation.

7
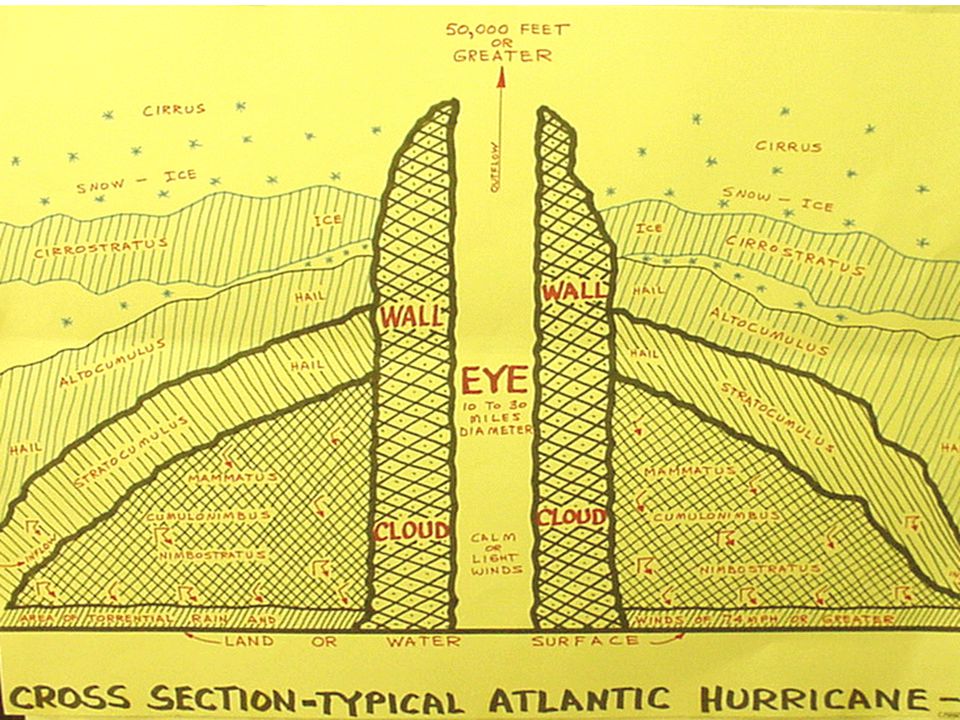
Structure of Hurricane Gilbert (Doppler radar cross-section )
")
8
The Atlantic hurricane season (Dr. William Gray @ Colorado State U.) Strong El Niño suppresses hurricanes (but 1998?) Wet springs inhibit hurricanes Strong Azores High inhibits hurricanes Strong stratospheric easterlies suppress hurricanes Low SST’s inhibits hurricanes
 Strong El Niño suppresses hurricanes (but 1998 ) Wet springs inhibit hurricanes Strong Azores High inhibits hurricanes Strong stratospheric easterlies suppress hurricanes Low SST’s inhibits hurricanes.")
9
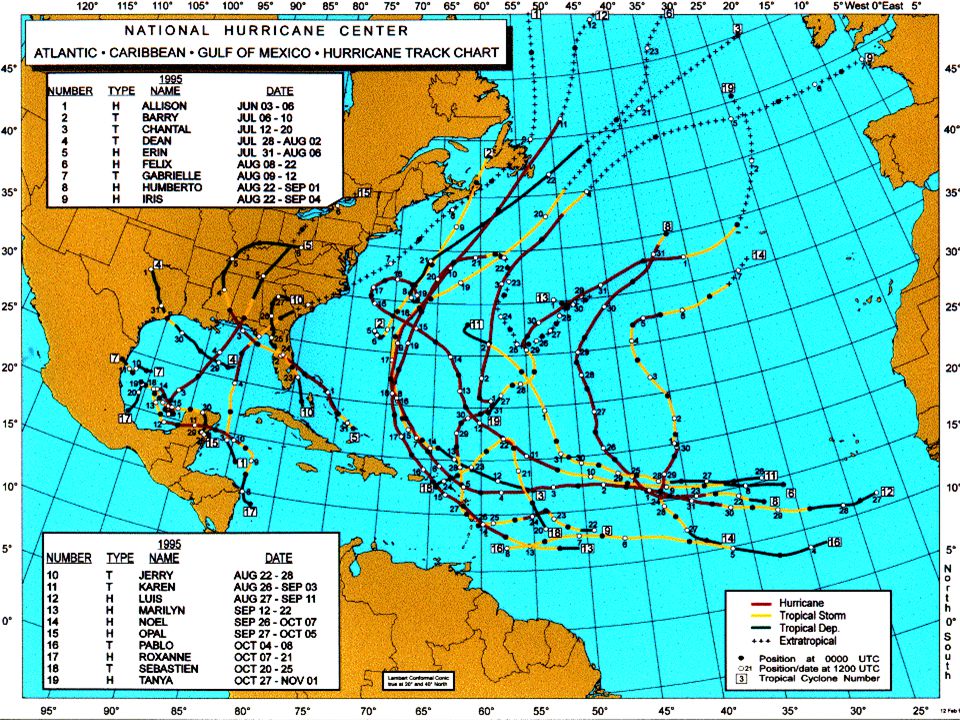
Atlantic hurricanes (1995 season)
")
10
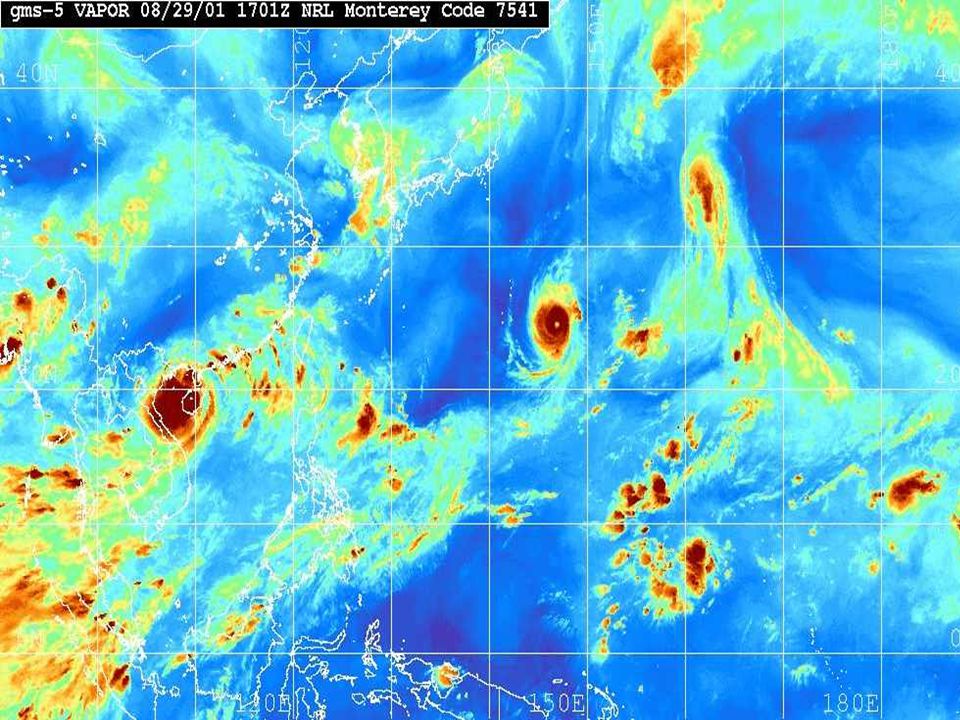
Tracks of typhoons affecting the China Sea region

11
Tracks of cyclones in the northern Indian Ocean

12
Effects of travelling high and low pressure systems on hurricane paths

13
Hurricane Andrew (1992)
")
14
Hurricanes - examples of unpredictability

17
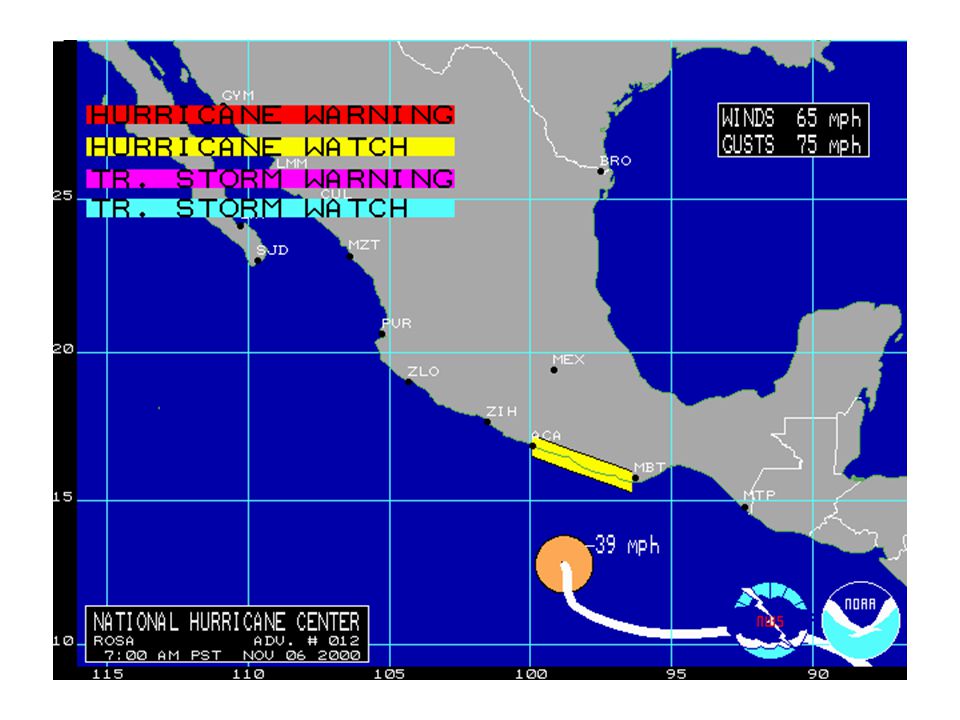
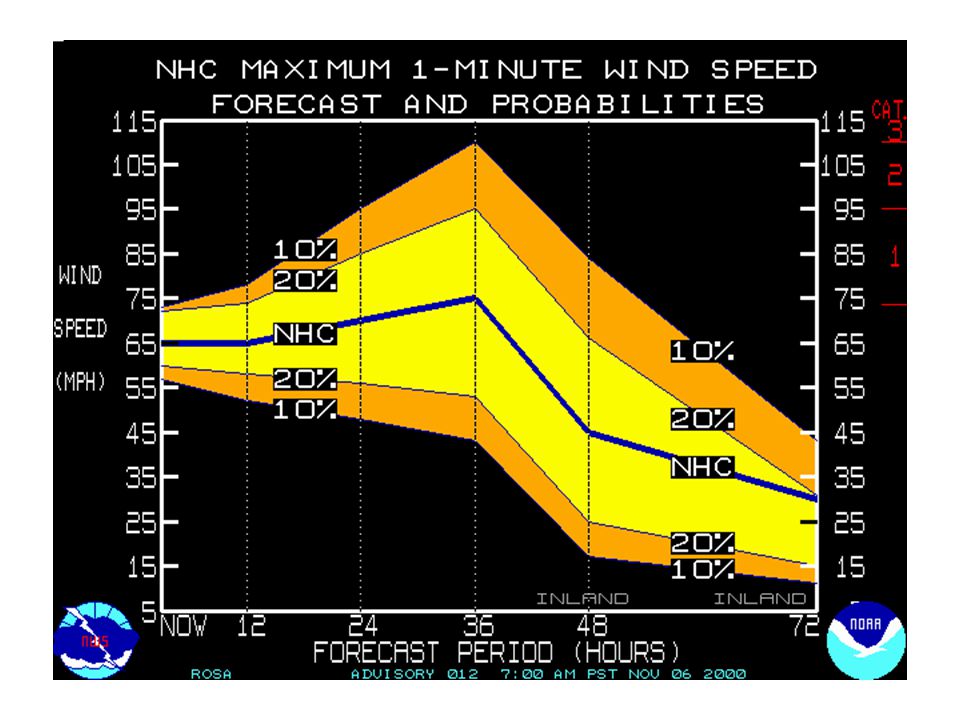
Forecasting NHC (Miami) uses nine tracking and intensity models to forecast hurricane movement. Seven models based on global climate forecasts; two (NHC90/91 and CLIPER) based on statistical analyses of past hurricane trajectories. Forecasts are for 12h, 24h, 36h, 48h and 72h ahead and are updated at 4h intervals. Some models are used for ‘early’ stages; others for ‘late’ (i.e. close to landfall). Average errors vary from ocean to ocean, depending on typical recurvature (Atlantic errors are large)
 based on statistical analyses of past hurricane trajectories. Forecasts are for 12h, 24h, 36h, 48h and 72h ahead and are updated at 4h intervals. Some models are used for ‘early’ stages; others for ‘late’ (i.e. close to landfall). Average errors vary from ocean to ocean, depending on typical recurvature (Atlantic errors are large).")
18
Mean error (nm) for Atlantic hurricanes (1996-97 seasons) Forecast model
 for Atlantic hurricanes ( seasons) Forecast model")
19
The geography of forecasting error 72 h 48 h 24 h

20
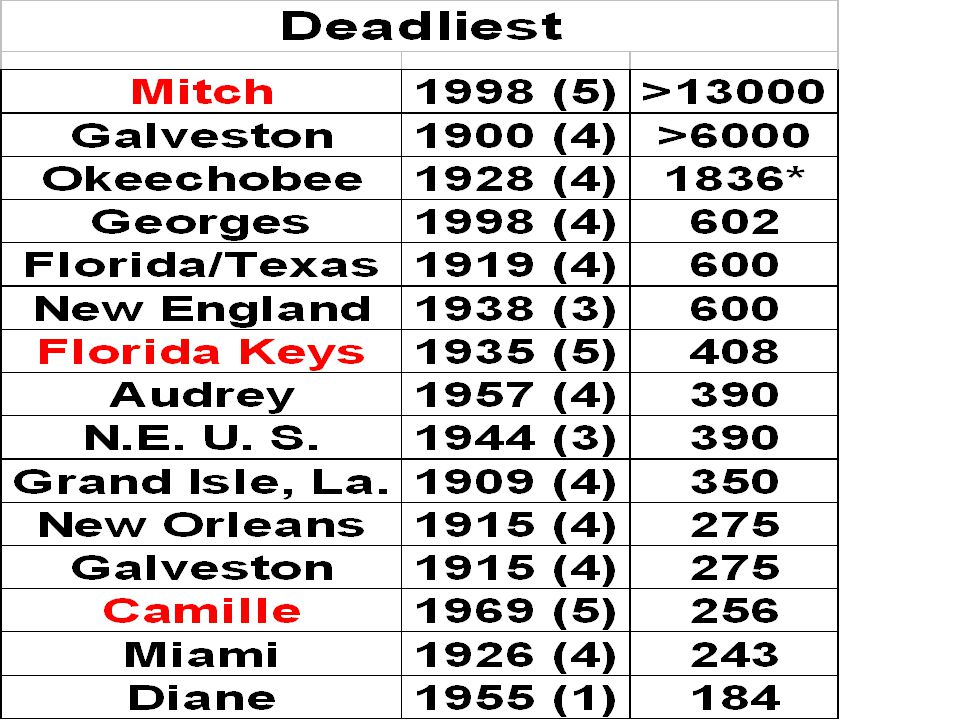
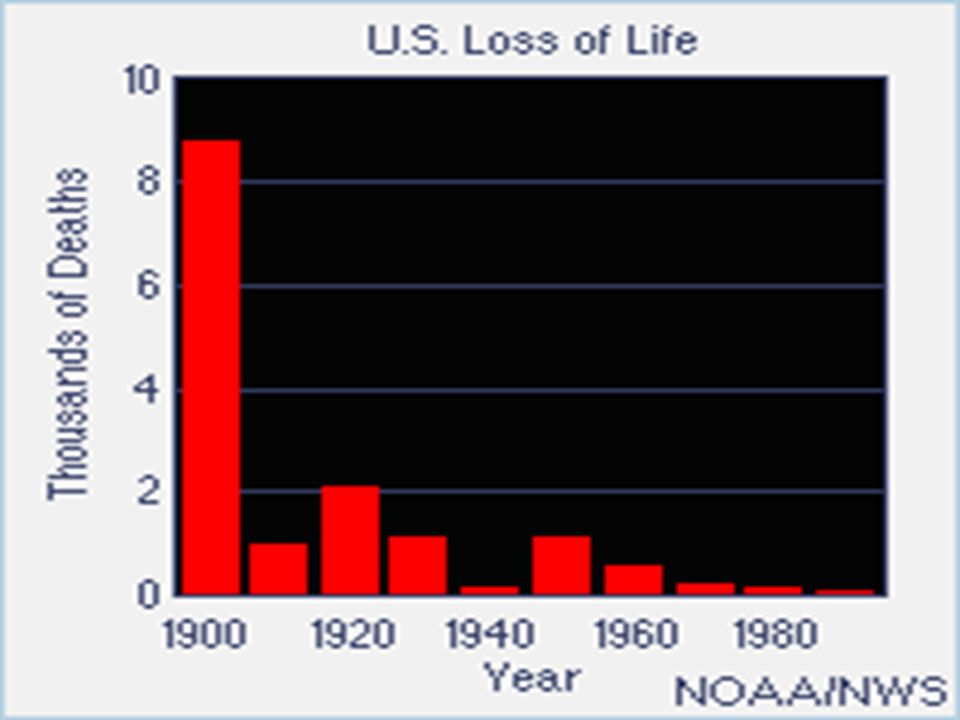
Estimated annual deaths from hurricanes in the USA

21
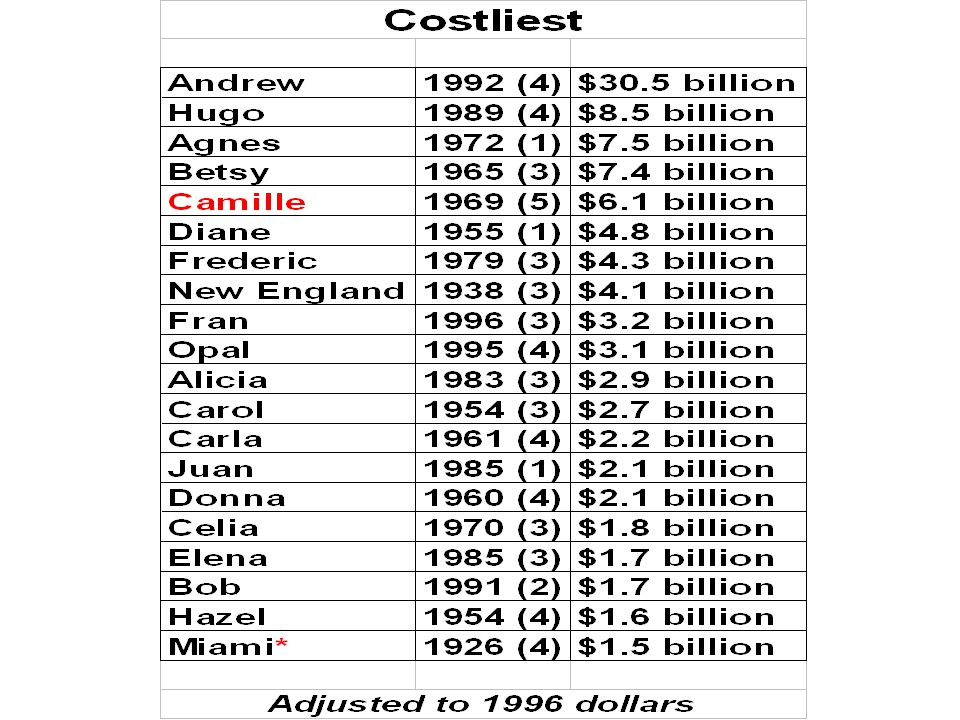
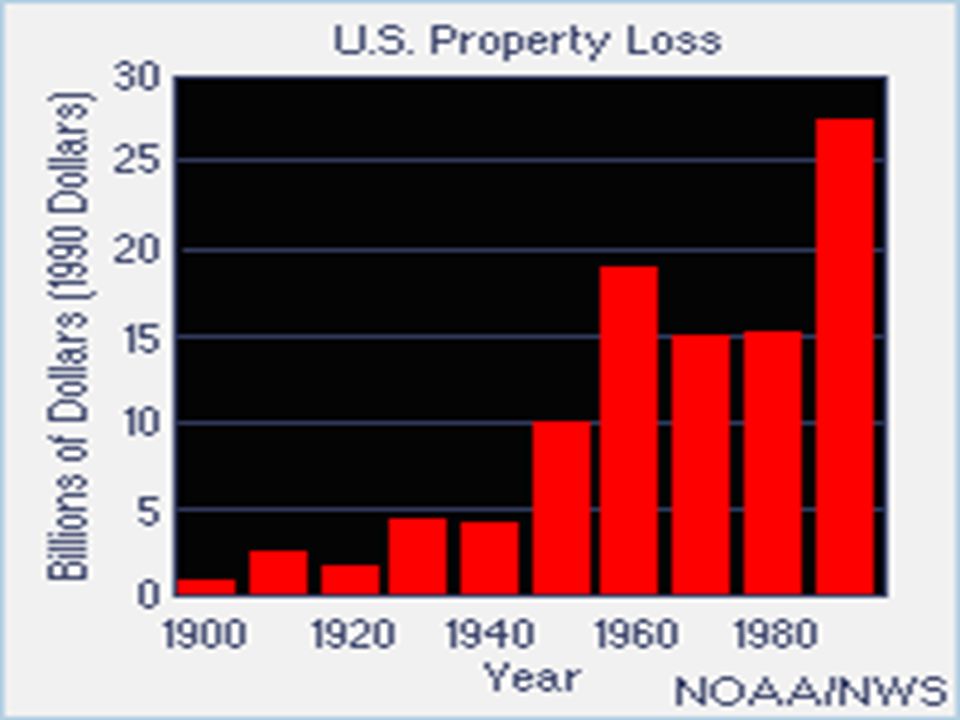
Damages from hurricanes in the USA ($ billions)
")
22
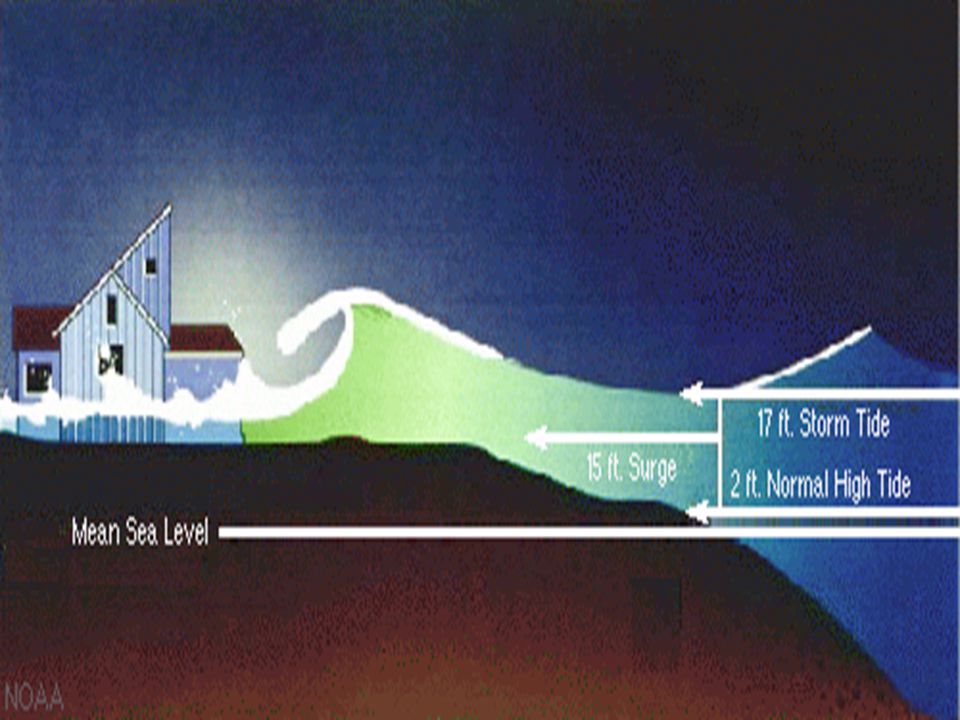
Hurricane hazards Storm surge (5-6m common) High winds (see Saffir-Simpson) Intense rainfall Increasing population at risk (80% of residents of Florida =8M people live within 8 km of coast; 3M within storm surge zone) X New Orleans (-2m elev.) ~72h to evacuate 1.6M residents. Old and poor (~100 000) who rely on public transport present a major problem. Solution: move them to high floors of skyscrapers?
 who rely on public transport present a major problem. Solution: move them to high floors of skyscrapers .")
23
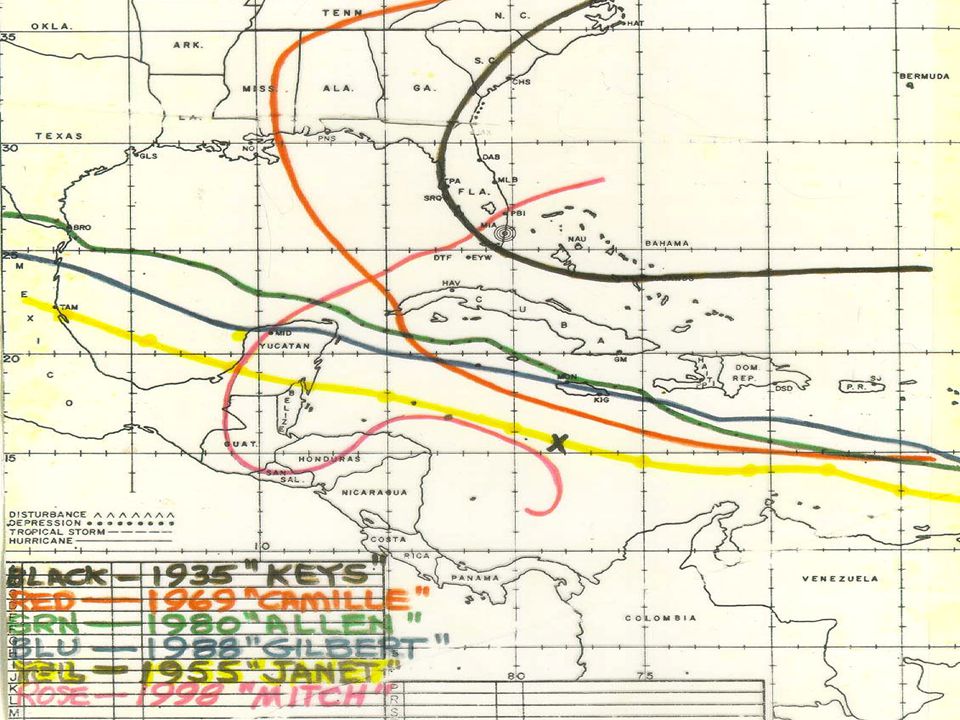
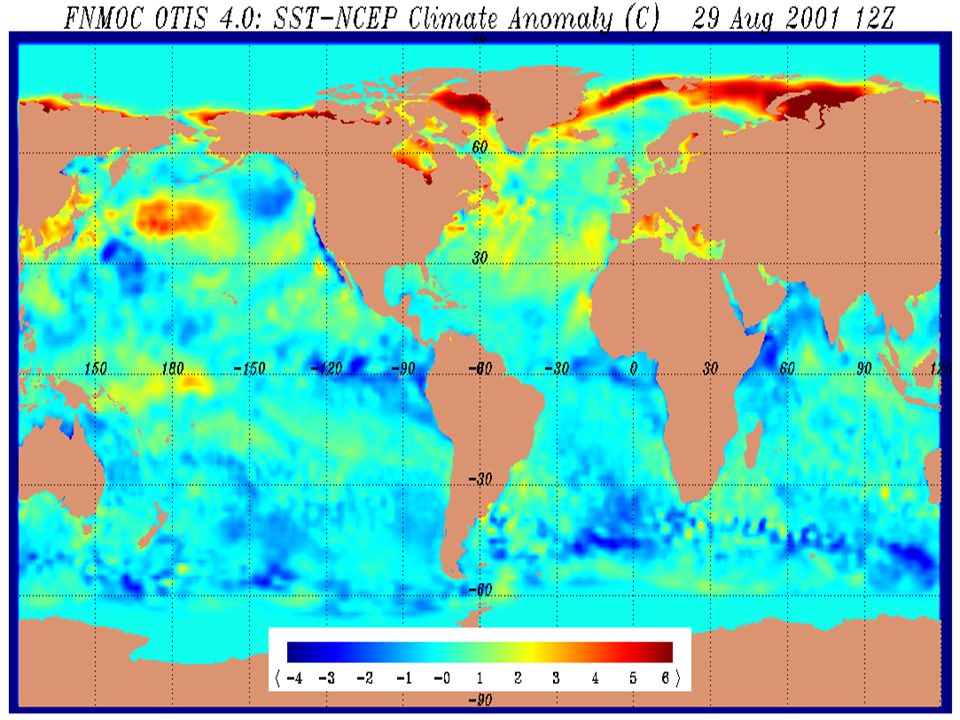
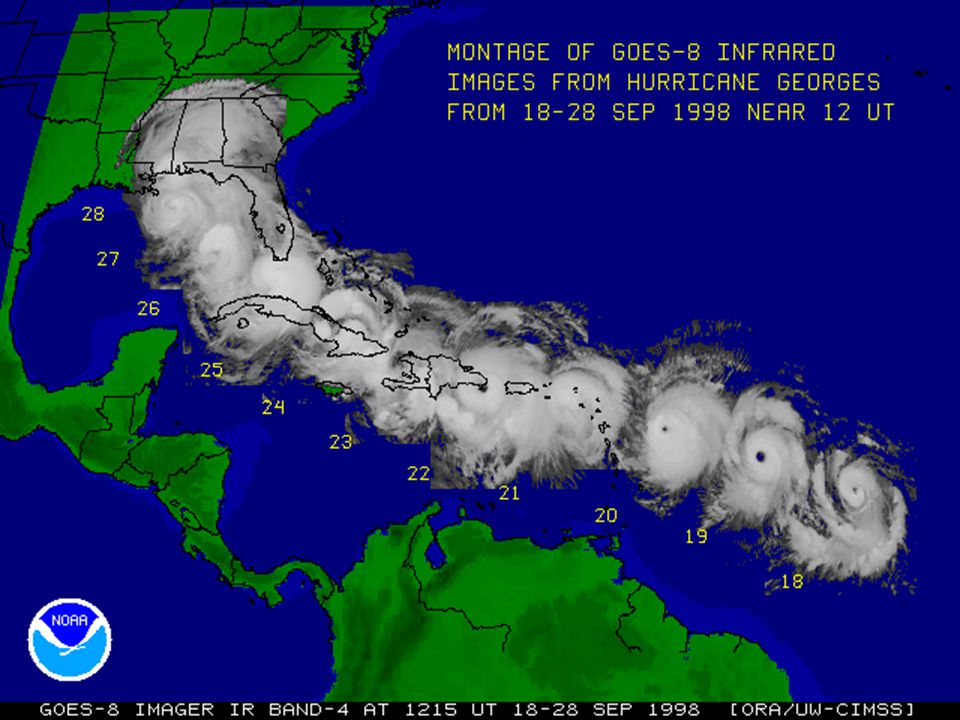
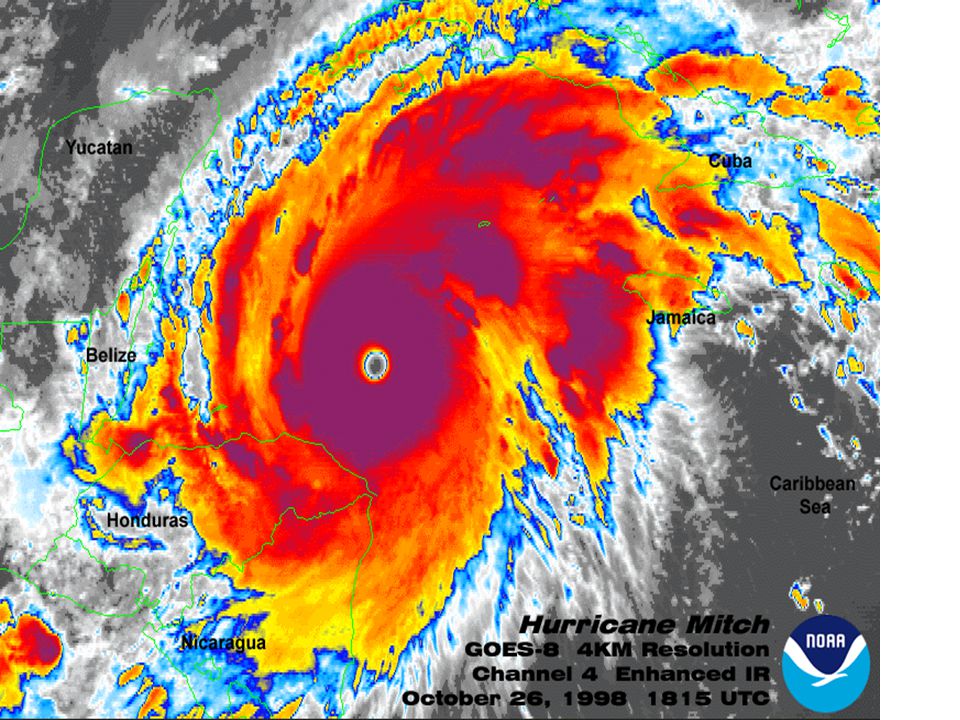
El Niño events and tropical storm activity (e.g. 1998 El Niño) PACIFIC OCEAN - 14 tropical storms in E. Pacific ; 9 developed into hurricanes. ATLANTIC OCEAN - 14 tropical storms; 10 developed into hurricanes. H. George: most powerful storm in ~200 yrs; hit Puerto Rico, Virgin Is., Domincan Rep., Florida and US Gulf coast - 300 deaths, $5G in damage. H. Mitch: most destructive storm in ~200 yrs; hit Nicaragua - Guatemala - >13 000 dead or missing, $5G in damage.
 PACIFIC OCEAN - 14 tropical storms in E. Pacific ; 9 developed into hurricanes. ATLANTIC OCEAN - 14 tropical storms; 10 developed into hurricanes. H. George: most powerful storm in ~200 yrs; hit Puerto Rico, Virgin Is., Domincan Rep., Florida and US Gulf coast deaths, $5G in damage. H. Mitch: most destructive storm in ~200 yrs; hit Nicaragua - Guatemala - > dead or missing, $5G in damage..")
24
Global warming and tropical storm activity Emanual (MIT) forecasts: 1. that the hurricane season will be extended by 2 months or more in the North Atlantic and Caribbean. 2. that hurricane intensity will increase by more than 50% - attaining maximum wind speeds of >300 km/h (cf. >200 km/h at present).
..")
25
HURRICANE SEASON 2001 12 - 7 - 3 12 NAMED STORMS 7 HURRICANES 3 MAJOR STORMS

26
1995-2000 MOST ACTIVE 6 YEARS ON RECORD 79 NAMED STORMS 49 HURRICANES 24 MAJOR STORMS

30
PB4Y-2 PRIVATEER(Hurricane Hunter) Lost, Hurricane JANET - 1955
 Lost, Hurricane JANET")
31
COSMOSPHERE-HURRICANE SUN PROVIDES HEAT

35
ATMOSPHERE-HURRICANE

36
SST 26.5C OR MORE DEEP TO A LEAST 46 METERS TEMPERATURE

38
INFLOW-OUTFLOW WARM/MOIST CORIOLIS SHEAR

39
155 MPH = 100 lbs per SQUARE FOOT. CUBIC YARD SALT WATER = 3/4 TON. SURGE WINDS

40
HYDROSPHERE-HURRICANE OCEAN PROVIDES MOISTURE

43
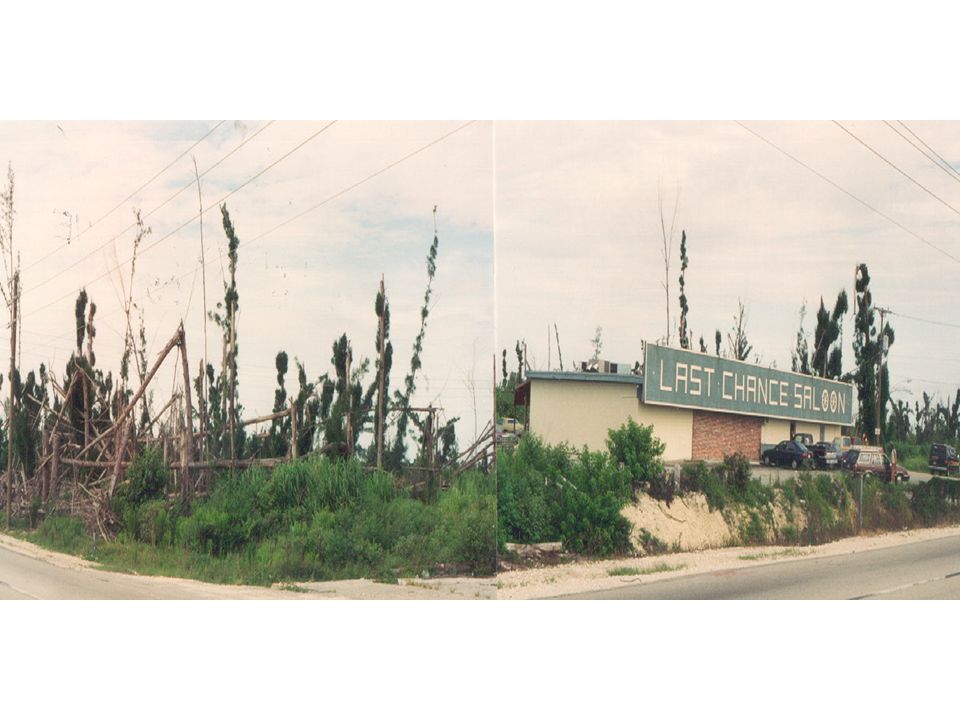
BIOSPHERE-HURRICANE HABITAT DAMAGE

46
Board “Growing” in a Tree Hurricane Andrew, 1992

47
ANTHROPOSPHERE/GEOSPHERE- HURRICANE “A-SPHERE” DEATH & DISTRUCTION

48
1935 FLORIDA KEYS

49
FLORIDA KEYS 1935

50
CAMILLE 1969

51
RICHELIEU APTS. PASS CHRISTIAN HURRICANE CAMILLE

52
AFTER CAMILLE HURRICANE CAMILLE

53
American Legion Post, Bay St. Louis CAMILLE

54
Hurricane Andrew, 1992

56
ERIN 1995

57
OCEANOGRAPHY 101 by ERIN

60
FLOYD ANDREW 19991992

61
WC-130 USAF(RES) HURRICANE HUNTER
 HURRICANE HUNTER")
62
AIRCRAFT RADAR

67
THE BIG ONE IS STILL OUT THERE

Similar presentations


 Topic 8: Storm Systems Chris Parkes Rm 455 Kelvin Building.>")


 and the Tropic of Capricorn (23.5S) The weather is very different.>")

 fuel (latent.>")


